-
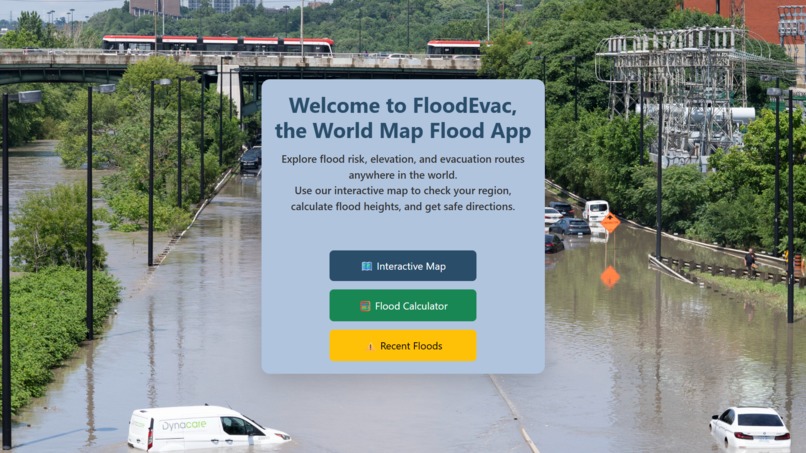
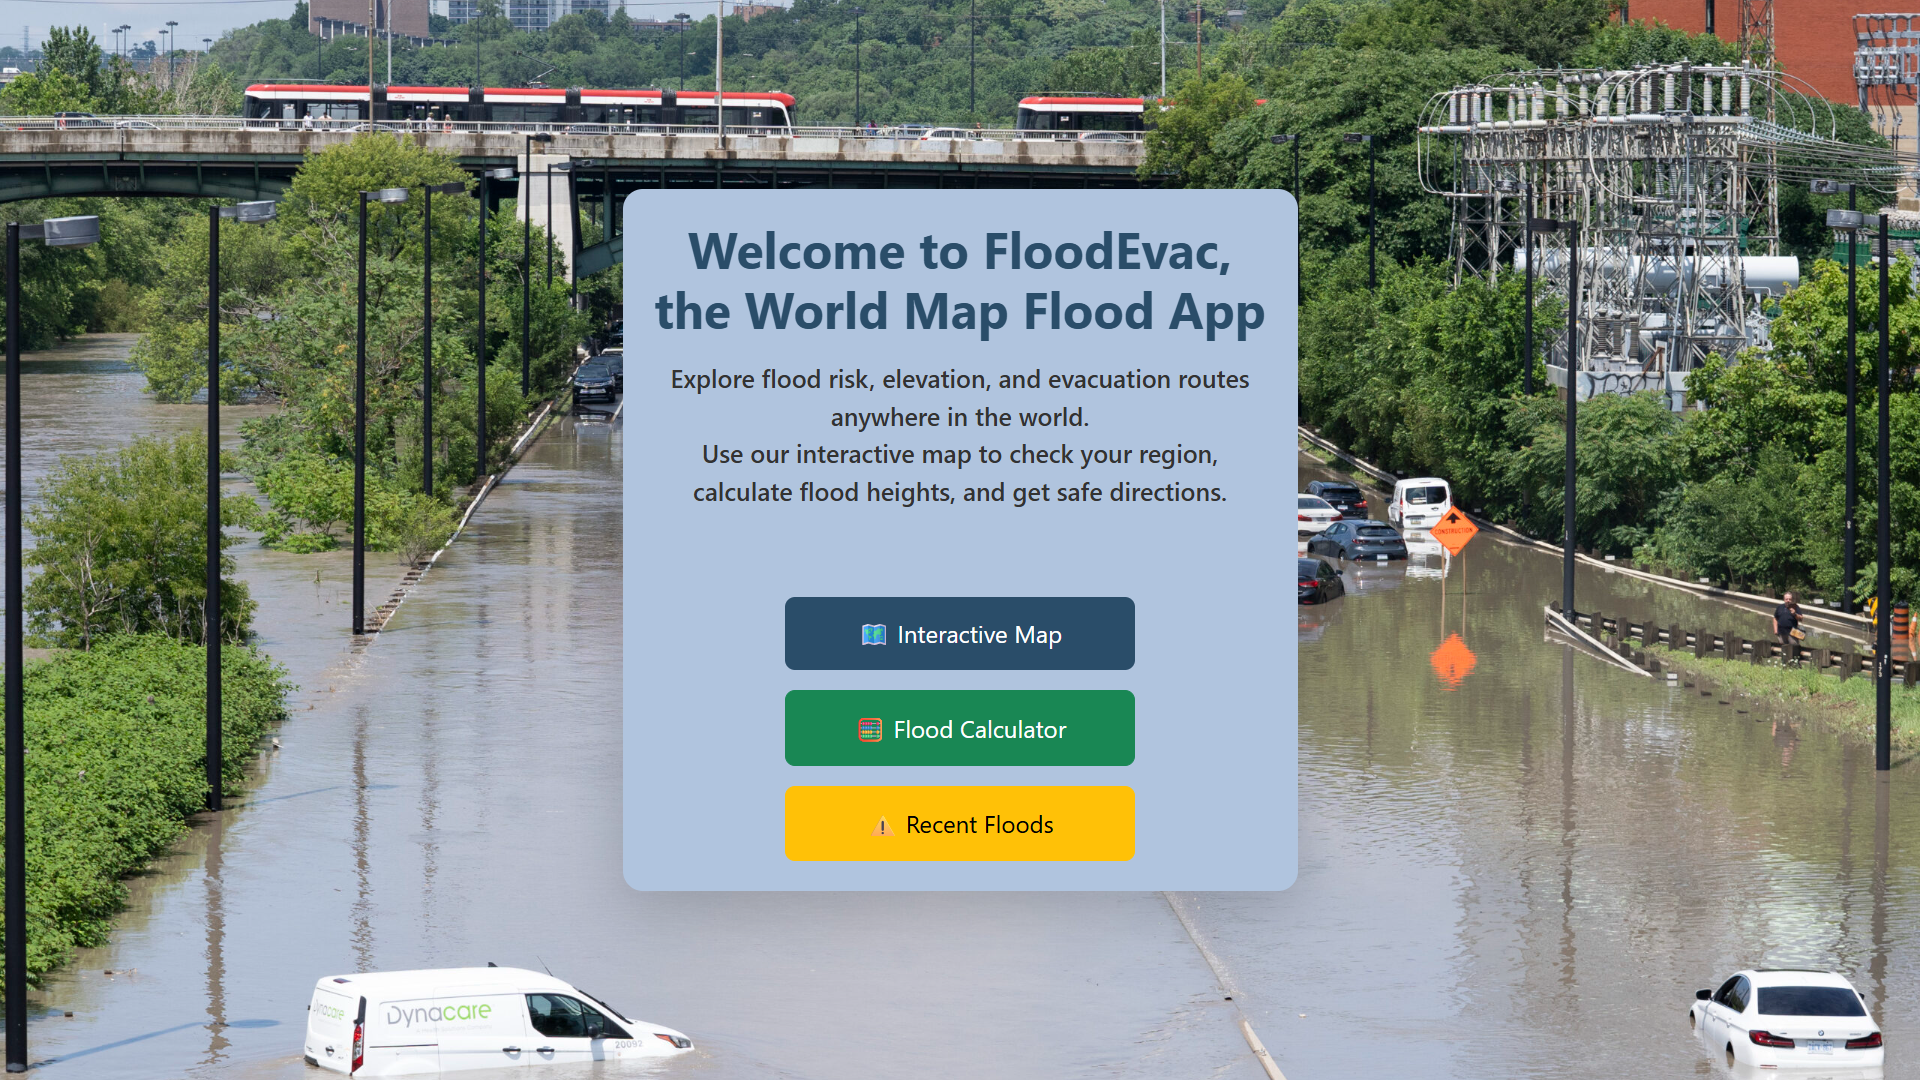
Home Page (index)
-
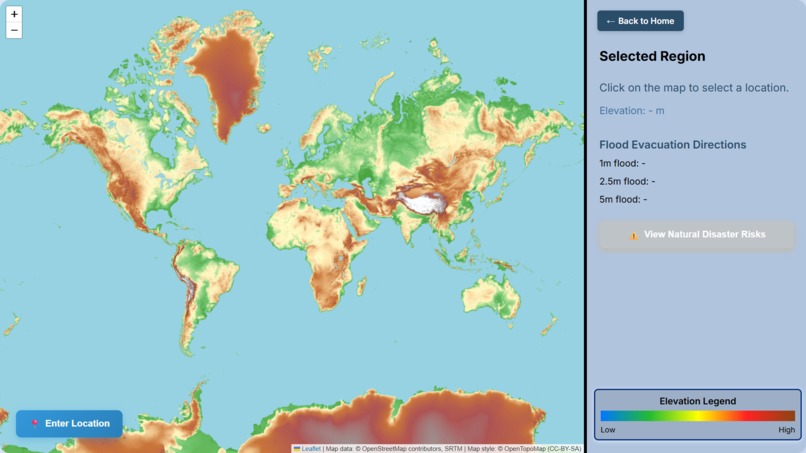
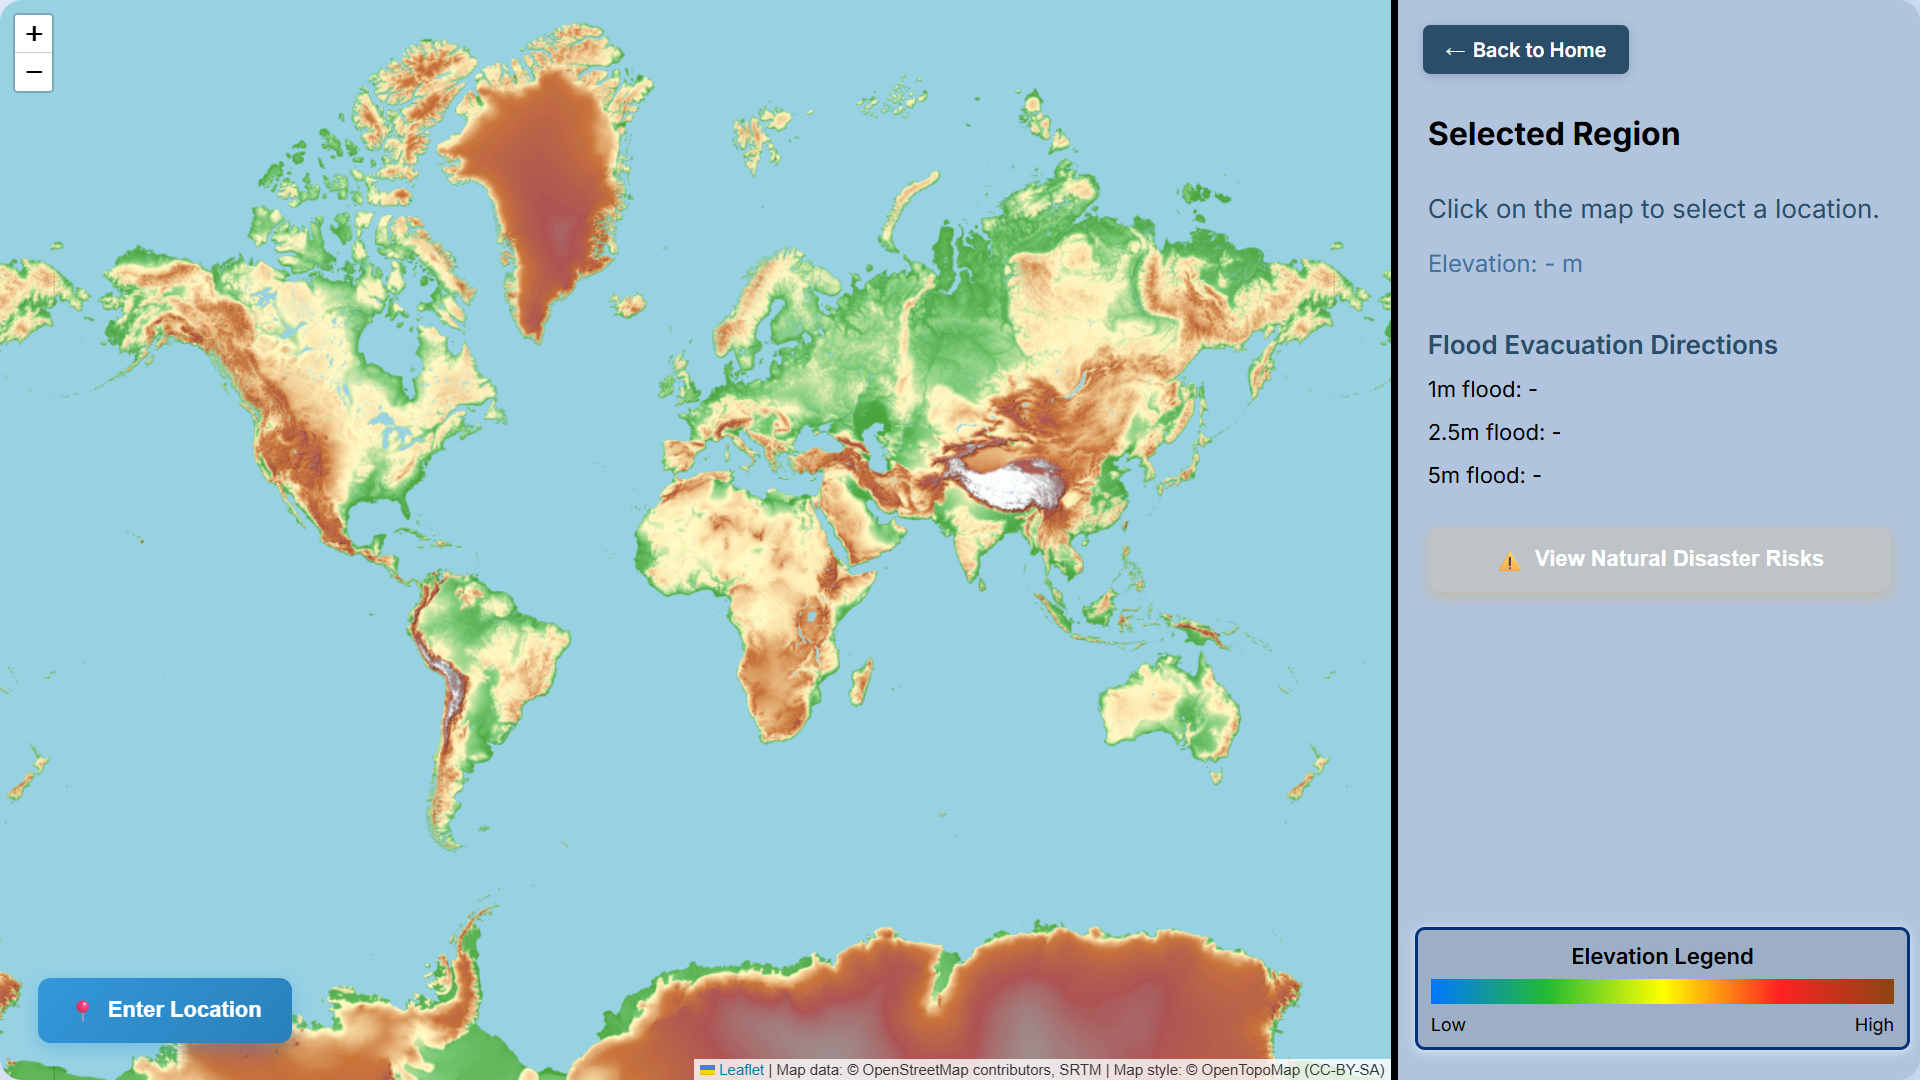
Map screen - initial page
-
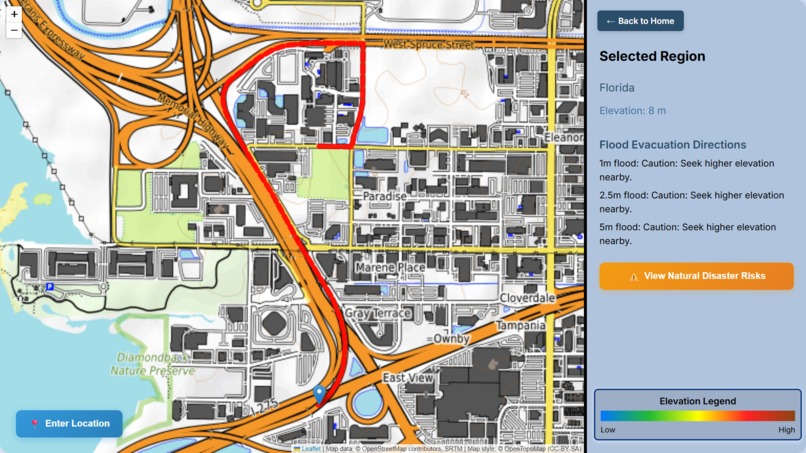
show of pathfinding to higher elevations on map
-
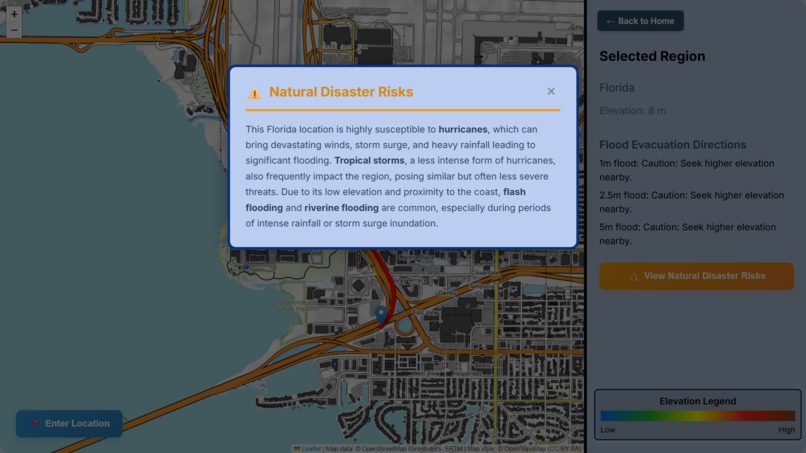
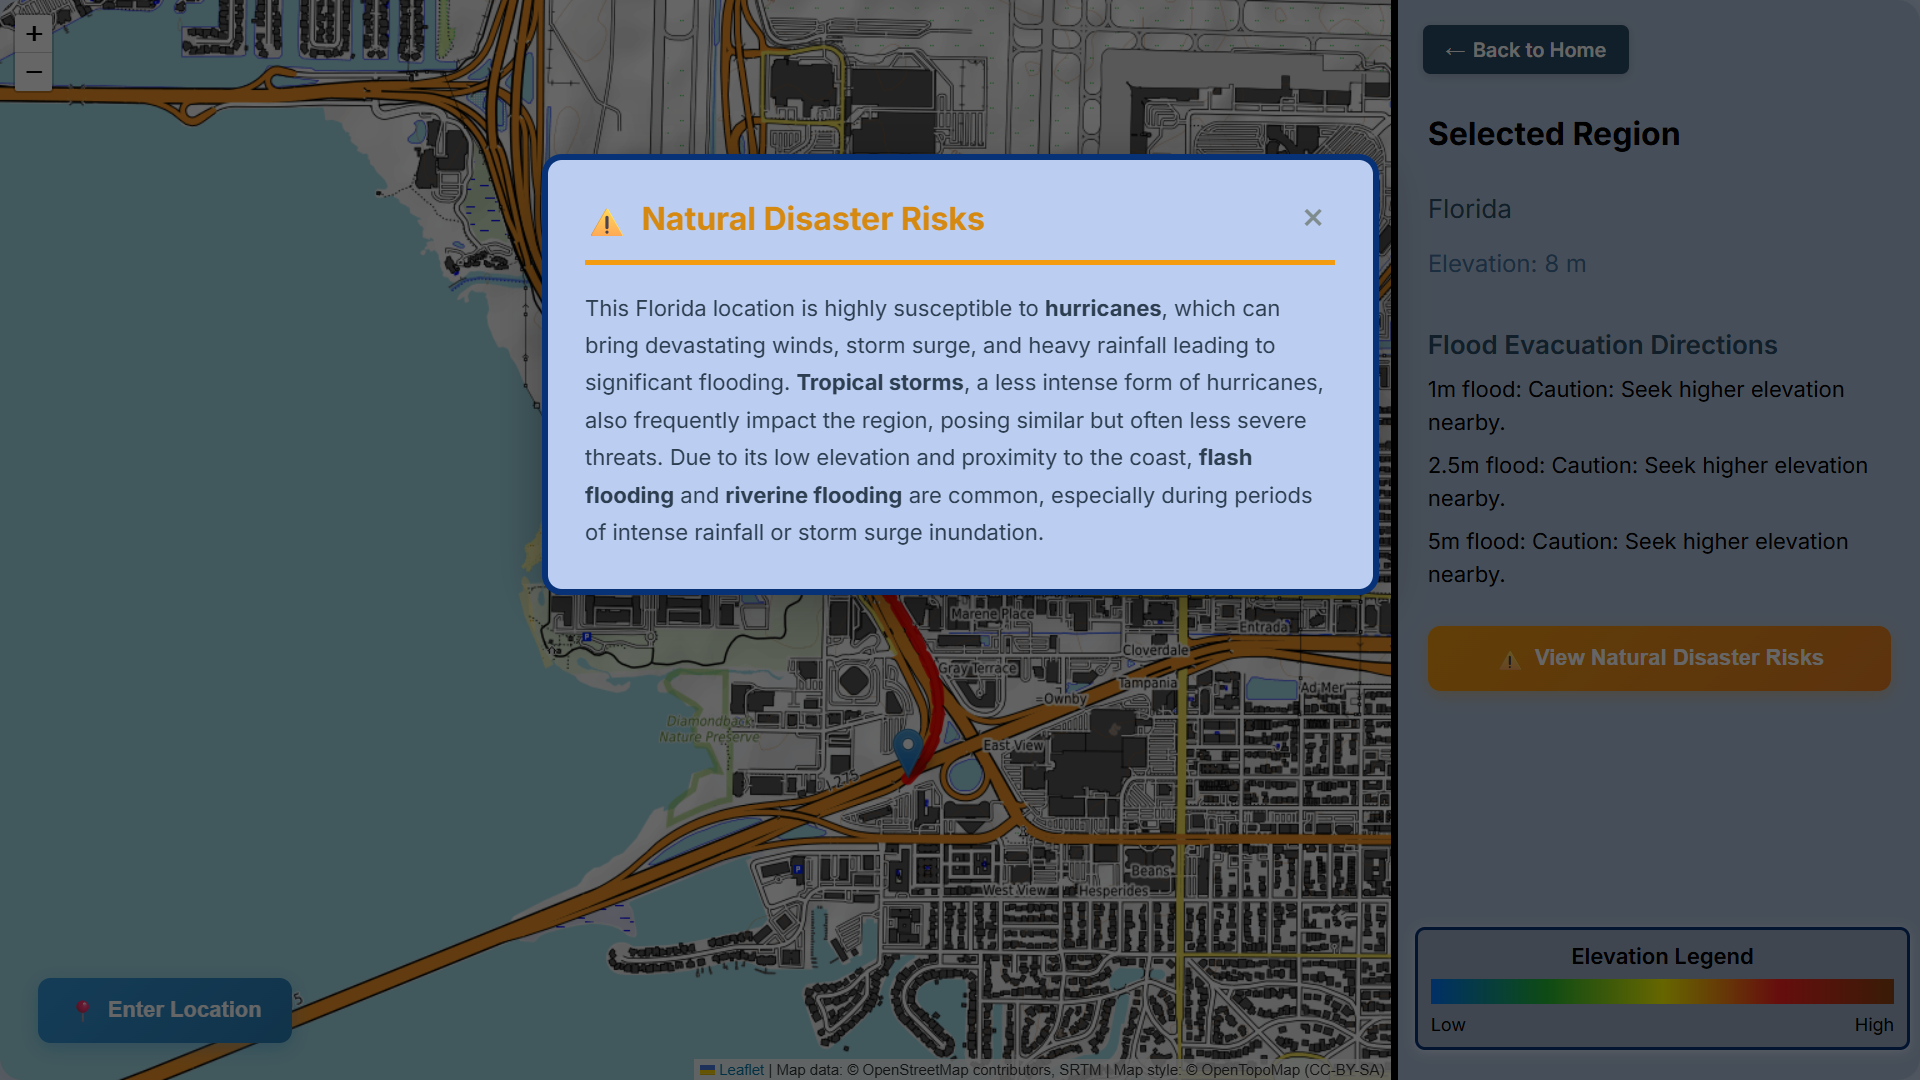
Gemini-Generated briefing on some frequent natural disasters that happen near selected location
-
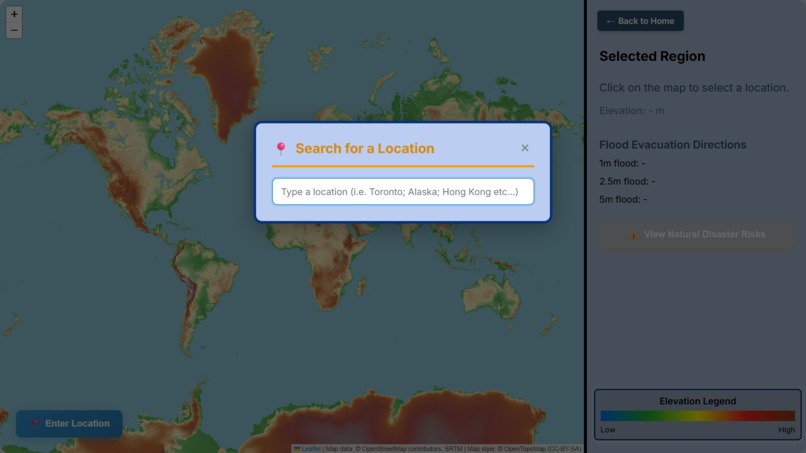
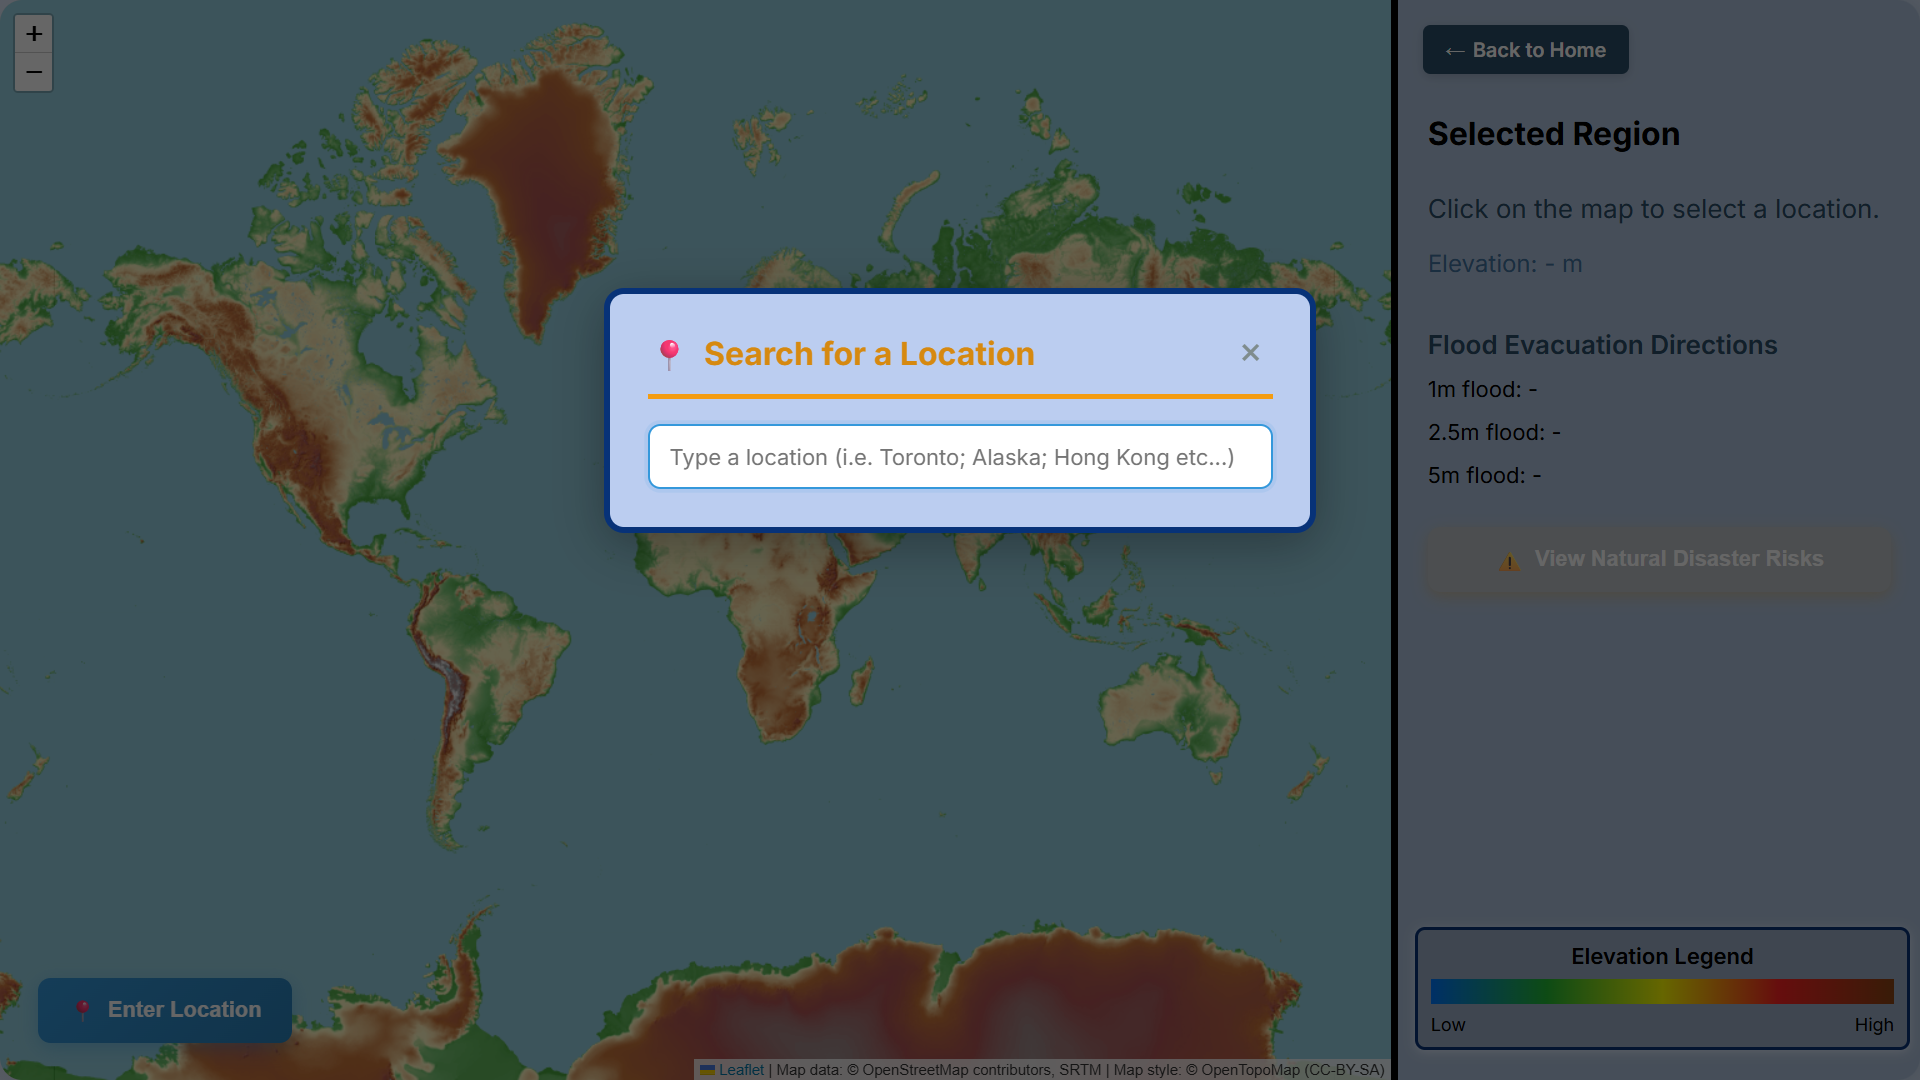
Entering Location pop-up (empty)
-
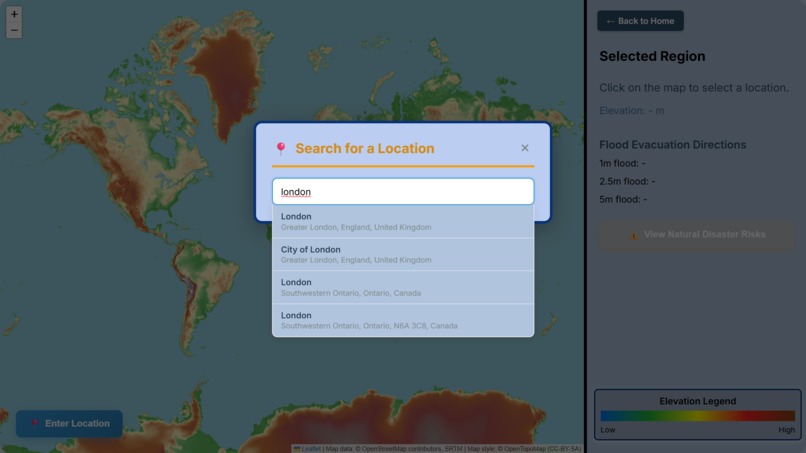
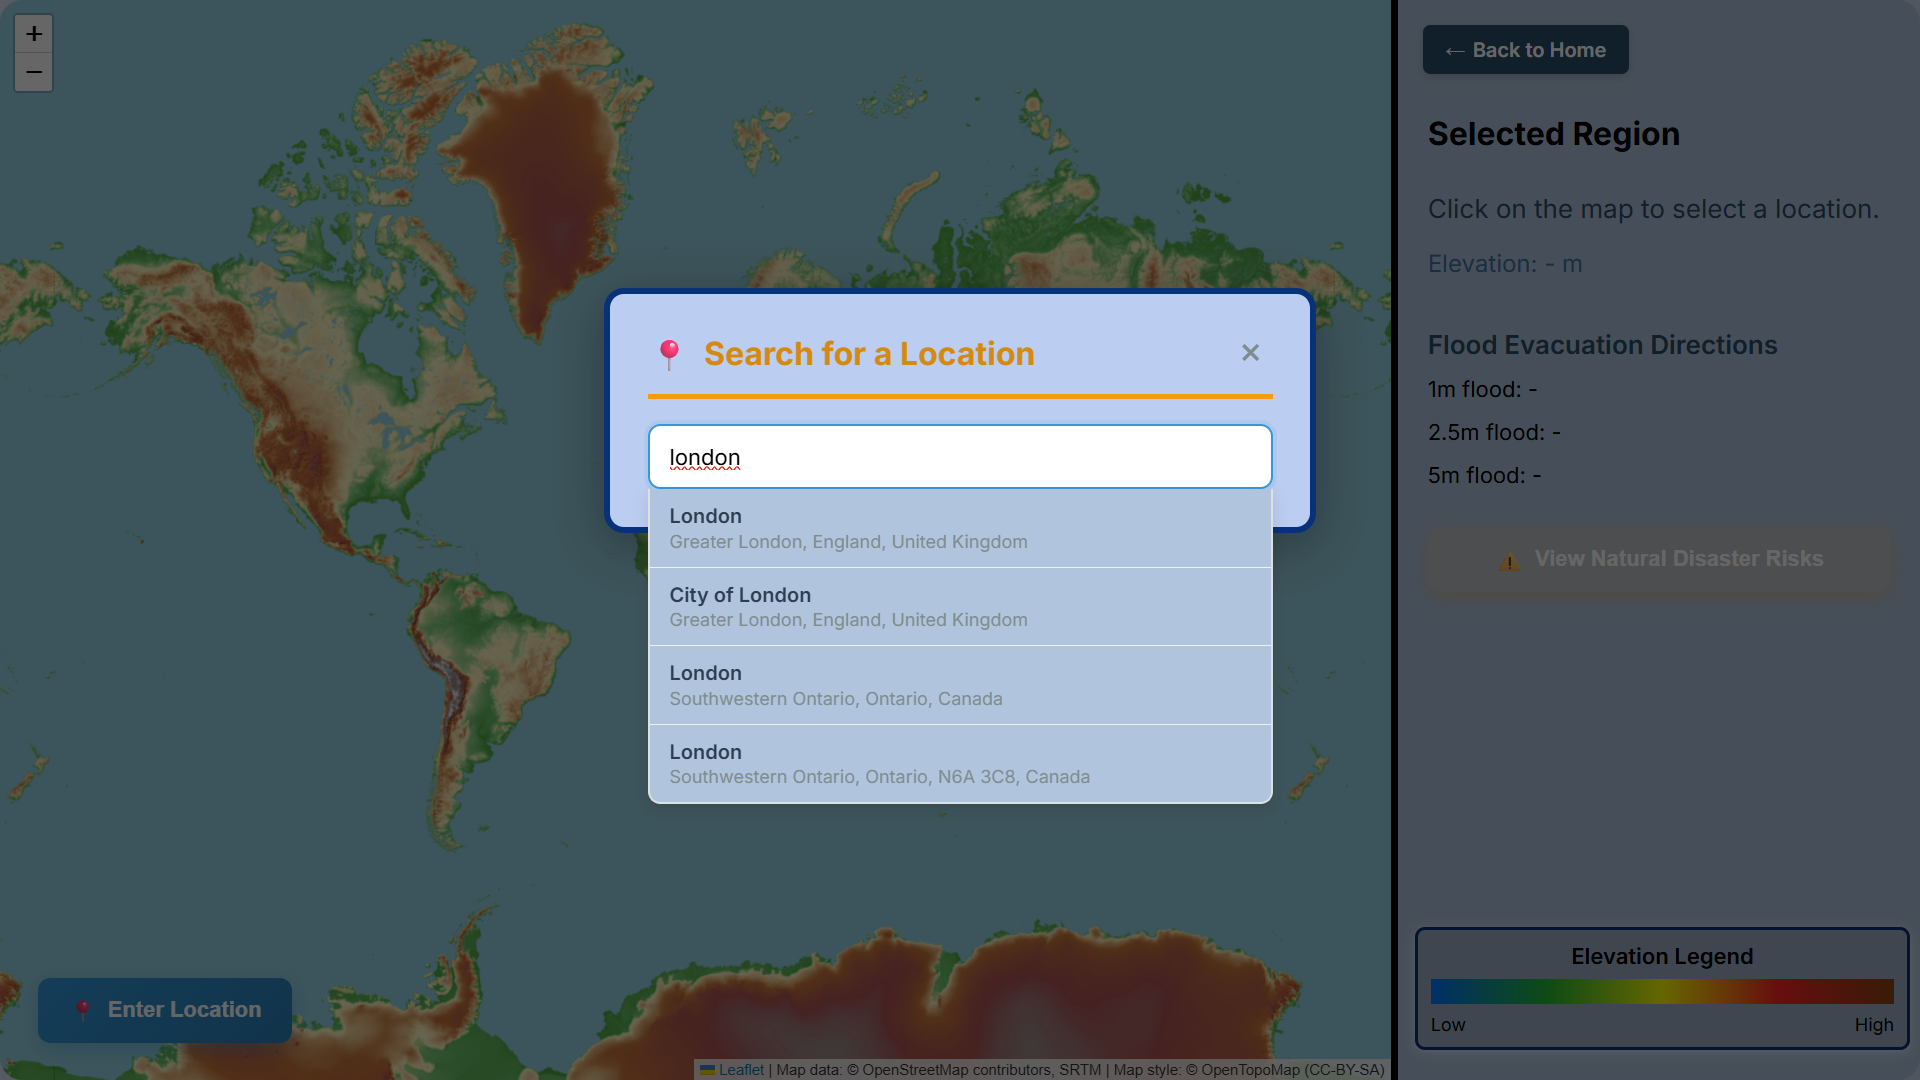
Entering Location pop-up (recommendations)
-
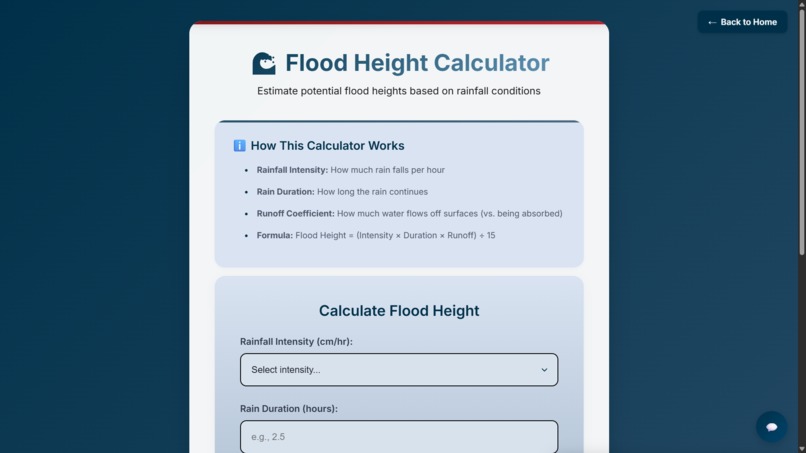
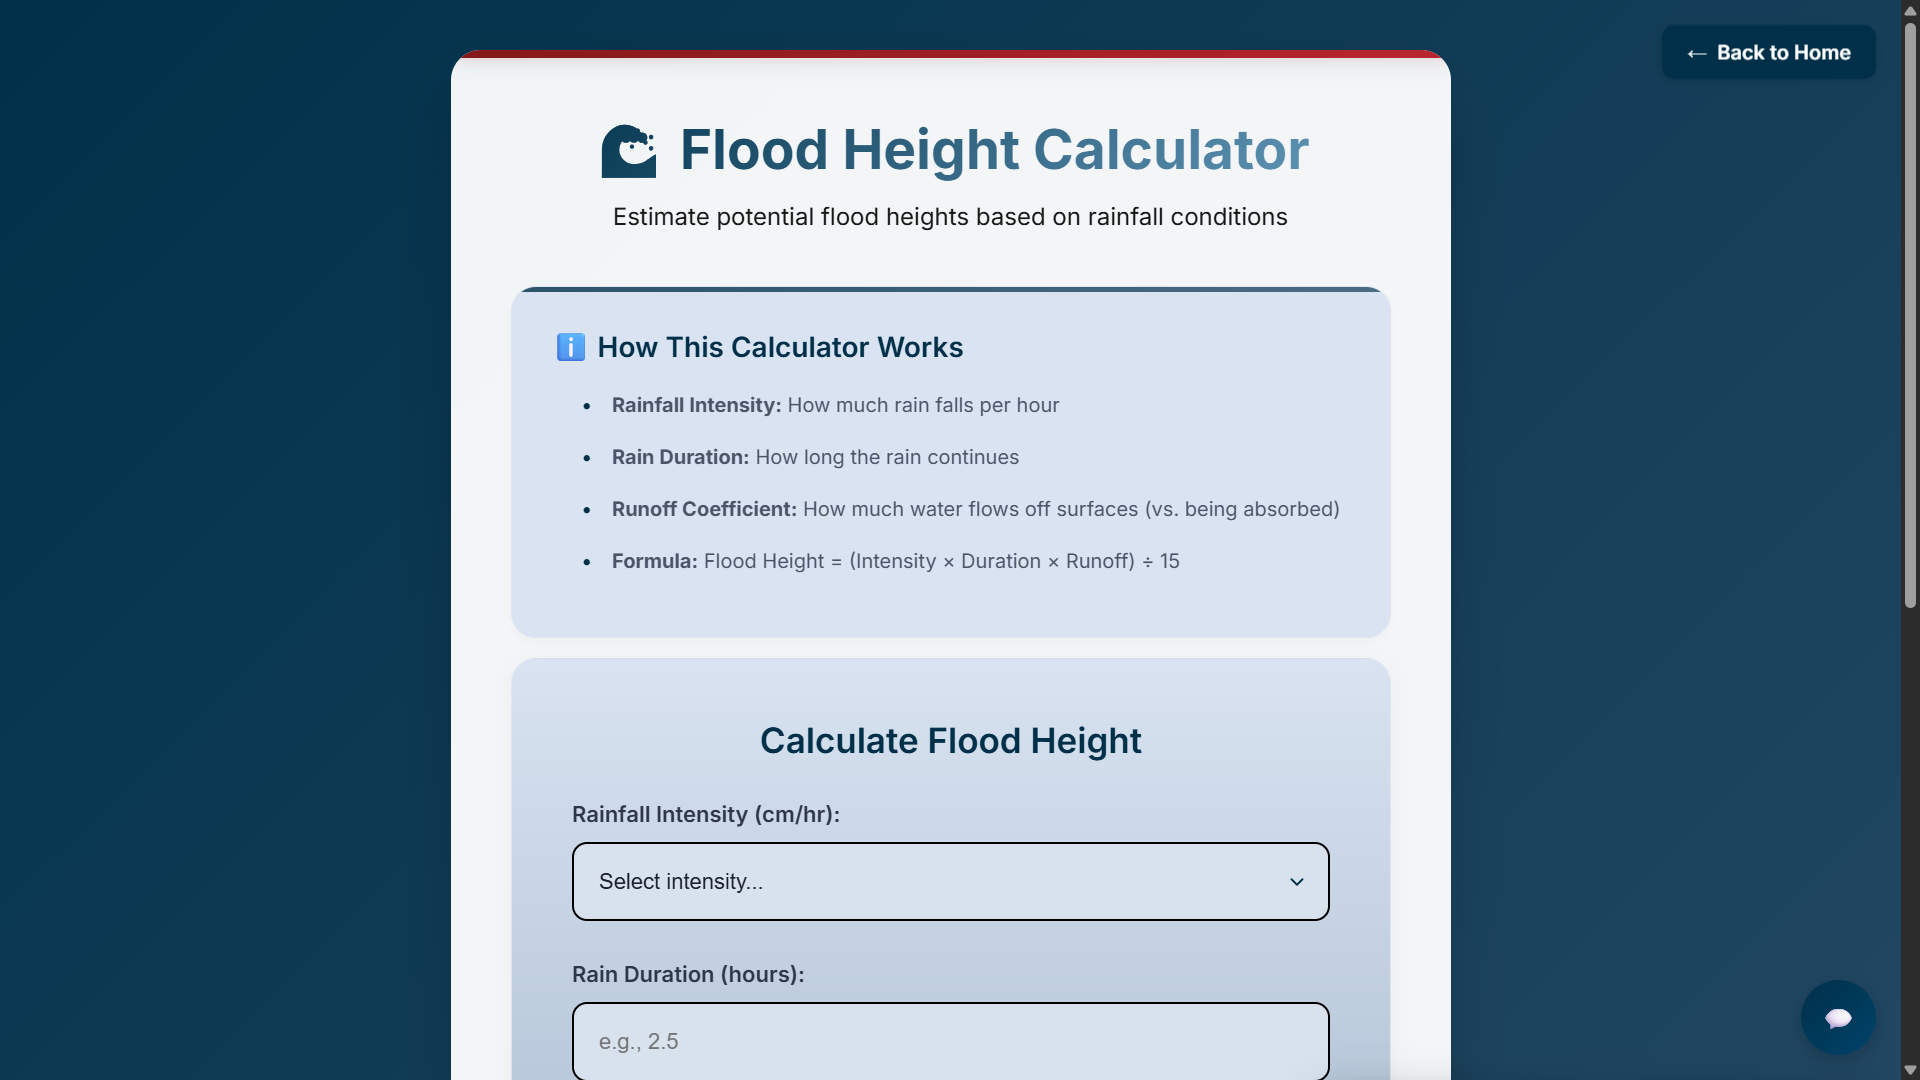
Flood Calculator (Top Half)
-
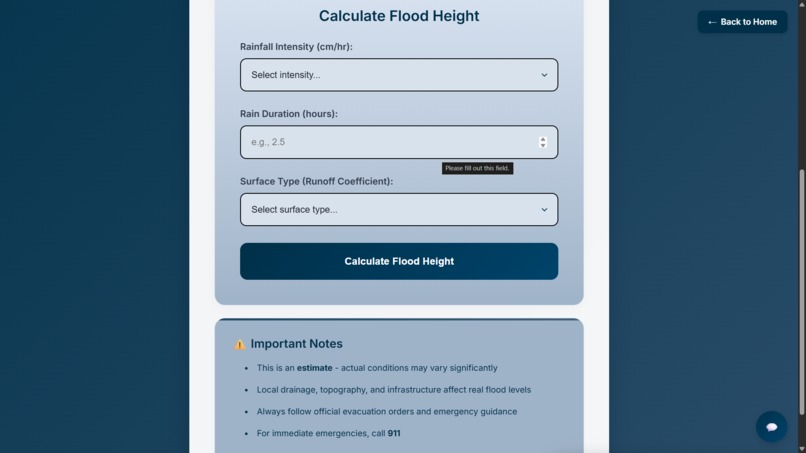
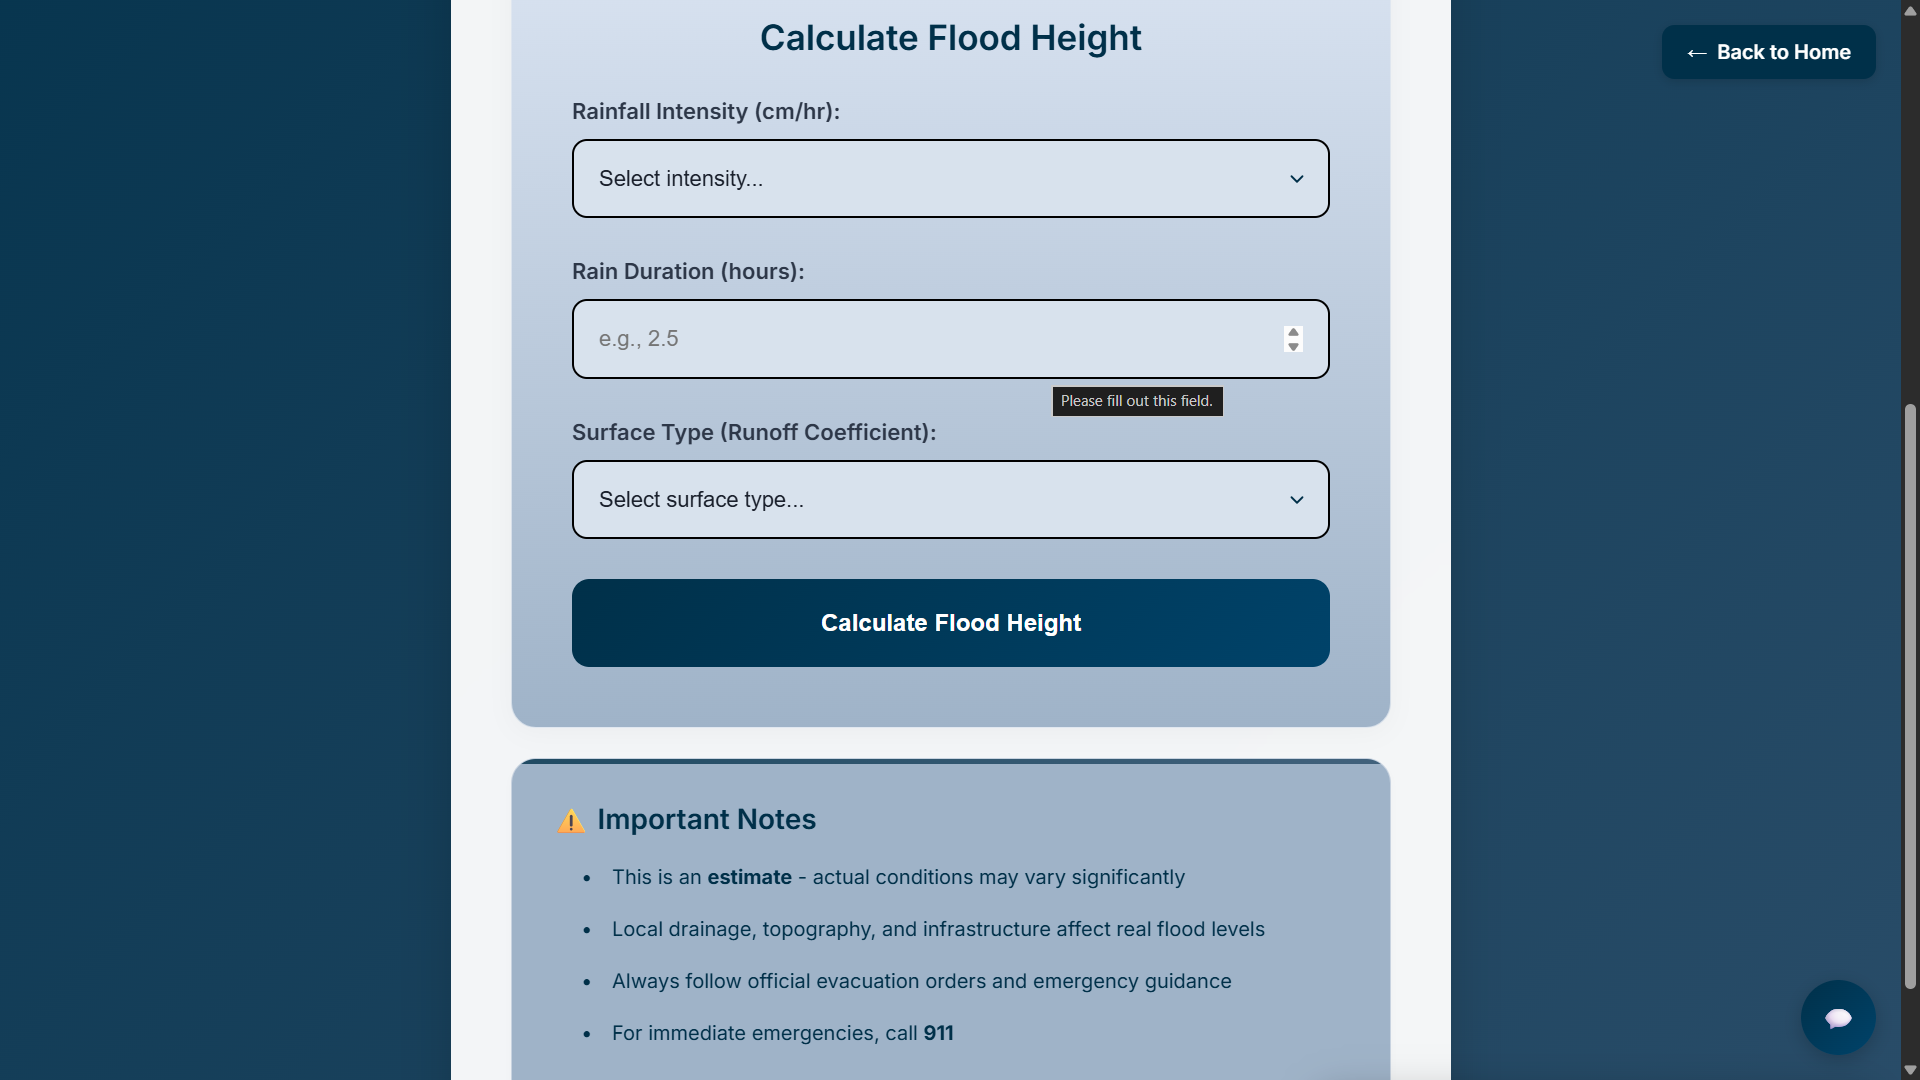
Flood Calculator (bottom half)
-
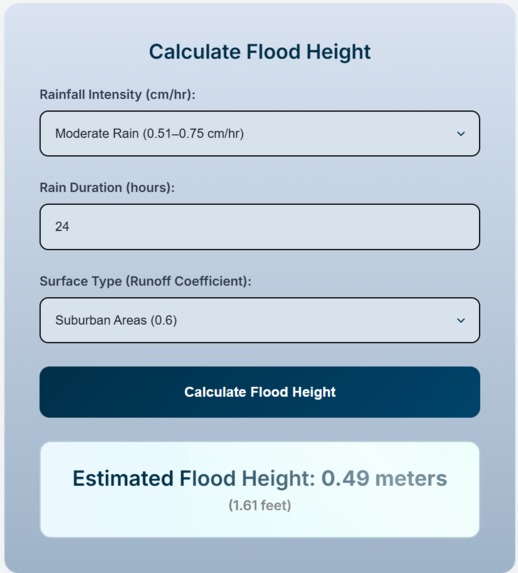
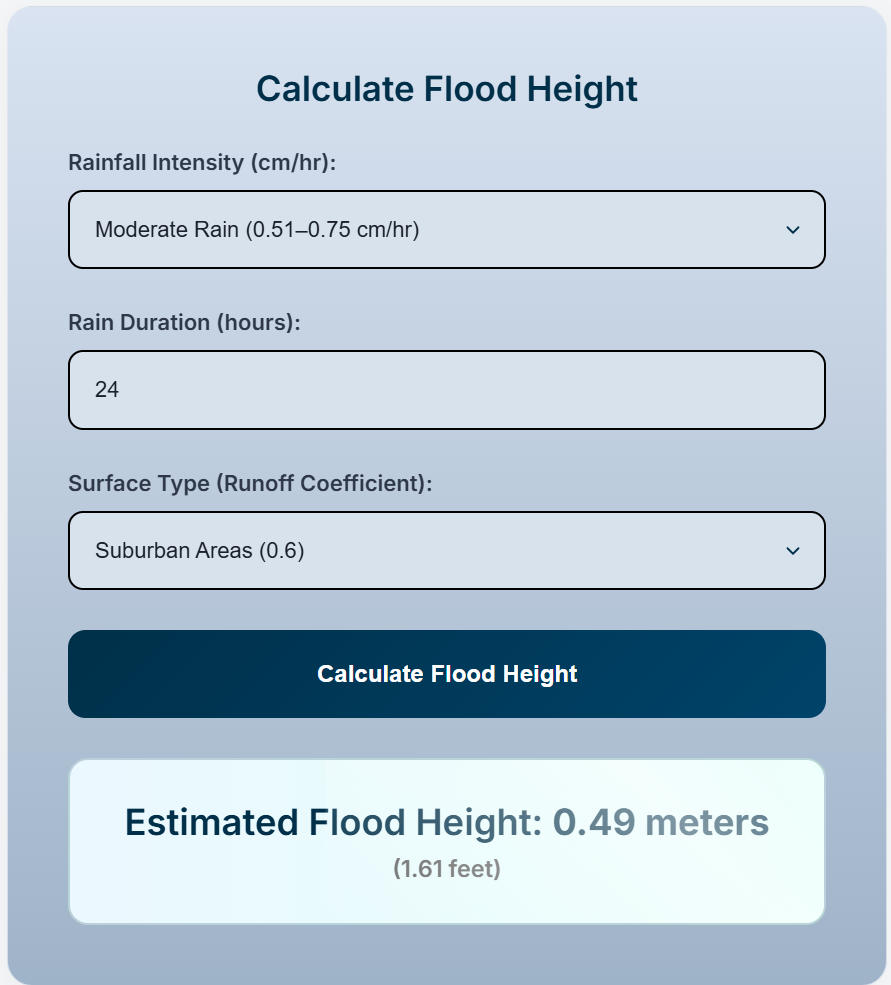
Flood calculator being used to estimate flood height.
-
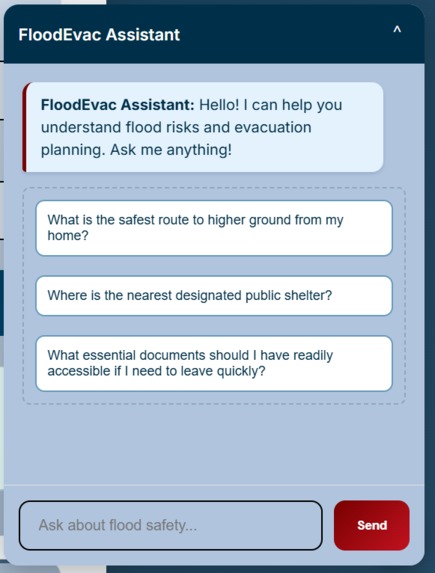
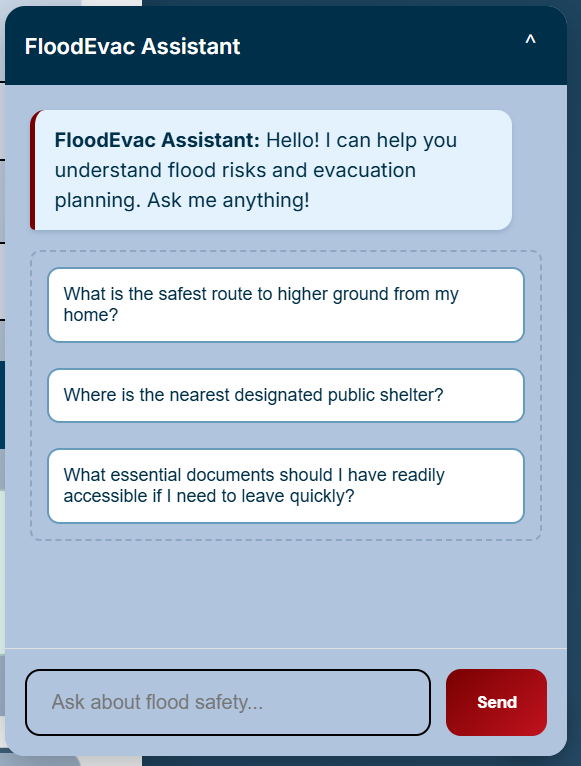
beginning screen of the popup for the chat under flood calculator; contains question suggestions
-
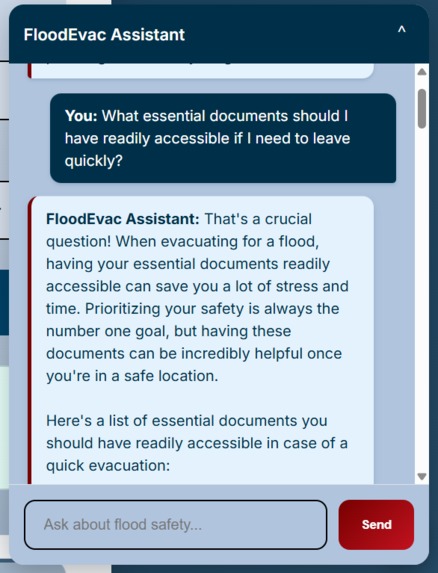
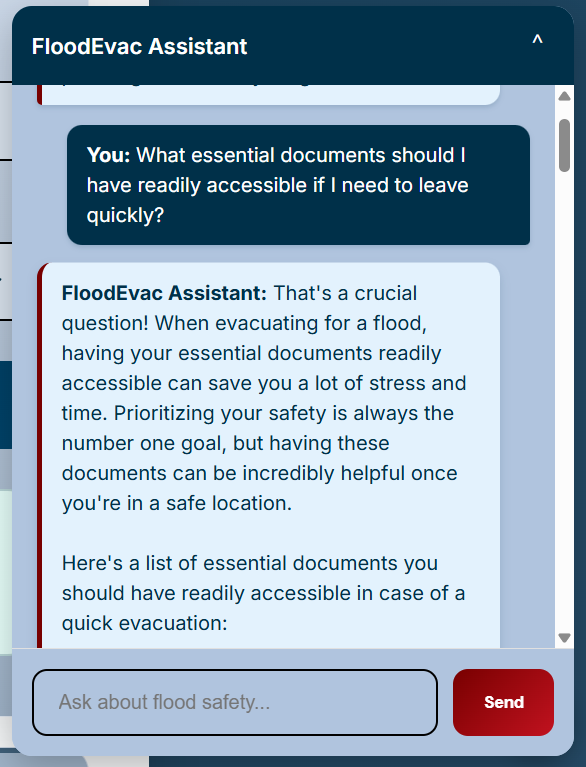
FloodEvac Assistant responds to a chat message
-
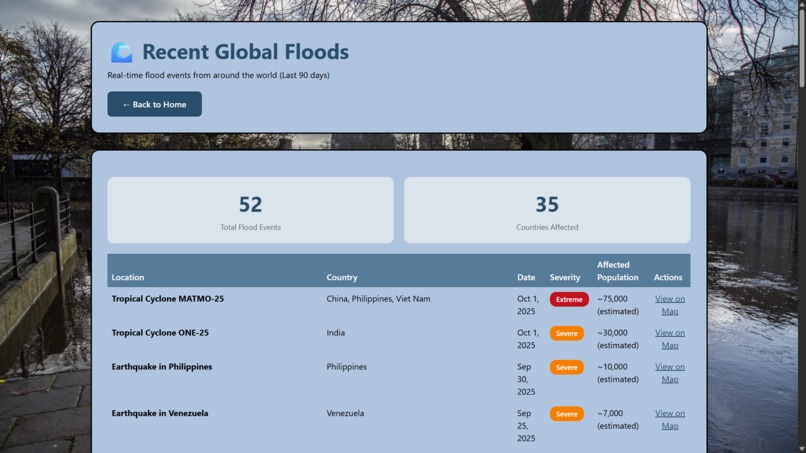
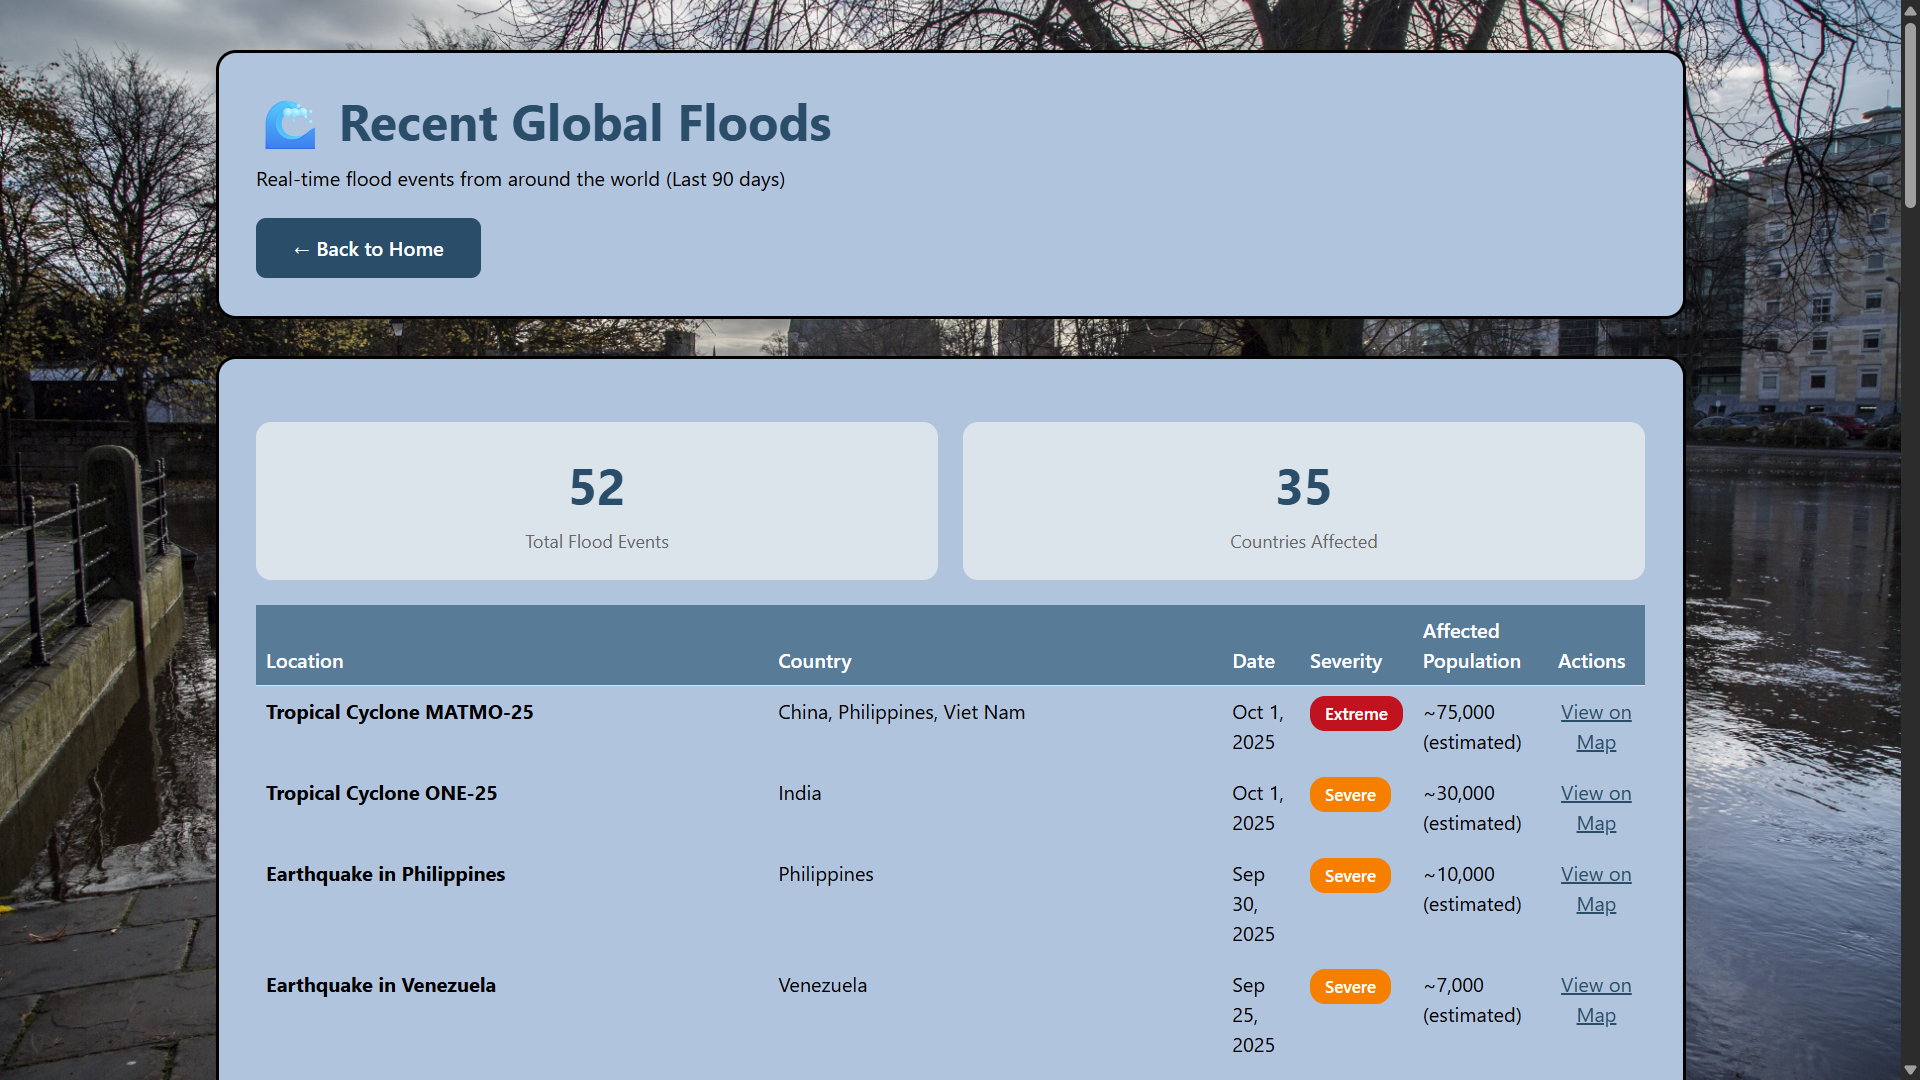
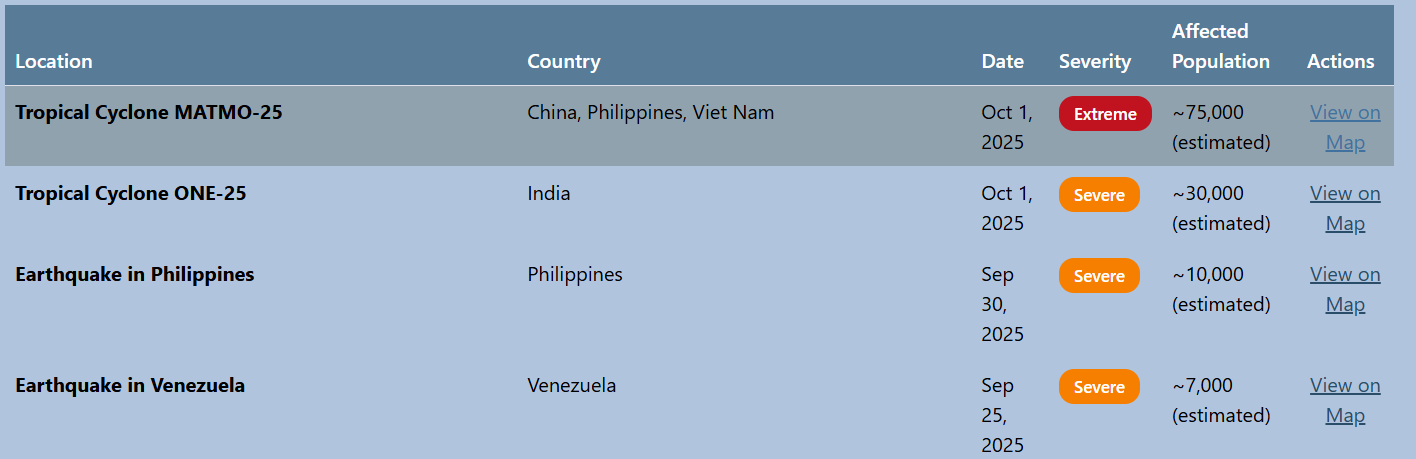
Recent Natural Disasters List
-
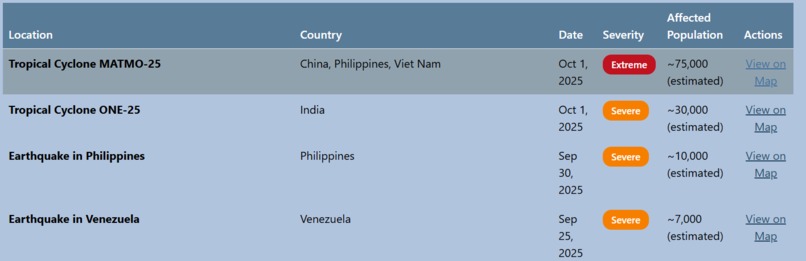
list of recent natural disasters, with hover effect. Shows that the link to open this location is clickable.

Inspiration
Climate change is accelerating the frequency and intensity of flood disasters worldwide. According to recent studies, flood events have increased by over 50% in the past two decades, with warmer temperatures causing more intense rainfall, rising sea levels threatening coastal communities, and changing weather patterns creating unprecedented flooding in historically safe areas. The 2024 floods across Europe, Asia, and North America demonstrated that no region is immune to this growing crisis.
We were inspired by the environmental emergency we face and the urgent need for accessible, real-time flood information. Climate change doesn't just threaten future generations—it's affecting communities right now. Millions of people live in flood-prone areas without knowing their risk level or having access to tools that could save their lives during emergencies. We wanted to create a solution that empowers individuals and communities to understand their changing environmental risks and take action.
The intersection of climate change and disaster preparedness became our driving force. As extreme weather events become the "new normal," we need tools that adapt to our changing planet. FloodEvac represents our commitment to environmental awareness and community resilience in the face of climate-driven disasters.
What it does
FloodEvac is a comprehensive web platform addressing the climate-driven flood crisis through three core functionalities:
Interactive Flood Risk Mapping: Users can search any location worldwide and instantly view elevation data, topographical features, and disaster risk indicators. As climate change alters traditional flood patterns, understanding your local geography becomes critical. The map interface allows for intuitive exploration of flood-prone areas and identification of safer zones, helping communities adapt to their changing environmental reality.
Intelligent Flood Calculator: By inputting coordinates and flood severity levels (1-10), users receive personalized flood height predictions and safety recommendations. As climate change intensifies storms and rainfall, this tool helps people understand how "once-in-a-century" floods are becoming regular occurrences. The calculator considers elevation data and flood intensity to estimate potential water levels at any location.
Real-Time Flood Monitoring: Integration with GDACS (Global Disaster Alert and Coordination System) provides a live dashboard of ongoing flood events worldwide, including severity levels, affected populations, and precise locations. This global view highlights the widespread impact of climate change on flood patterns, showing events that would have been rare a decade ago are now commonplace. Users can click directly from the dashboard to view any flood event on the interactive map.
AI-Powered Environmental Assistant: A chat interface powered by Google Gemini AI answers flood-related questions, provides evacuation guidance, and offers context-aware safety recommendations. The AI is trained to discuss climate adaptation strategies and helps users understand how environmental changes affect their local flood risk.
How we built it
Backend Architecture: We built the application using Flask as our web framework, chosen for its simplicity and Python ecosystem compatibility. The backend handles API orchestration, connecting multiple external services seamlessly while prioritizing low server resource usage—a small contribution to reducing our digital carbon footprint.
Data Integration: We integrated four major APIs:
- Open-Elevation API for real-time elevation data at any coordinate
- GDACS API for current flood event data worldwide, tracking the increasing frequency of climate-related disasters
- Nominatim (OpenStreetMap) for geocoding and location search
- Google Gemini AI for intelligent, climate-aware chat responses
Frontend Development: The user interface leverages Leaflet.js for interactive mapping, providing smooth pan/zoom functionality and marker placement. We implemented custom CSS with modern design principles—using a cohesive color scheme (#b0c4de light blue theme inspired by water), smooth animations, and responsive layouts. Bootstrap 5 provides the responsive grid system ensuring mobile compatibility, crucial for emergency access in disaster situations.
Algorithms: The flood height calculation uses a mathematical model calibrated for increasingly severe weather events:
$$h = (intensity \cdot duration \cdot runoff) \div 15$$
AI Integration: We crafted specific system prompts for the Gemini AI to ensure responses incorporate climate change context, environmental awareness, and practical adaptation strategies. The AI discusses not just immediate safety but also long-term climate resilience and community preparedness for worsening conditions.
Challenges we ran for
API Rate Limiting and Reliability: External APIs occasionally experienced downtime or rate limiting. We implemented robust error handling with try-catch blocks and user-friendly error messages. For the elevation API, we added fallback logic to handle missing data gracefully—crucial when every second counts during a climate emergency.
Real-Time Data Synchronization: Parsing GDACS XML data proved challenging due to inconsistent data formats across different flood events. As climate change creates unprecedented disaster scenarios, data standards haven't kept pace. We built flexible parsing logic that handles missing fields and normalizes data into a consistent structure for the frontend.
Data Accuracy and Climate Context: Ensuring our flood predictions account for climate change's accelerating impacts required careful calibration. Historical flood data becomes less reliable as "100-year floods" now occur every few years in many regions.
Map Performance: Loading and rendering large datasets on the map caused performance issues. We optimized by implementing lazy loading for flood event markers and limiting the number of simultaneous API calls—balancing comprehensive information with energy-efficient code execution.
CSS Conflicts: Bootstrap's default styles conflicted with our custom design. We discovered that Bootstrap's .table class was overriding our custom color scheme with !important declarations. Solution: We added even more specific selectors with !important flags to ensure our styling took precedence.
URL Parameter Handling: Initially, clicking "View on Map" from the Recent Floods page didn't navigate to the correct location. The map page wasn't reading URL parameters. We implemented URLSearchParams to parse query strings and automatically trigger the map navigation on page load.
Environmental Data Communication: Presenting the severity of climate-driven floods without causing panic while still conveying urgency required careful UX design. We iterated on messaging to be both honest and actionable.
AI Response Consistency: Getting the AI to provide consistently helpful responses that balance immediate safety with climate awareness required iterative prompt engineering. We refined the system prompt multiple times to include environmental context without overwhelming users during emergencies.
Accomplishments that we're proud of
- Climate Awareness Platform: Creating a tool that directly addresses climate change impacts while empowering individual action
- Seamless Integration: Successfully orchestrating four different APIs into a cohesive user experience
- Environmental Education: Helping users understand how climate change affects their local flood risk through intuitive visualizations
- Global Reach: Making flood risk information accessible for any location on Earth, democratizing climate adaptation tools
- Real-Time Climate Monitoring: Displaying live flood events worldwide, creating awareness of the global scale of climate-driven disasters
- Accessible Emergency Tool: Building an interface simple enough for emergency use yet powerful enough for detailed climate risk analysis
- AI-Powered Climate Communication: Implementing a chatbot that discusses both immediate safety and long-term environmental resilience
What we learned
Climate Data Complexity: We gained deep understanding of how climate change complicates disaster prediction, as historical patterns become less reliable predictors of future events.
Environmental Communication: We learned to balance scientific accuracy about climate risks with actionable, empowering messaging that motivates rather than paralyzes users.
API Integration Mastery: We gained deep experience in working with multiple external APIs, handling asynchronous requests, and managing data transformations between different formats (JSON, XML, GeoJSON).
Geospatial Climate Analysis: Working with elevation data taught us how rising sea levels and changing precipitation patterns interact with geography to create new flood risks.
Error Handling Best Practices: Real-world API failures taught us to always expect the unexpected—much like how communities must prepare for unprecedented climate events.
User-Centric Design: Through testing, we learned that emergency tools must be immediately understandable—no user manuals allowed during a climate disaster.
The Scale of Climate Impact: Integrating GDACS data made the global nature of climate-driven flooding visceral. Seeing dozens of simultaneous flood events worldwide reinforced why this work matters.
What's next for FloodEvac
Climate Projection Integration: Incorporate IPCC climate models to show projected flood risks for 2030, 2050, and 2100 under different emissions scenarios, helping communities plan long-term adaptation strategies.
Carbon Impact Calculator: Add a feature showing the carbon footprint of different evacuation methods and recovery activities, promoting environmentally conscious disaster response.
Enhanced Prediction Models: Incorporate machine learning trained on recent climate data to improve flood height predictions, accounting for the accelerating rate of extreme weather events.
Sea Level Rise Visualization: Show how projected sea level rise will affect coastal areas over time, making abstract climate projections personally relevant.
Community Climate Action Hub: Create forums where users share local climate adaptation strategies, building collective resilience against environmental change.
Mobile Application: Develop native iOS and Android apps with offline map capabilities for areas with poor connectivity during disasters—essential as climate change threatens infrastructure.
Push Notifications: Implement a subscription system that alerts users when floods are detected near their saved locations, providing early warning in our increasingly unpredictable climate.
Ecosystem Integration: Partner with environmental organizations and climate scientists to incorporate biodiversity impacts, showing how floods affect local ecosystems and wildlife.
Historical Climate Data Visualization: Add time-series analysis showing how flood patterns have changed over decades, creating visual evidence of climate change impacts at the local level.
Green Infrastructure Mapping: Identify and promote natural flood defenses like wetlands, forests, and green spaces that provide climate adaptation benefits while sequestering carbon.
Integration with Climate Policy: Connect users with local climate action initiatives and policy makers, turning individual awareness into collective environmental advocacy.
Satellite Imagery Integration: Incorporate real-time satellite data to show actual flood extent and environmental damage, documenting climate change impacts in real-time.
Renewable Energy Evacuation Centers: Map emergency shelters powered by renewable energy, promoting climate-resilient infrastructure that doesn't contribute to the problem.
Built With
- css
- flask
- gdacs
- gemini
- html
- leaflet.js
- open-elevation
- openstreetmap
- opentopomap
- python


Log in or sign up for Devpost to join the conversation.