Inspiration
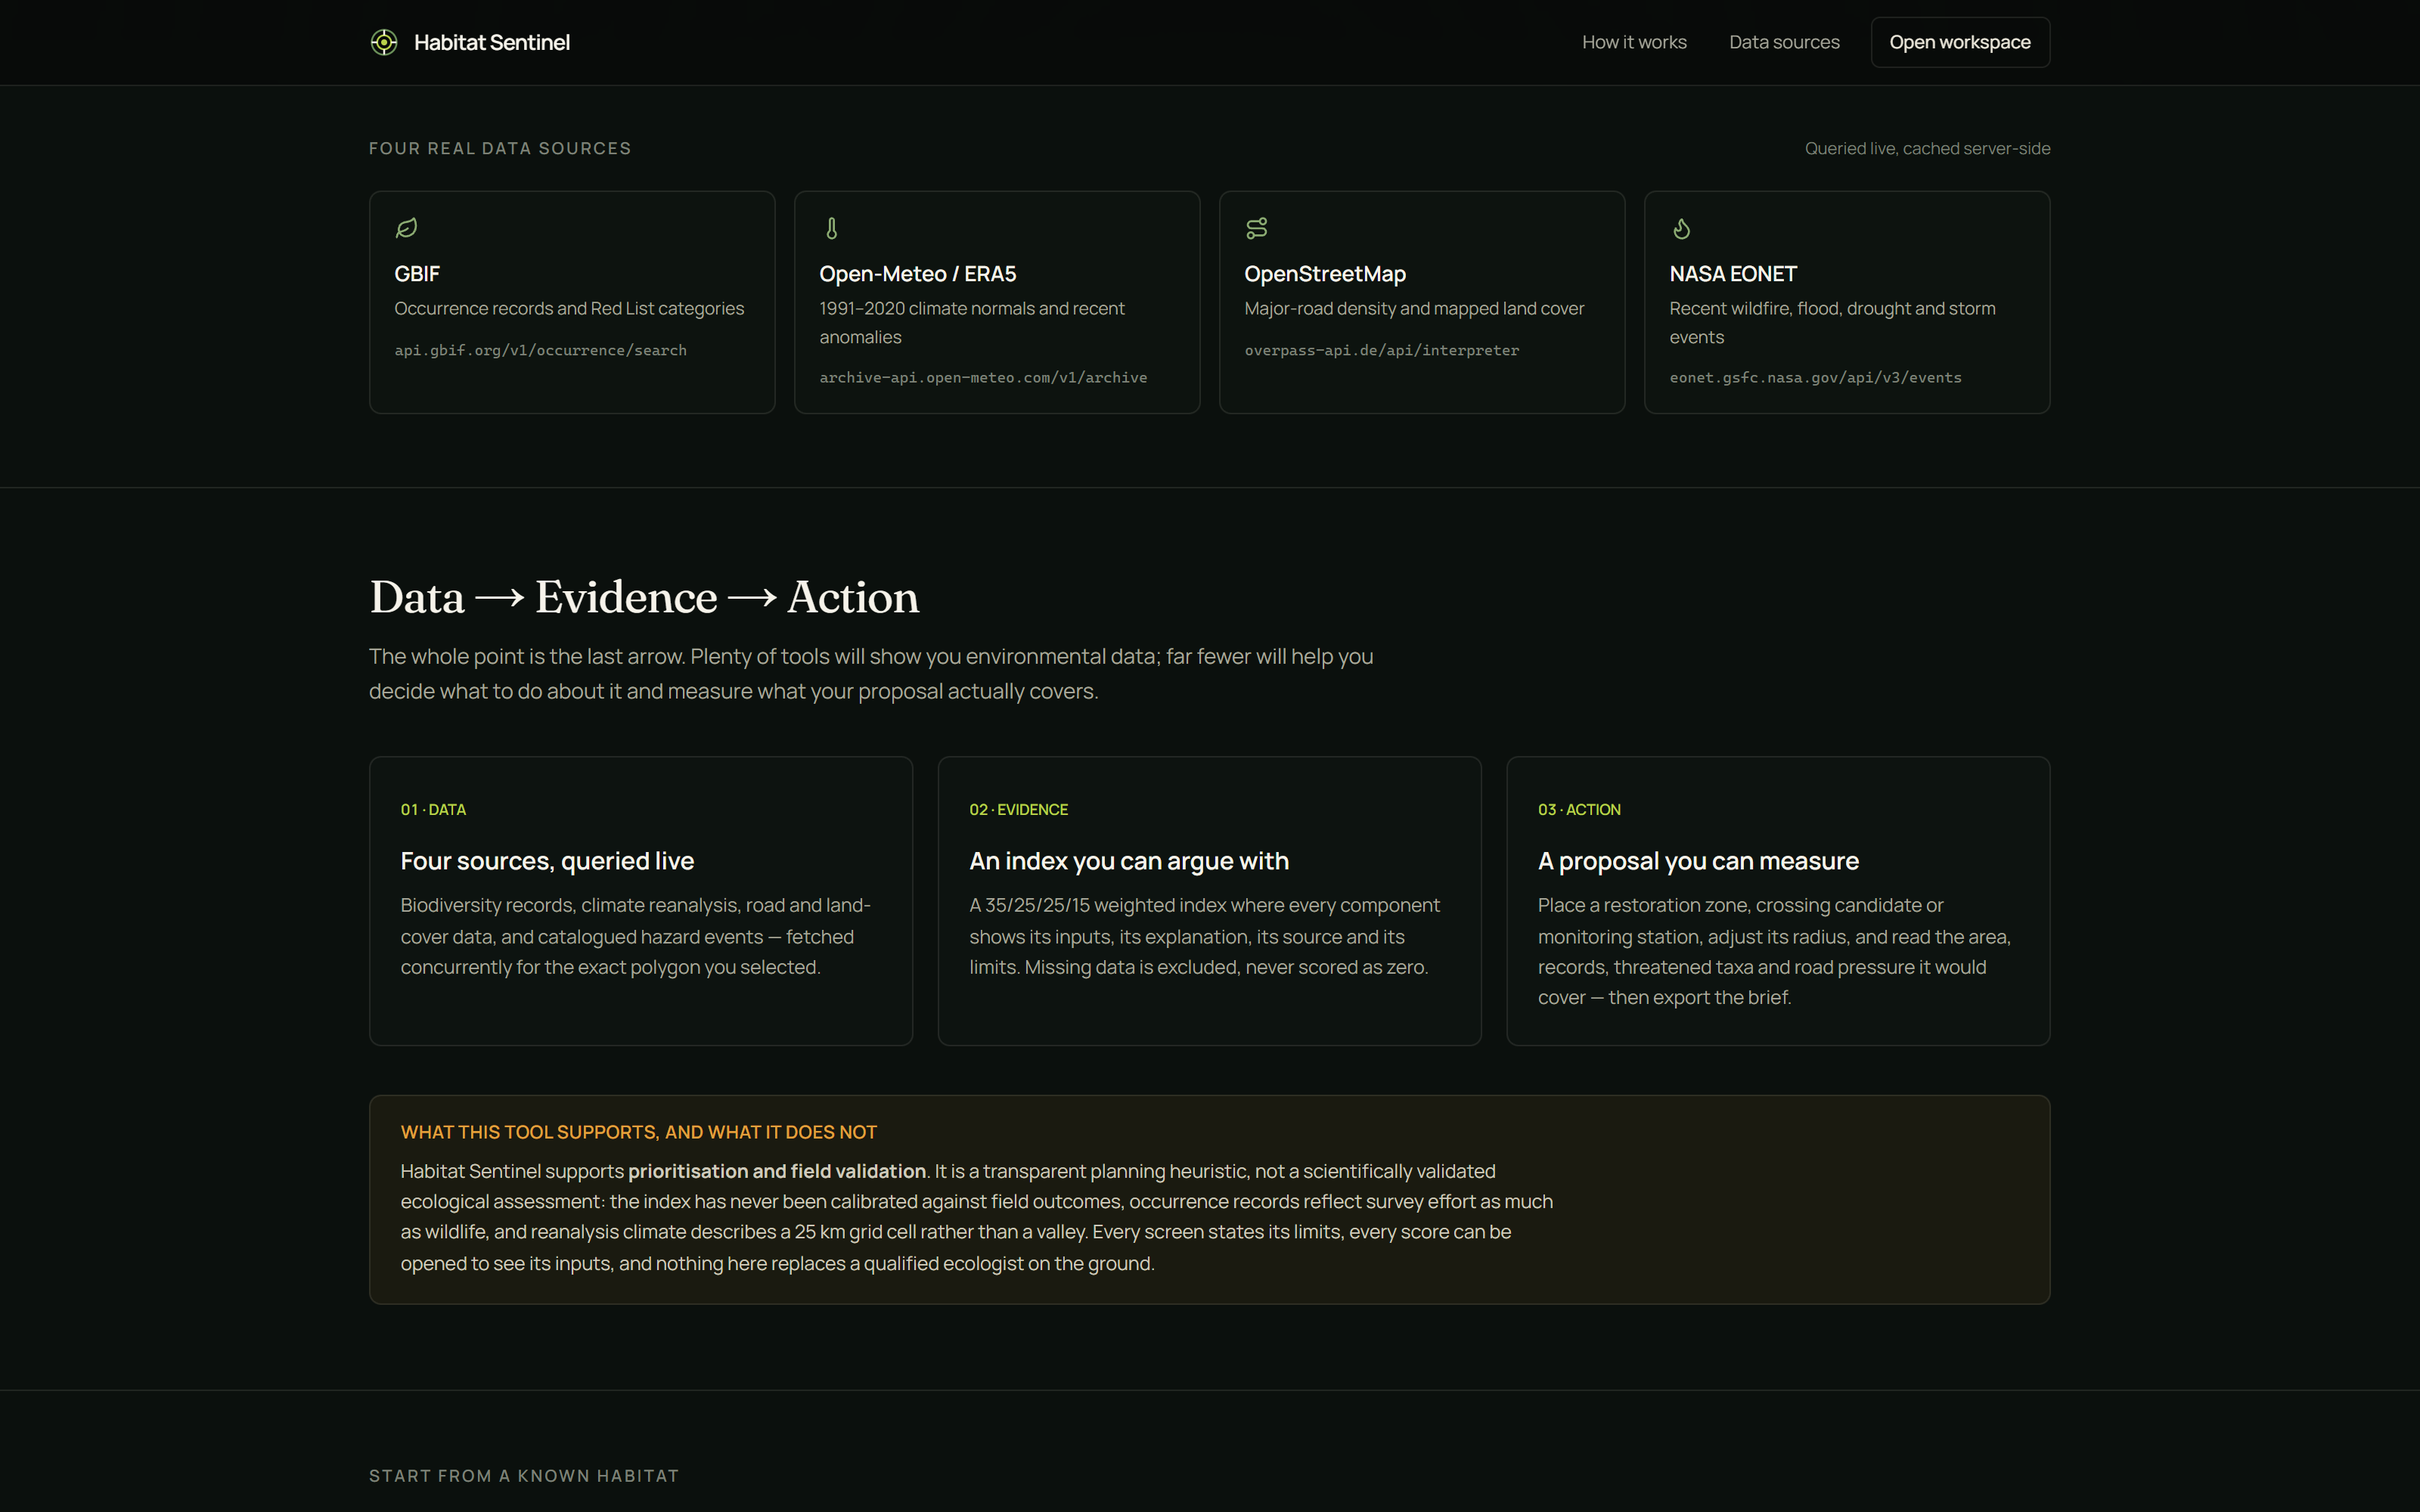
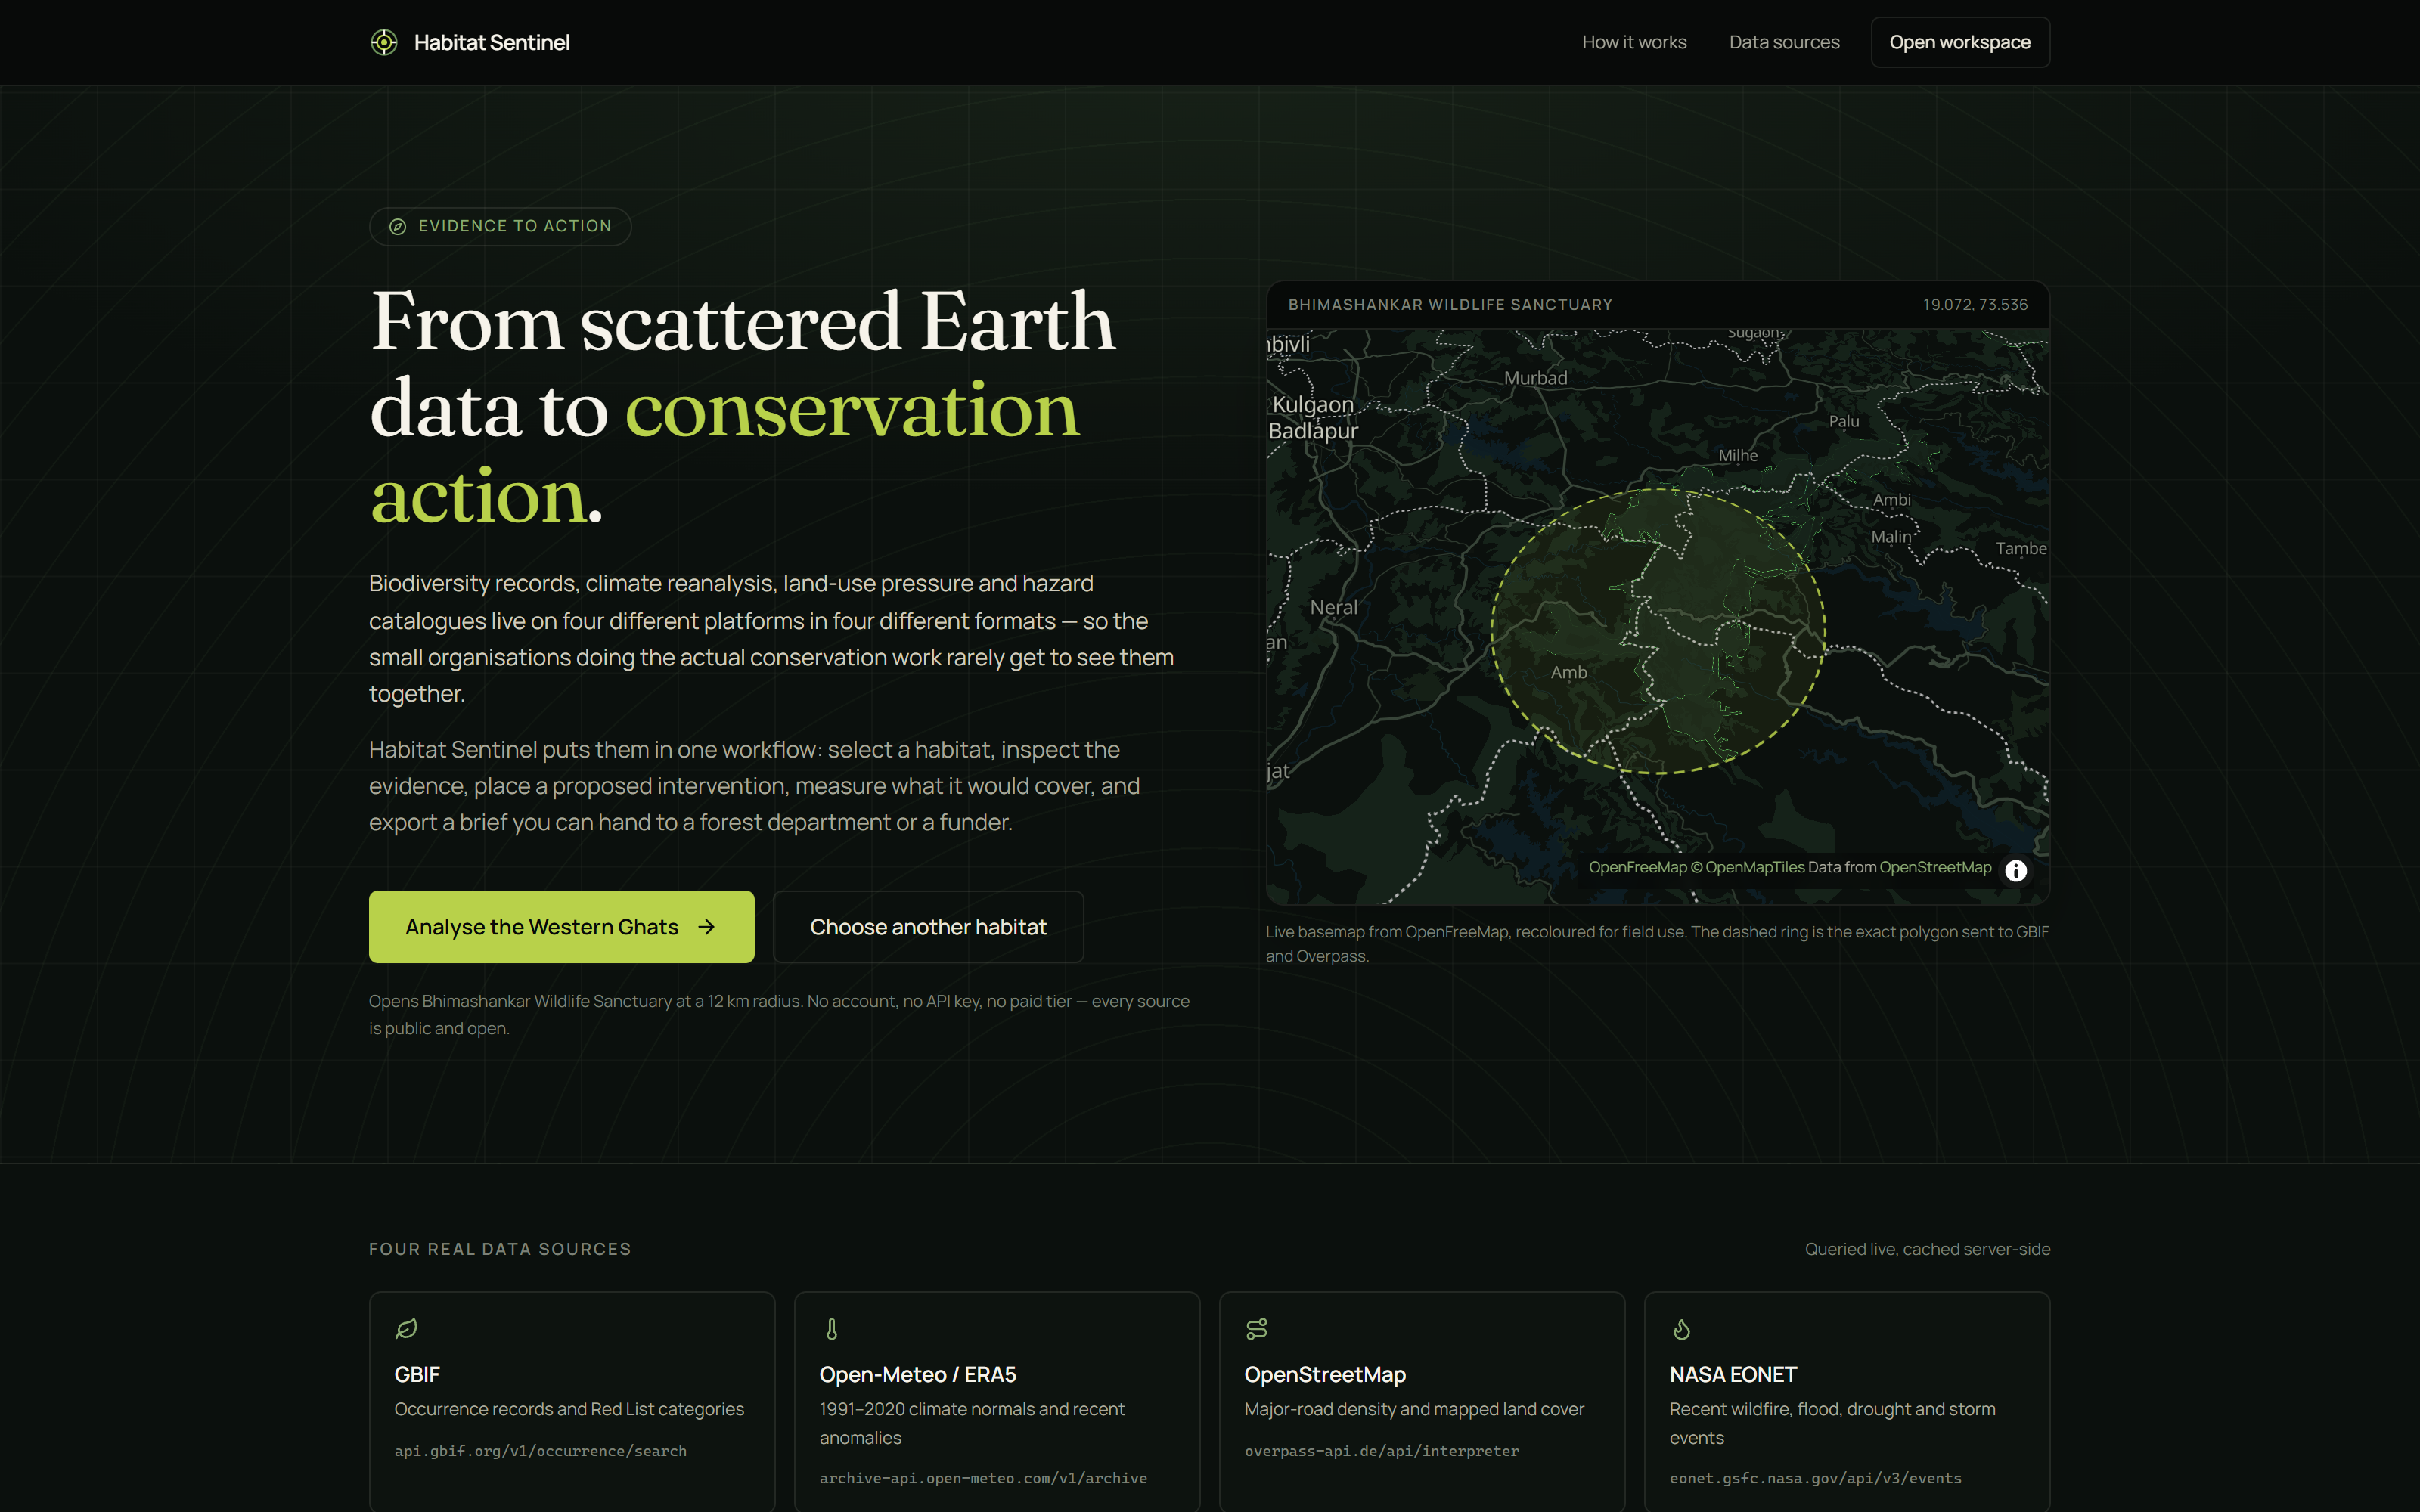
Environmental data has never been more open. GBIF holds over two billion species occurrence records. ERA5 offers eighty years of global climate reanalysis. OpenStreetMap maps most of the planet's roads. NASA publishes hazard events in near real time. All of it is free.
Almost none of it reaches the people doing the actual conservation work.
That data sits on four platforms, in four formats, behind four query languages — WKT polygons here, ISO date ranges there, a bespoke query DSL over there. A large NGO can afford a GIS team to join them up. A forest department field office, a district conservation club, a three-person restoration nonprofit cannot. The people closest to the habitat are the ones least able to see the evidence about it.
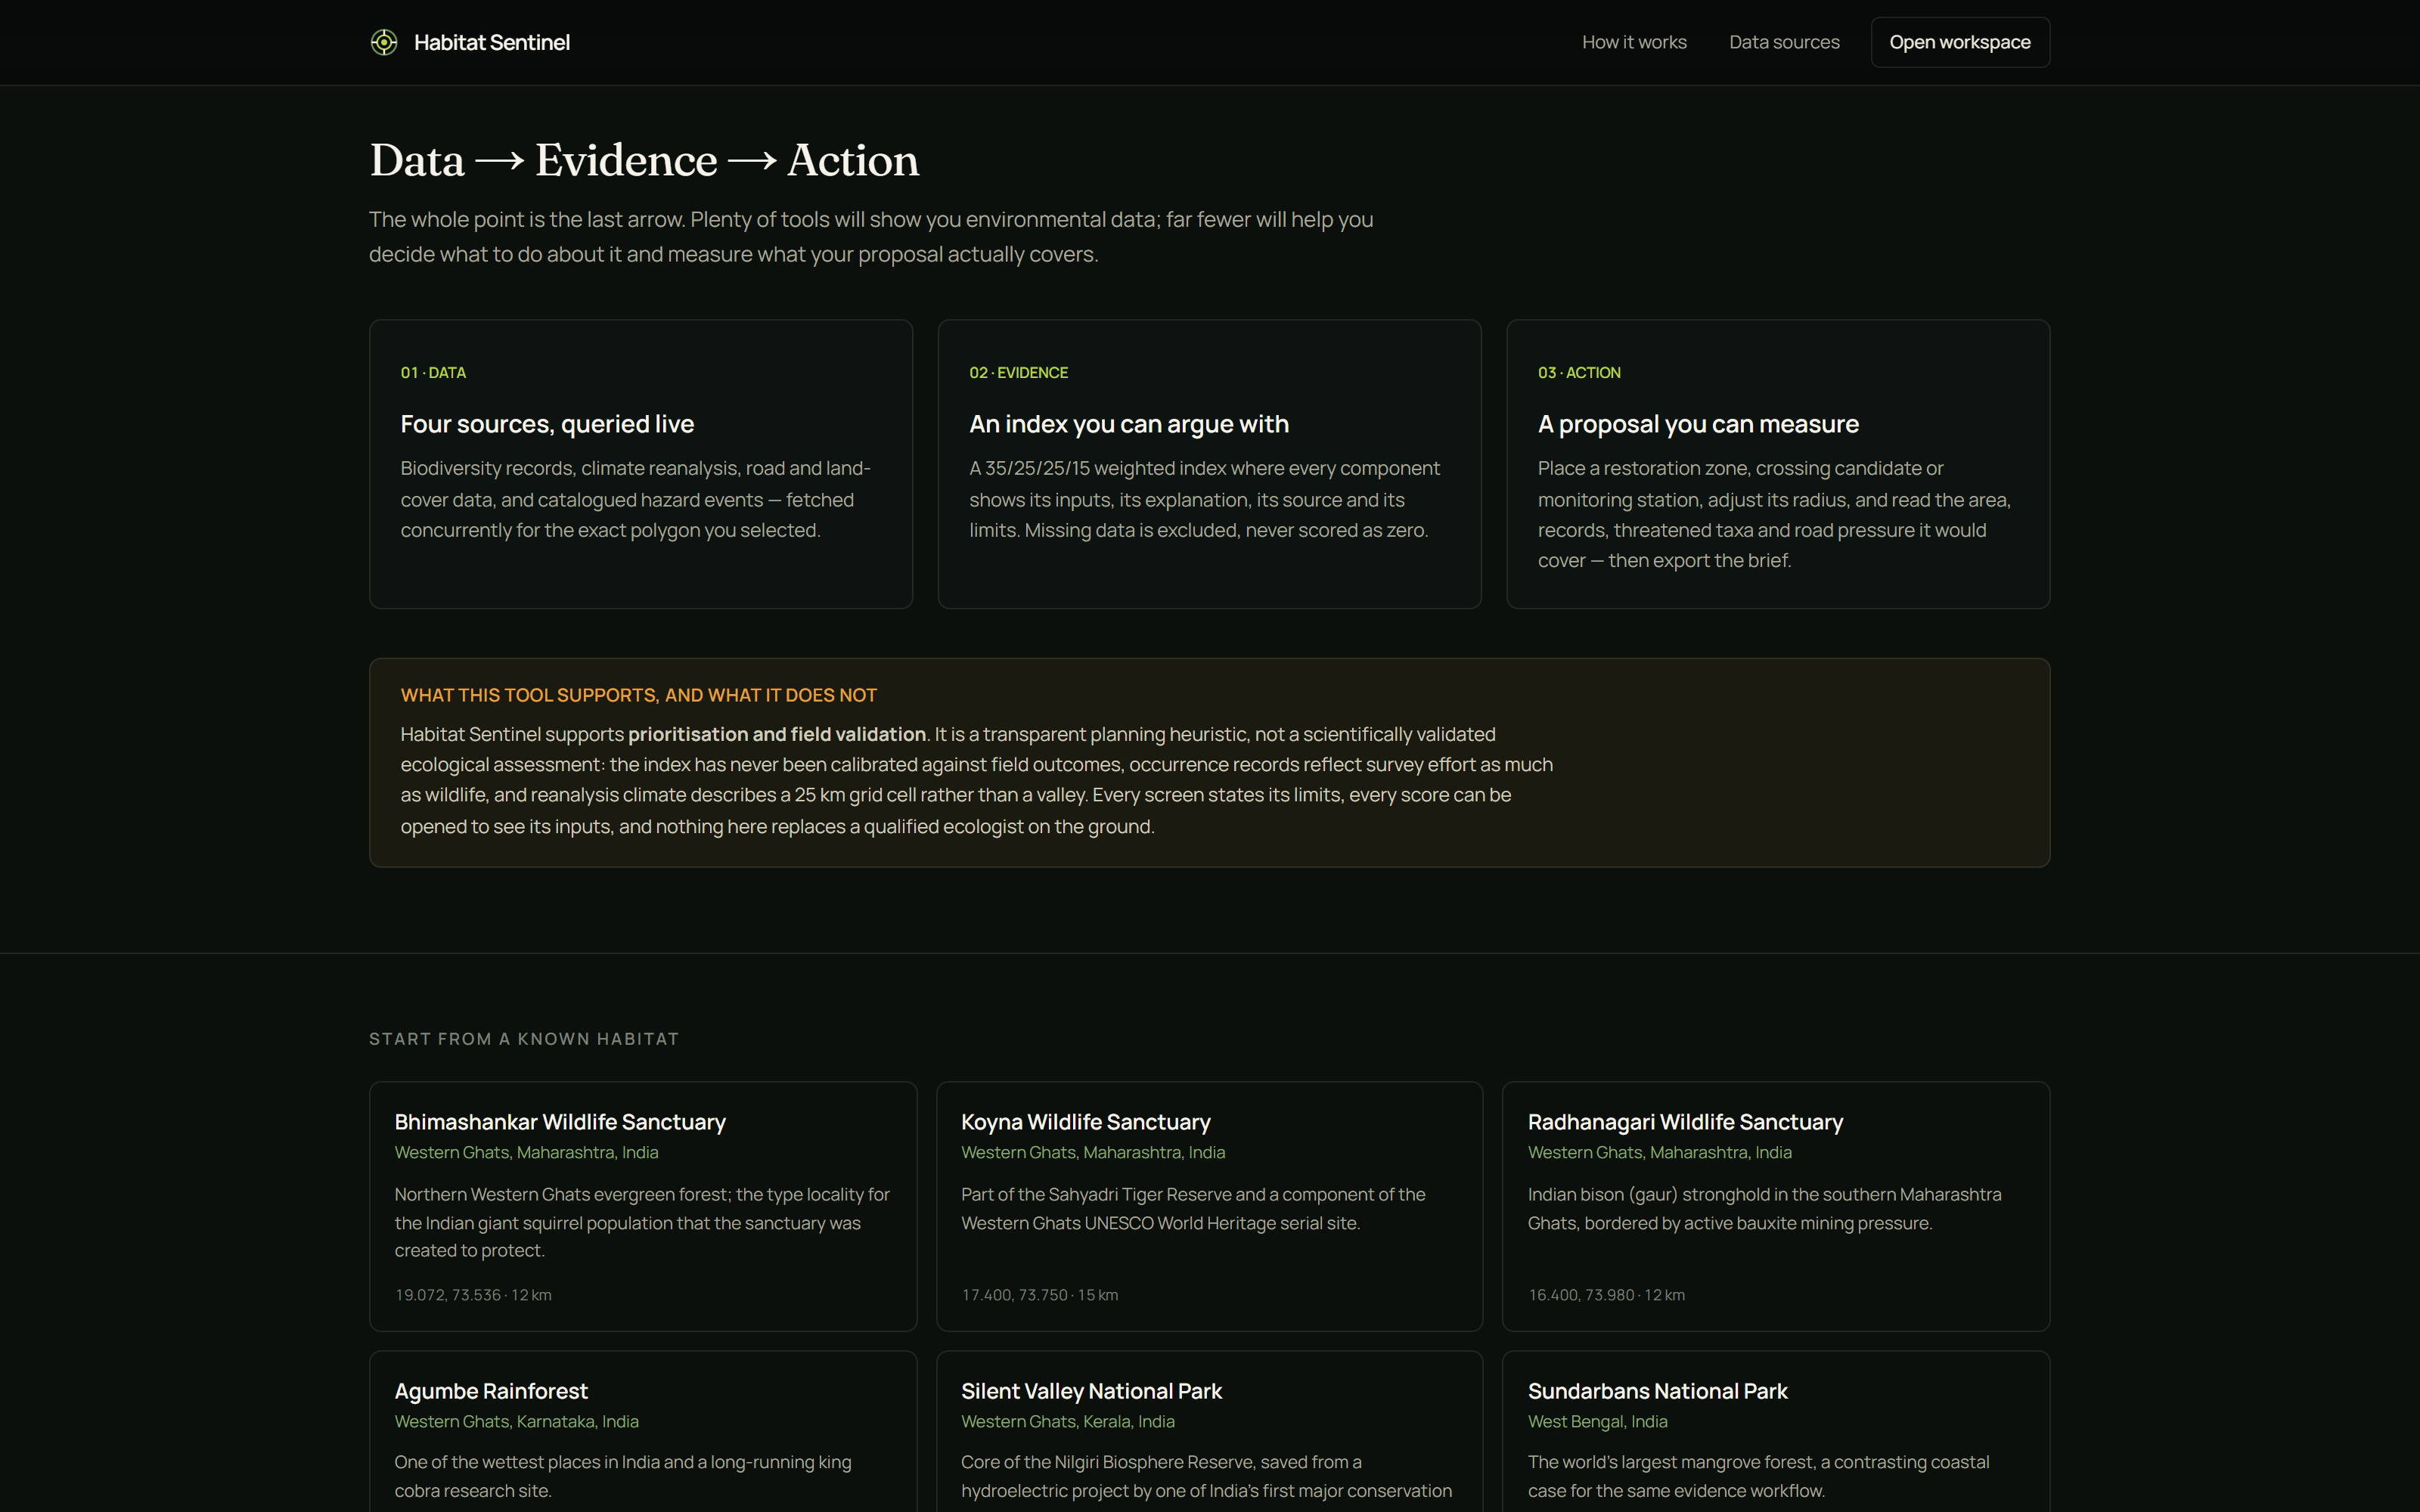
We kept returning to a specific gap. Plenty of tools will show you environmental data. Very few help you decide what to do about it — and fewer still let you measure what your proposed action would actually cover. The distance between a dashboard and a fundable plan is enormous, and nobody was building the bridge.
So we built the bridge: Data → Evidence → Action.
What it does
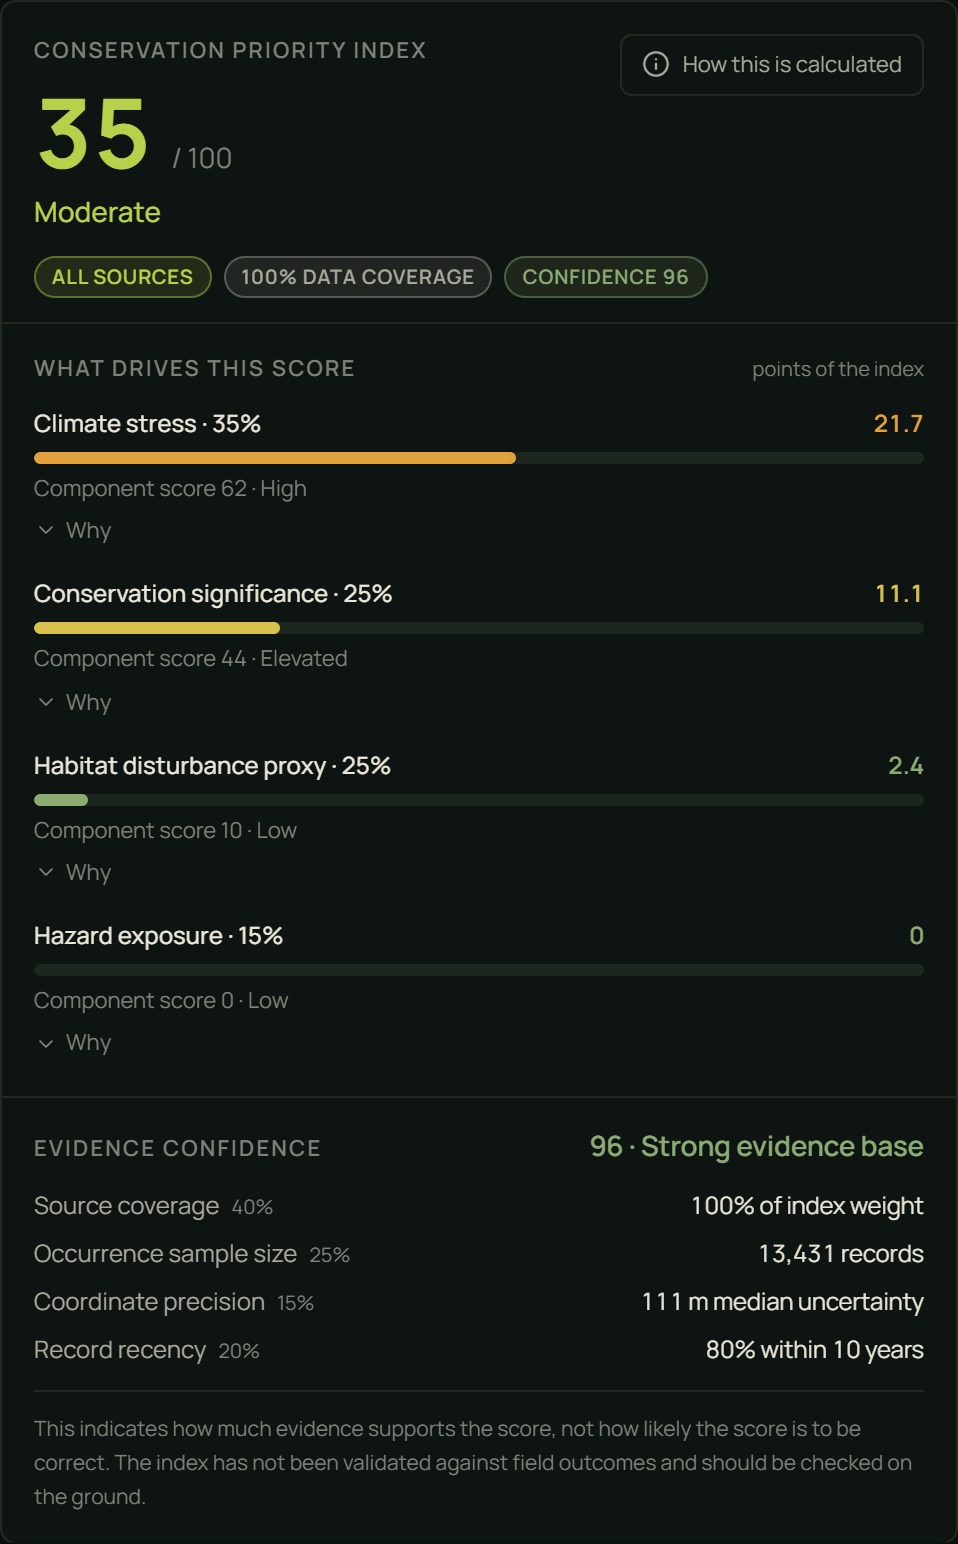
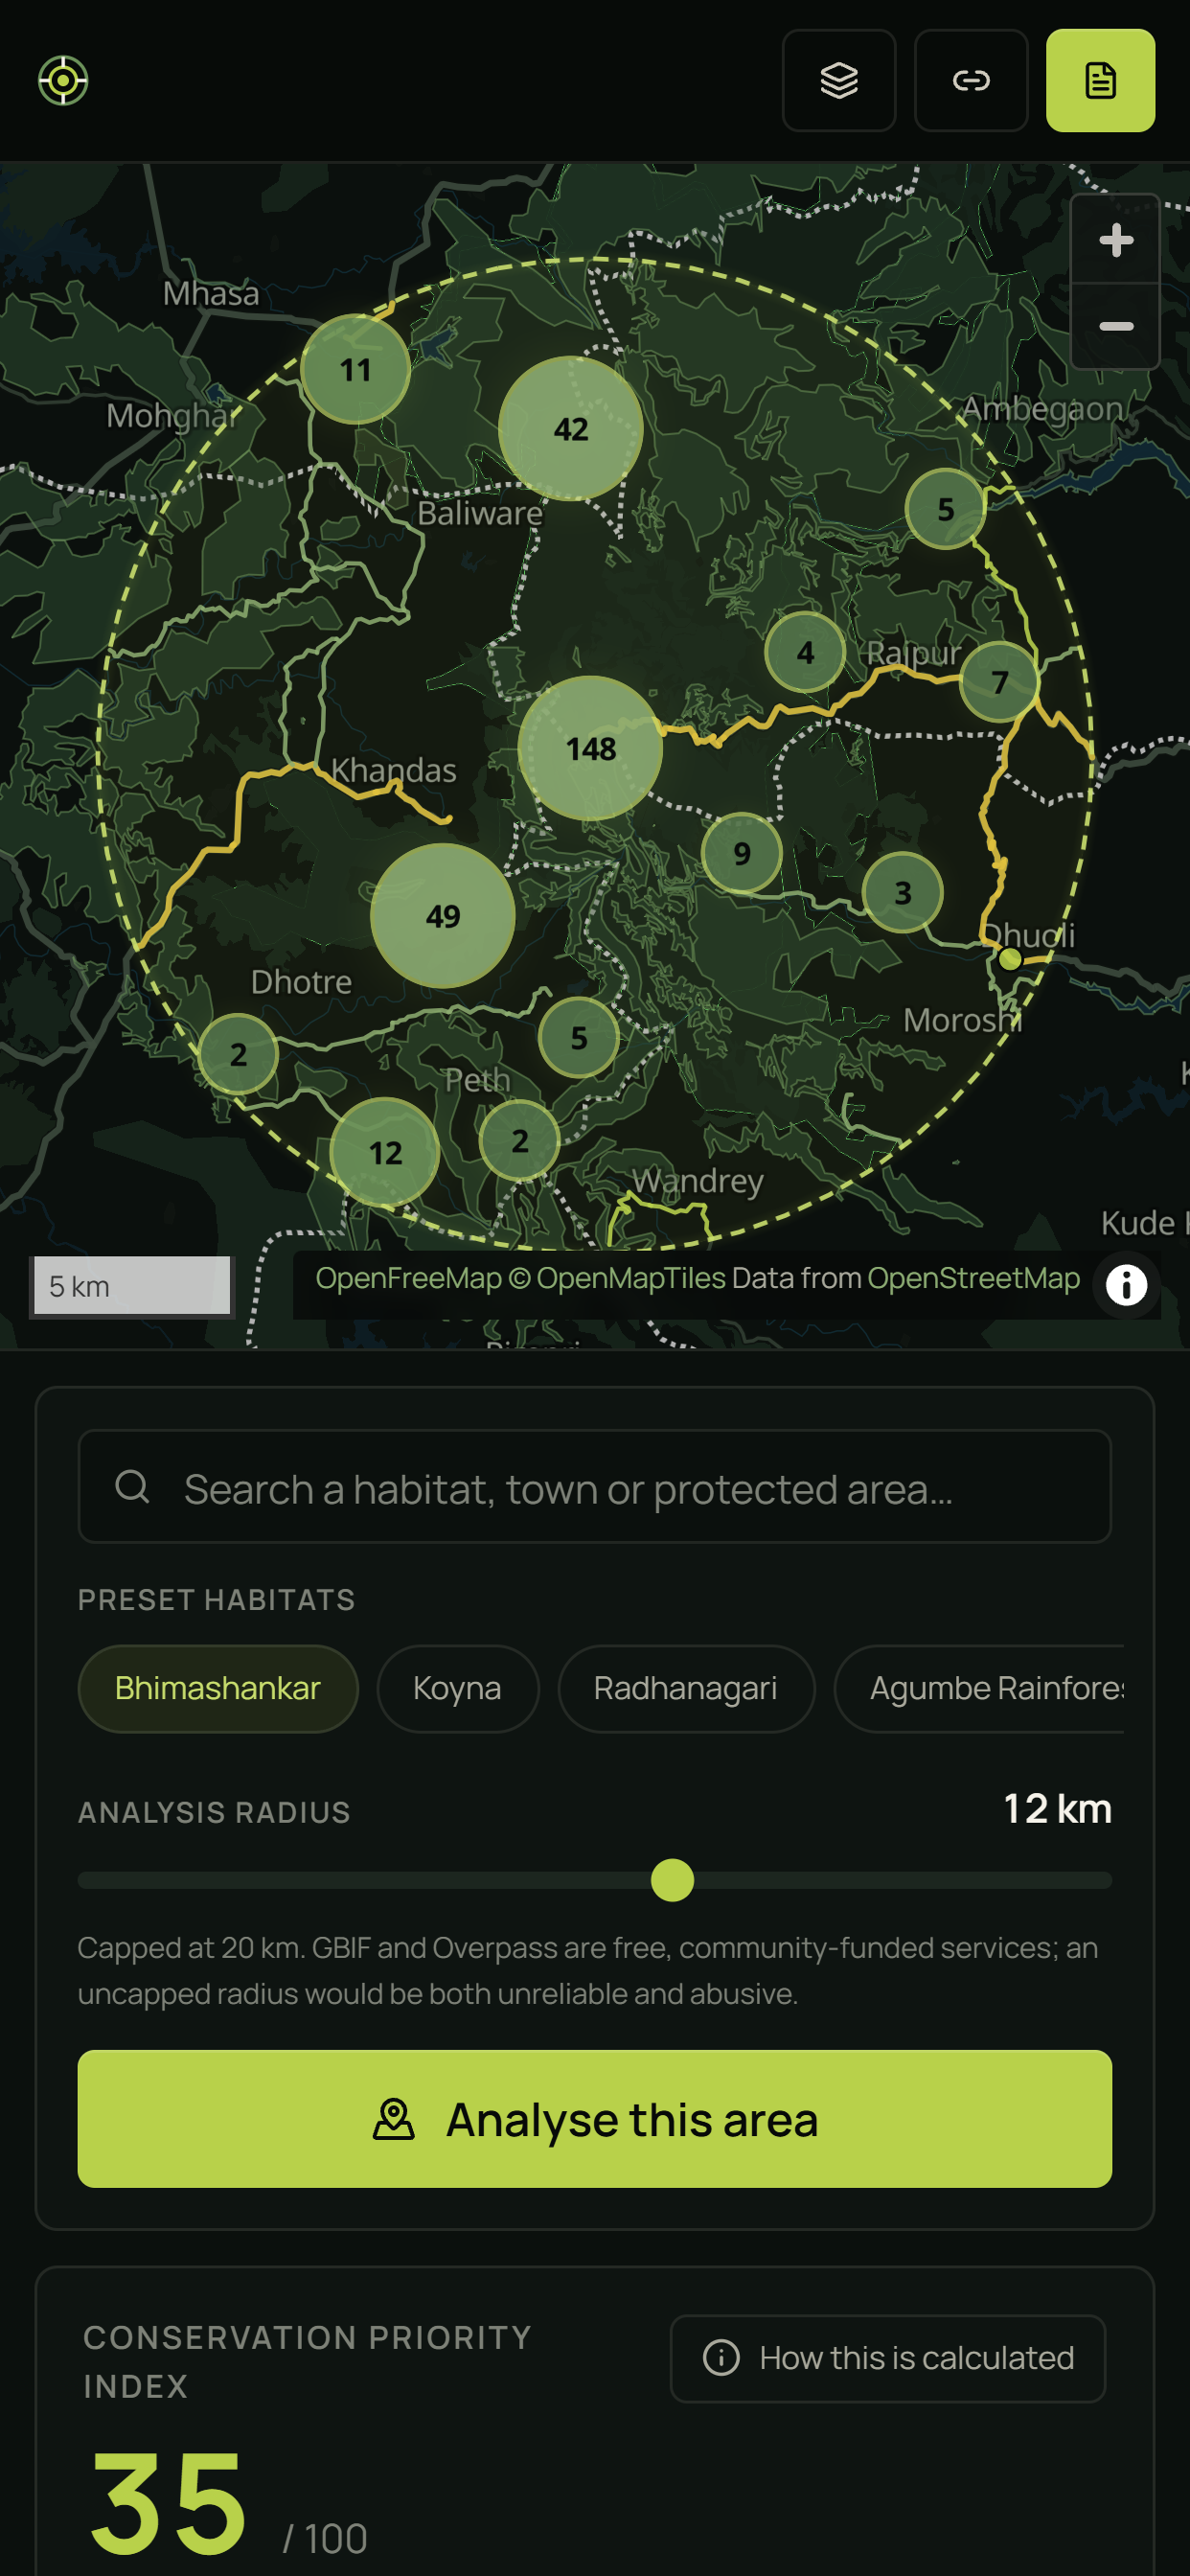
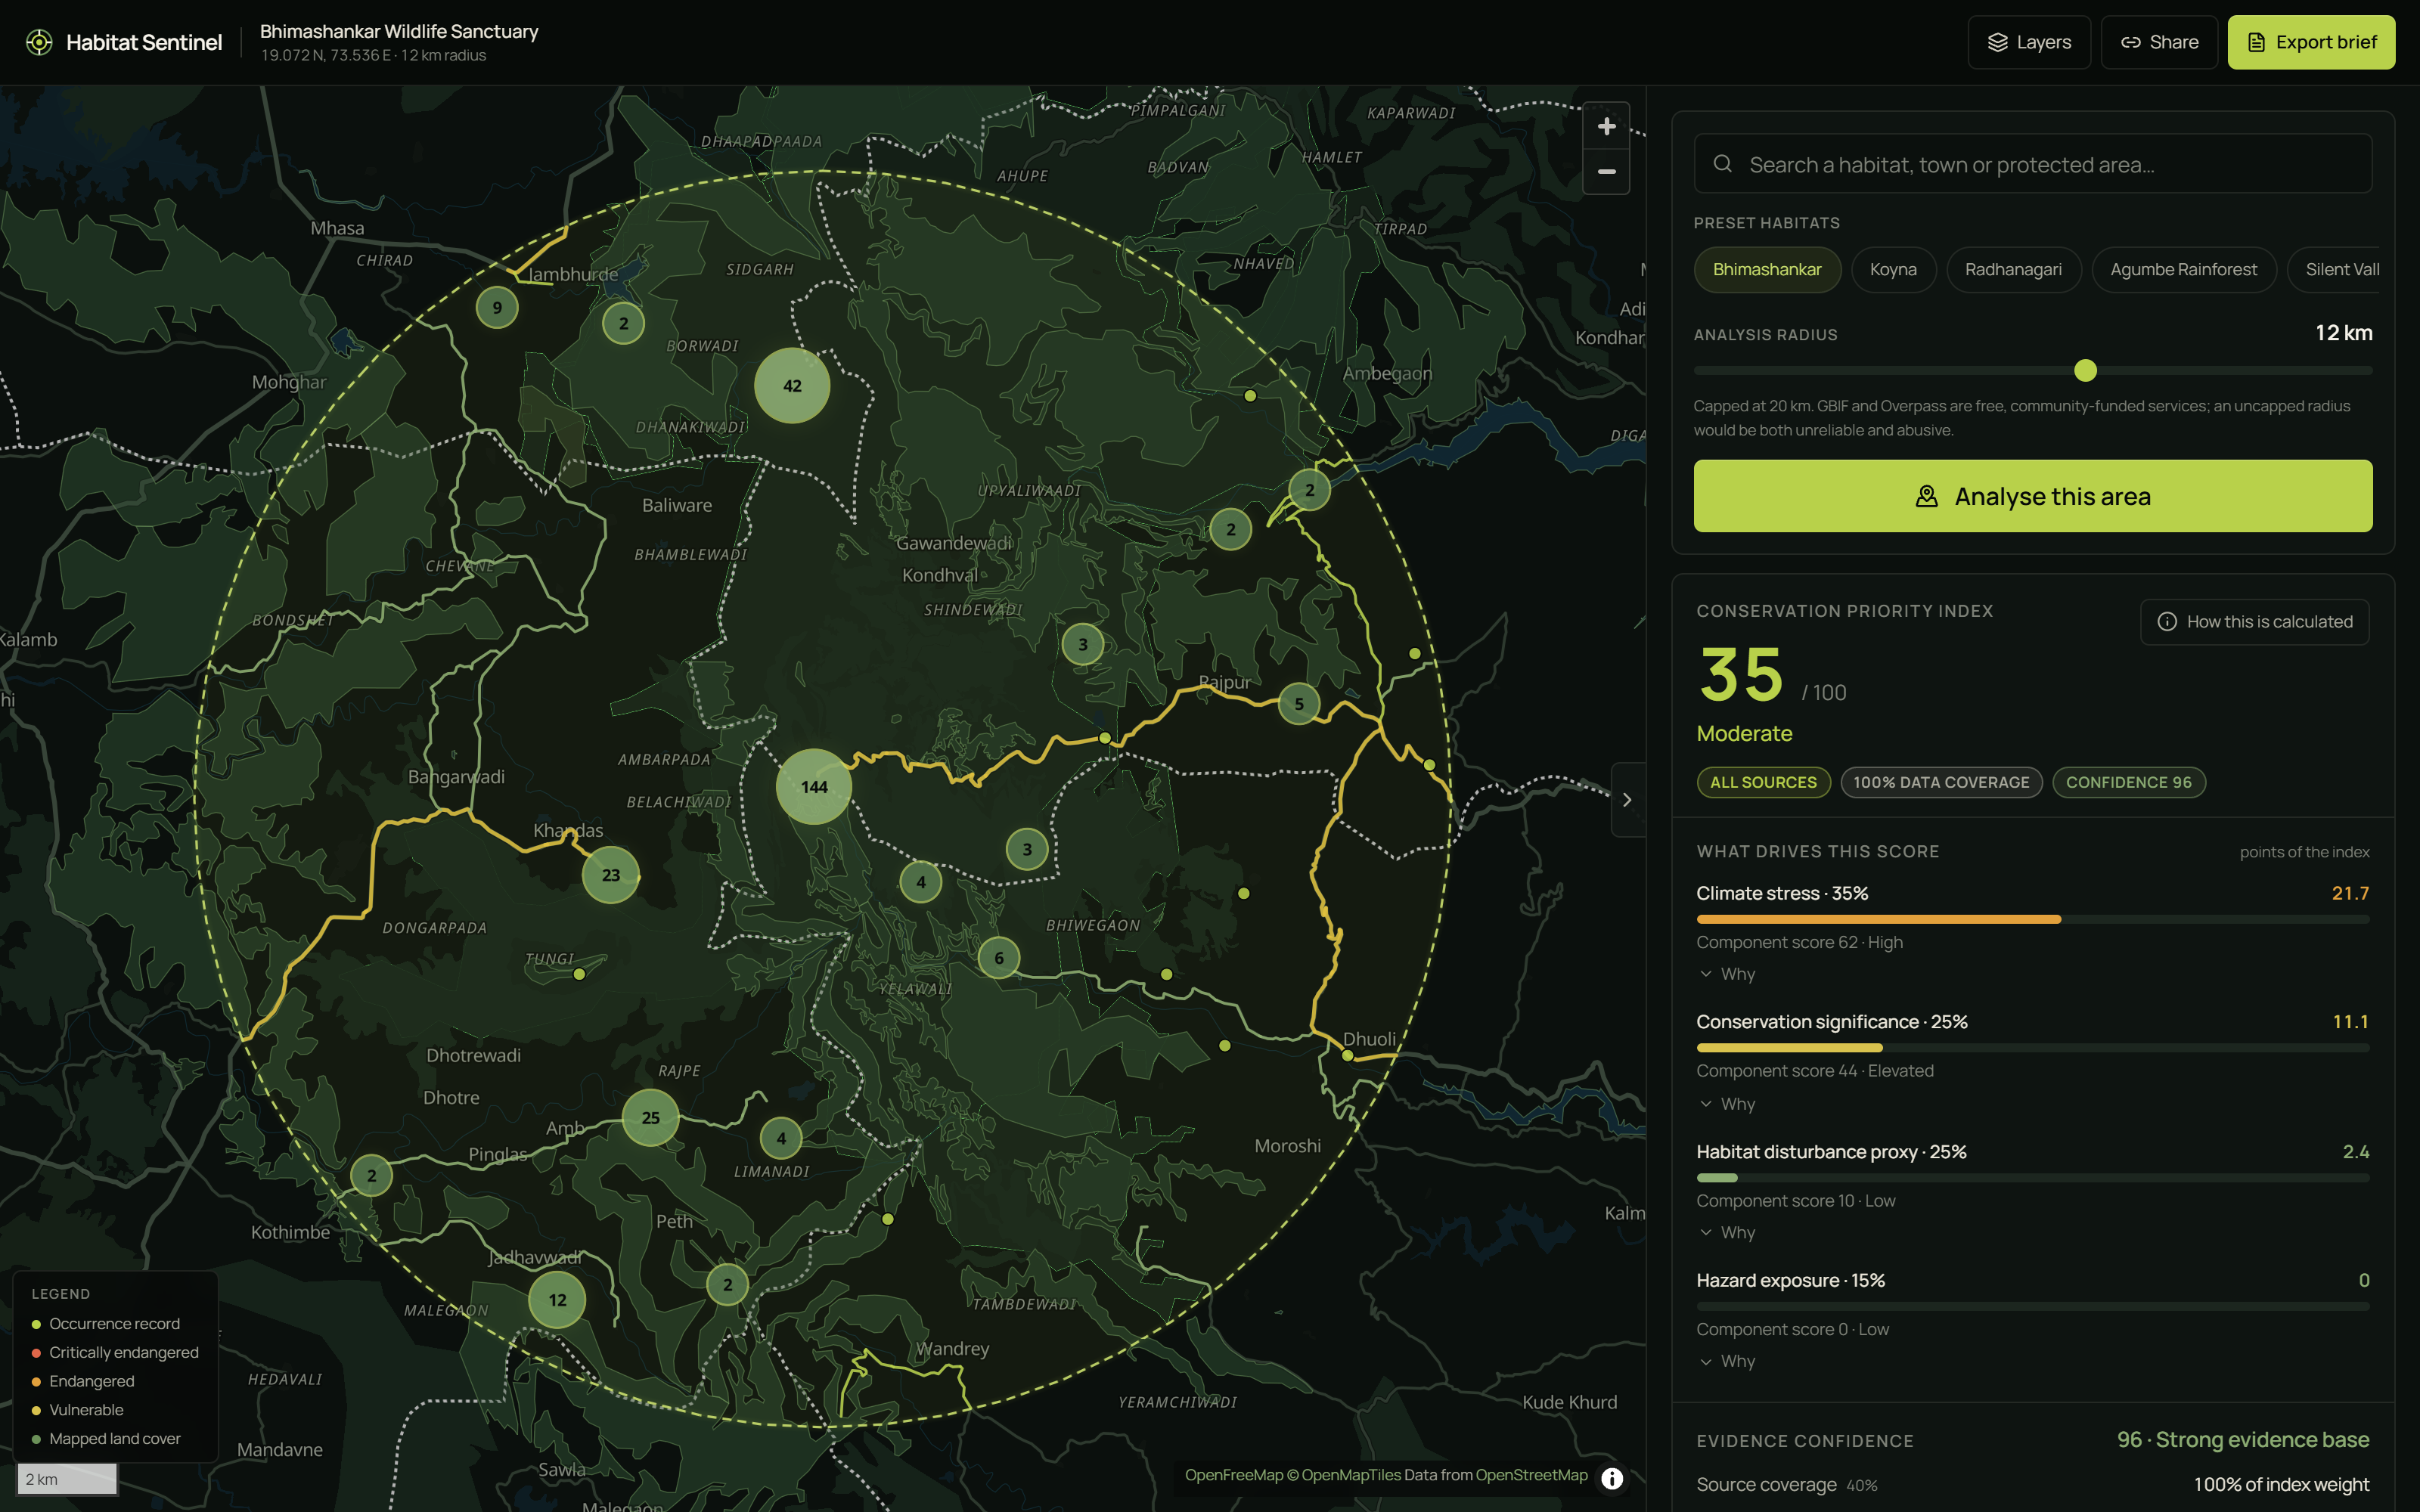
You select a habitat. Habitat Sentinel queries four live sources concurrently for your exact polygon and returns an explainable Conservation Priority Index:
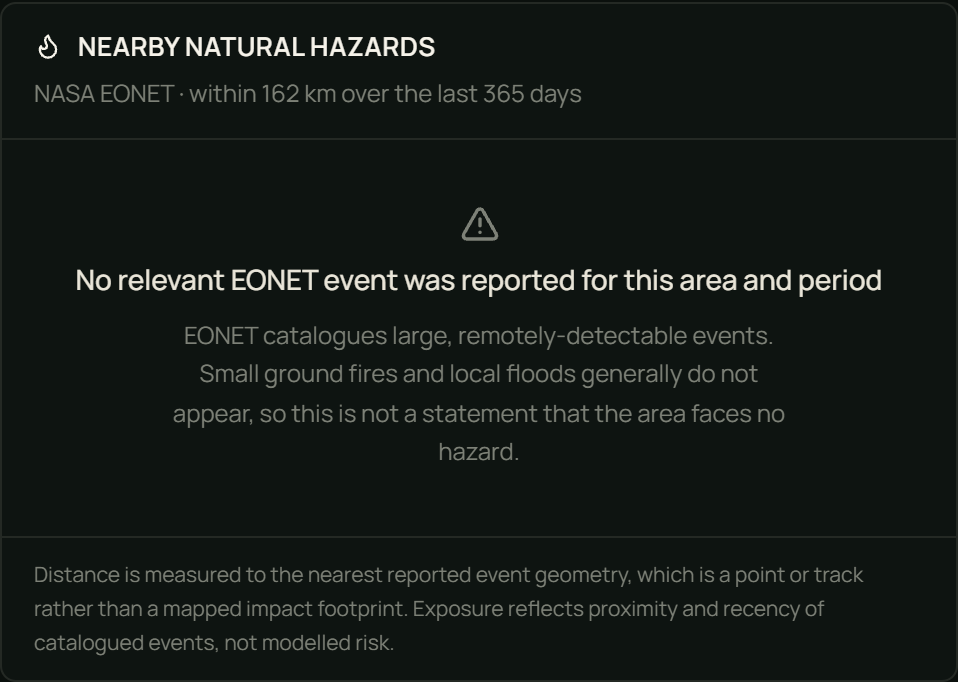
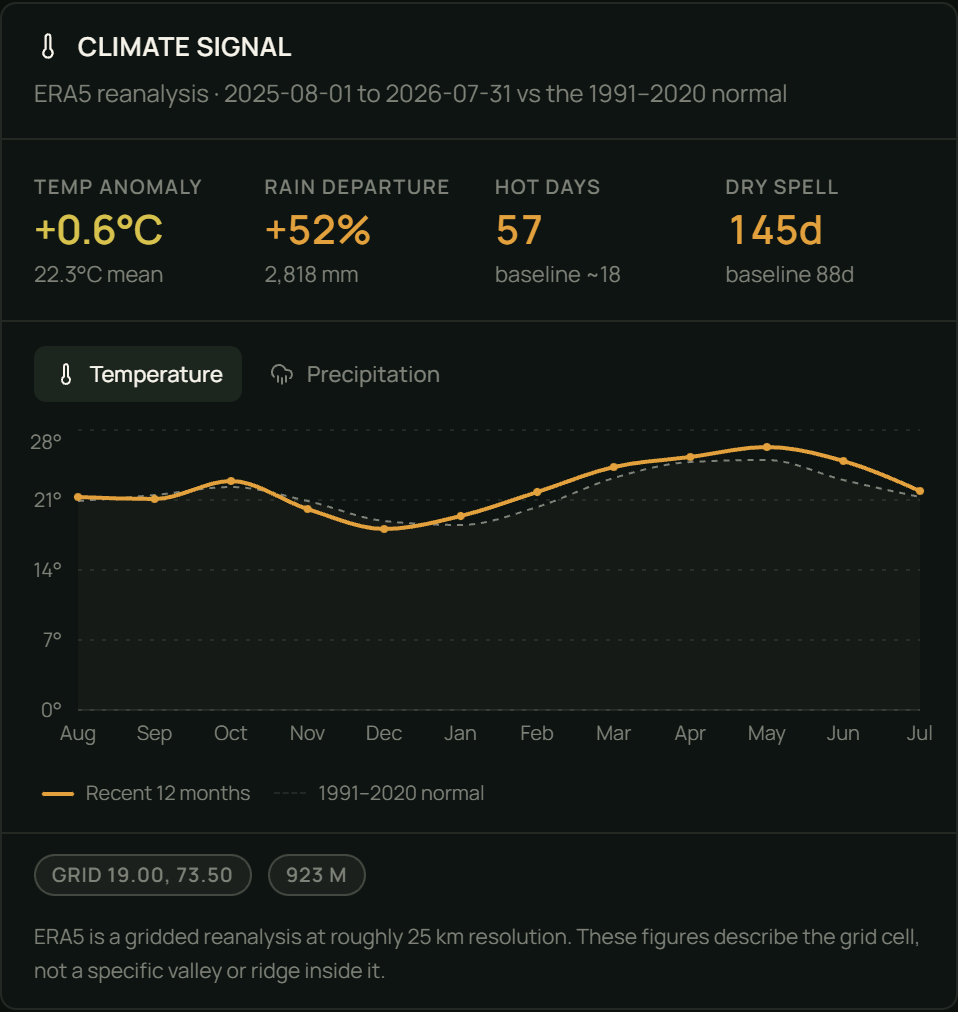
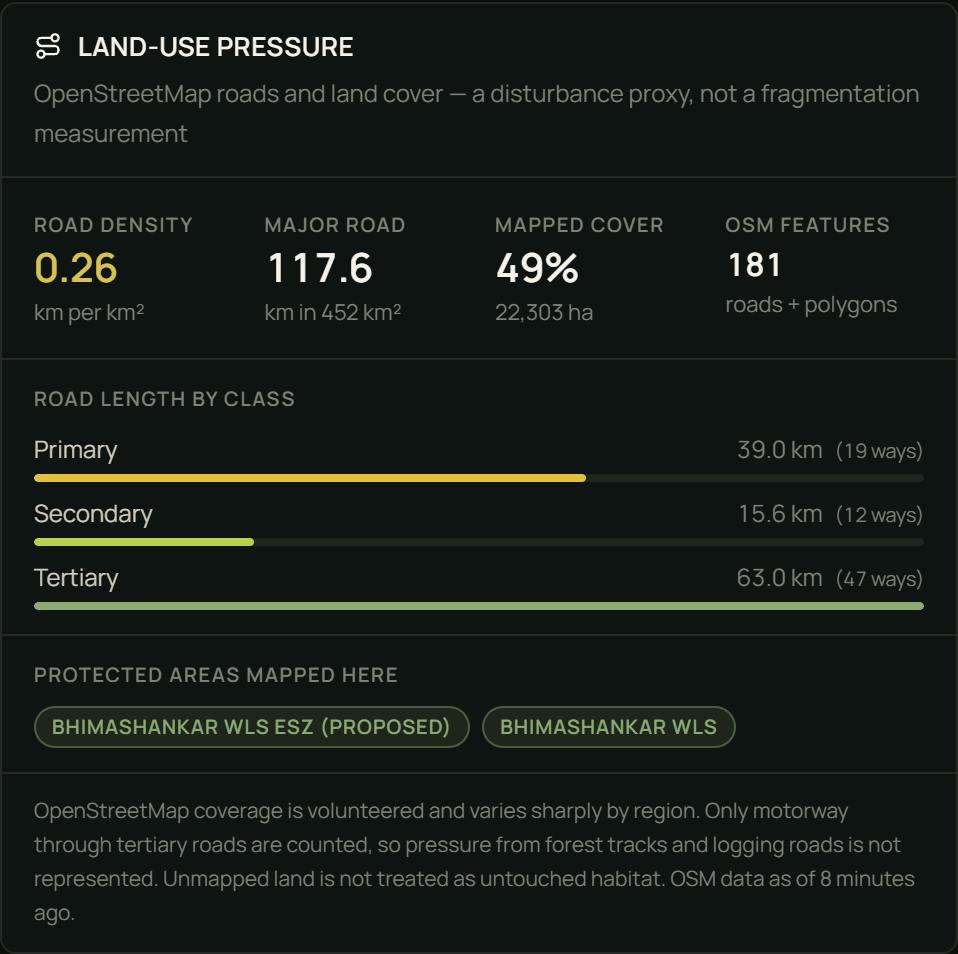
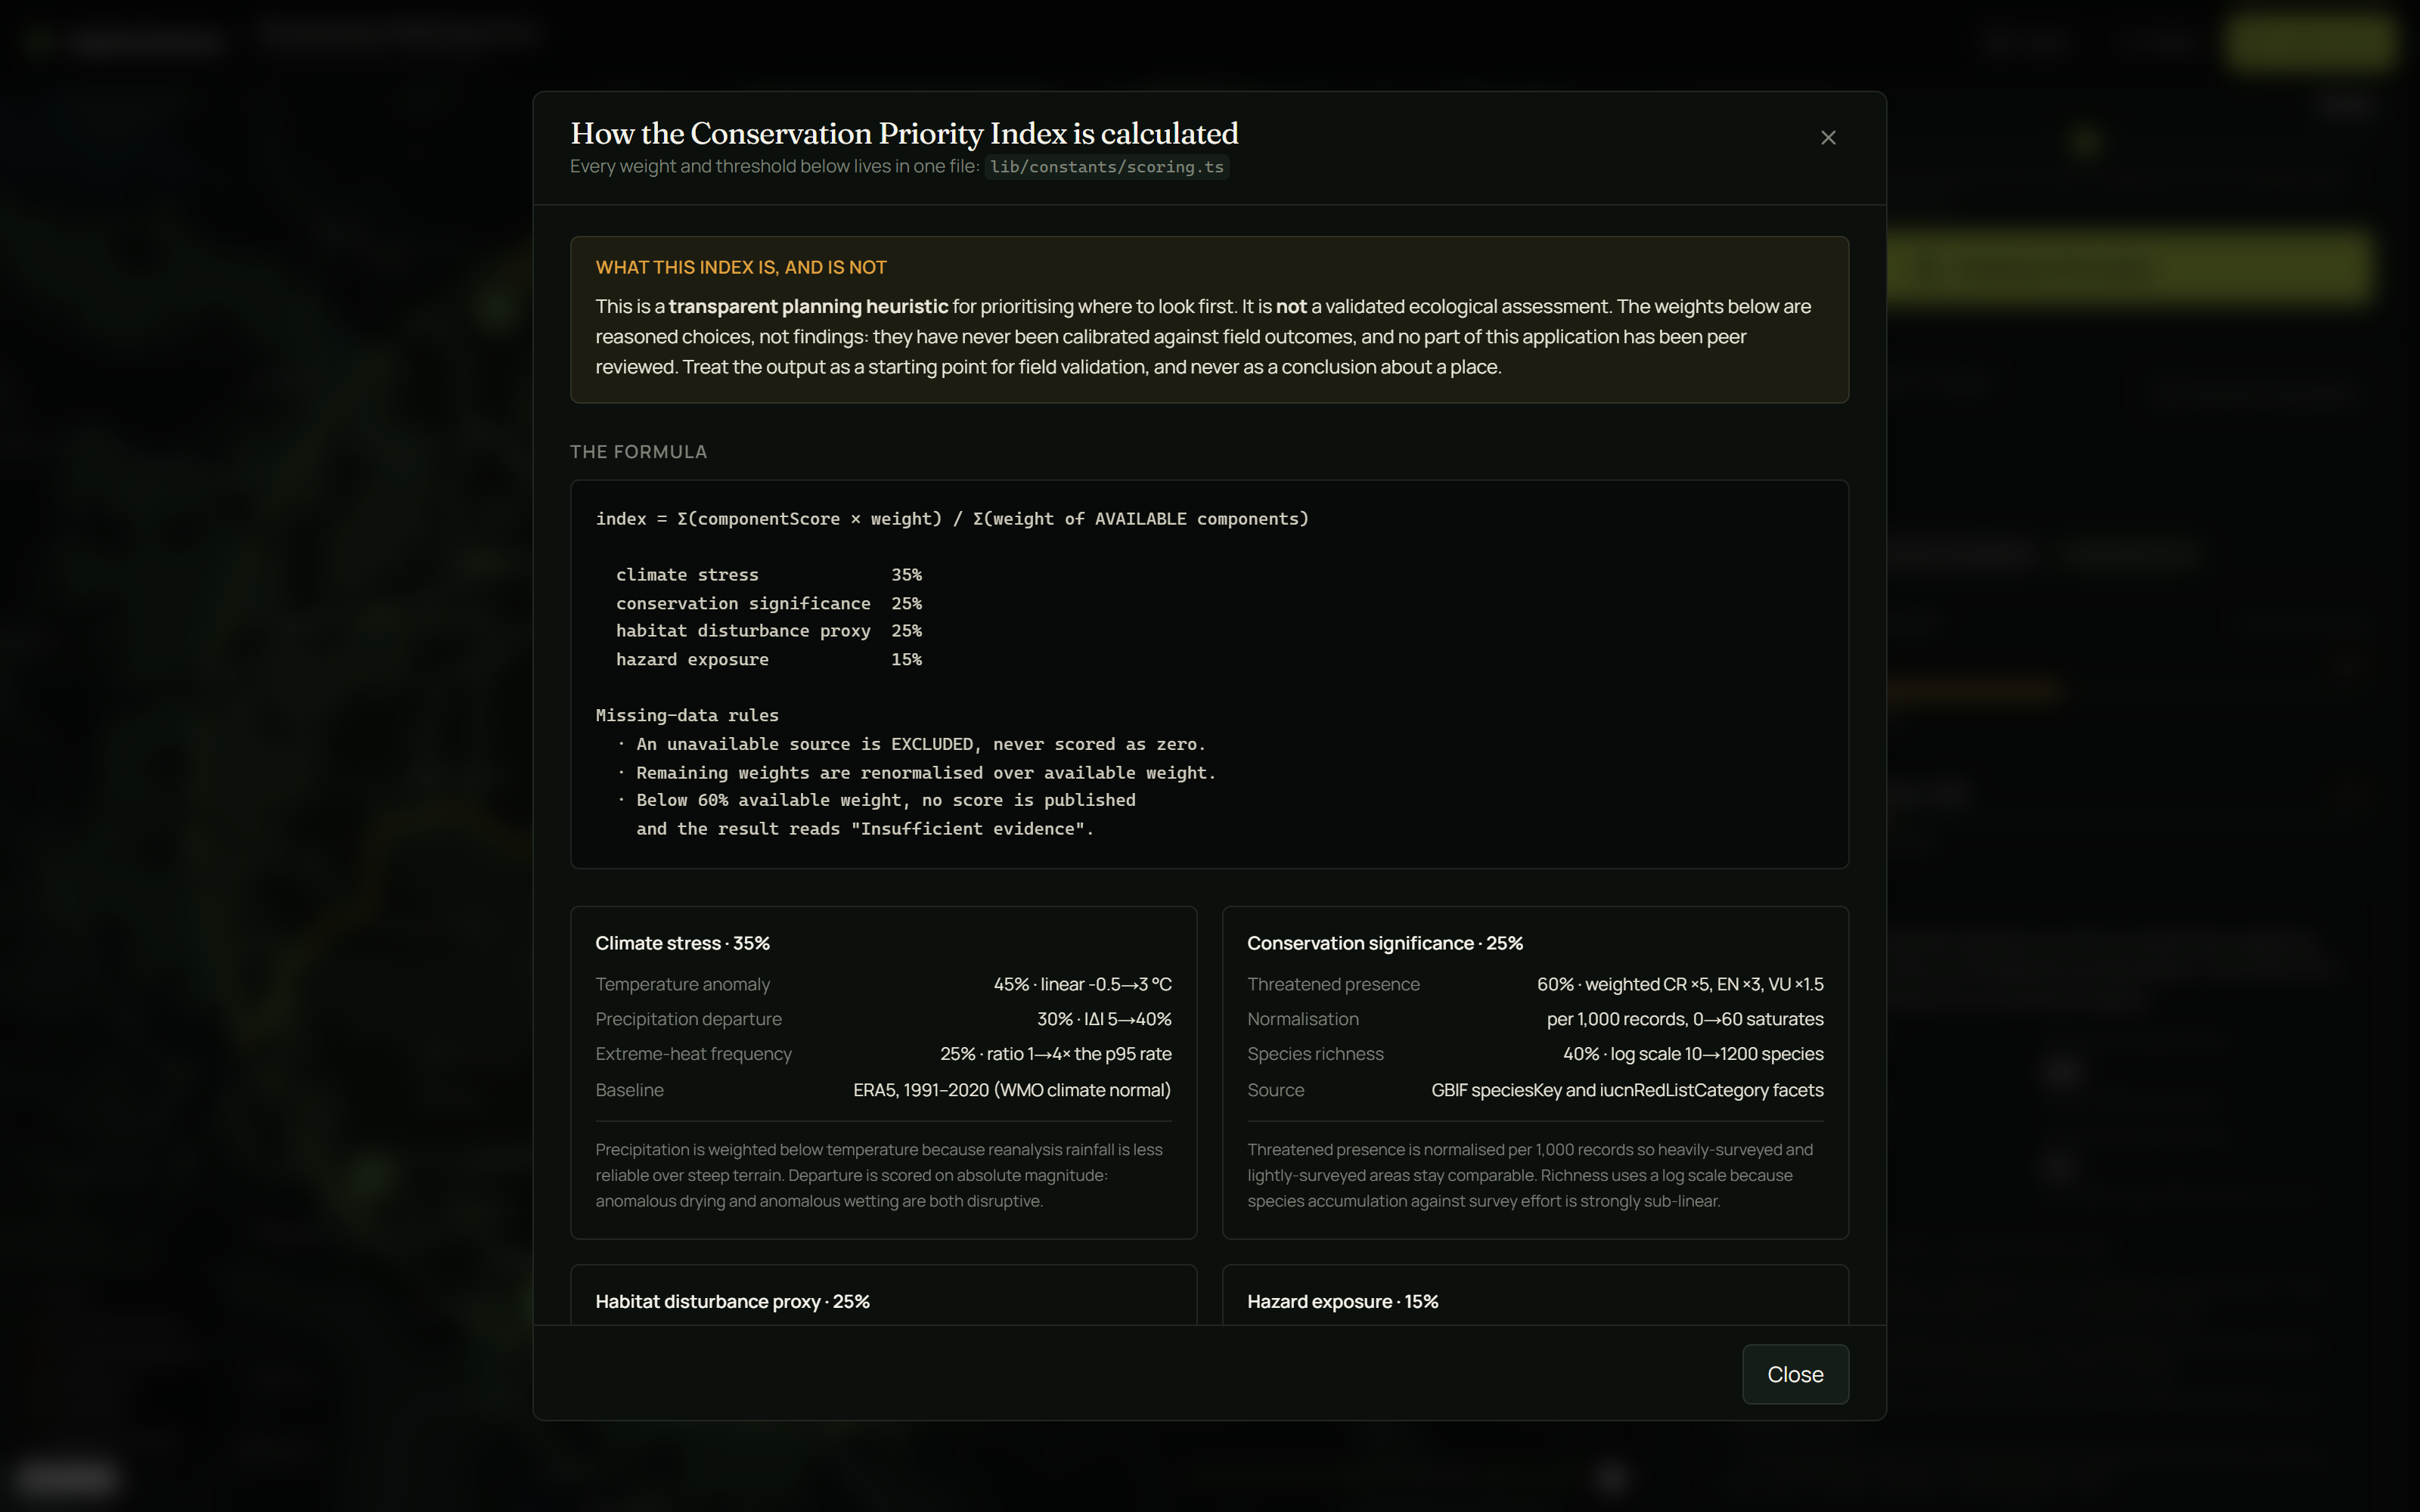
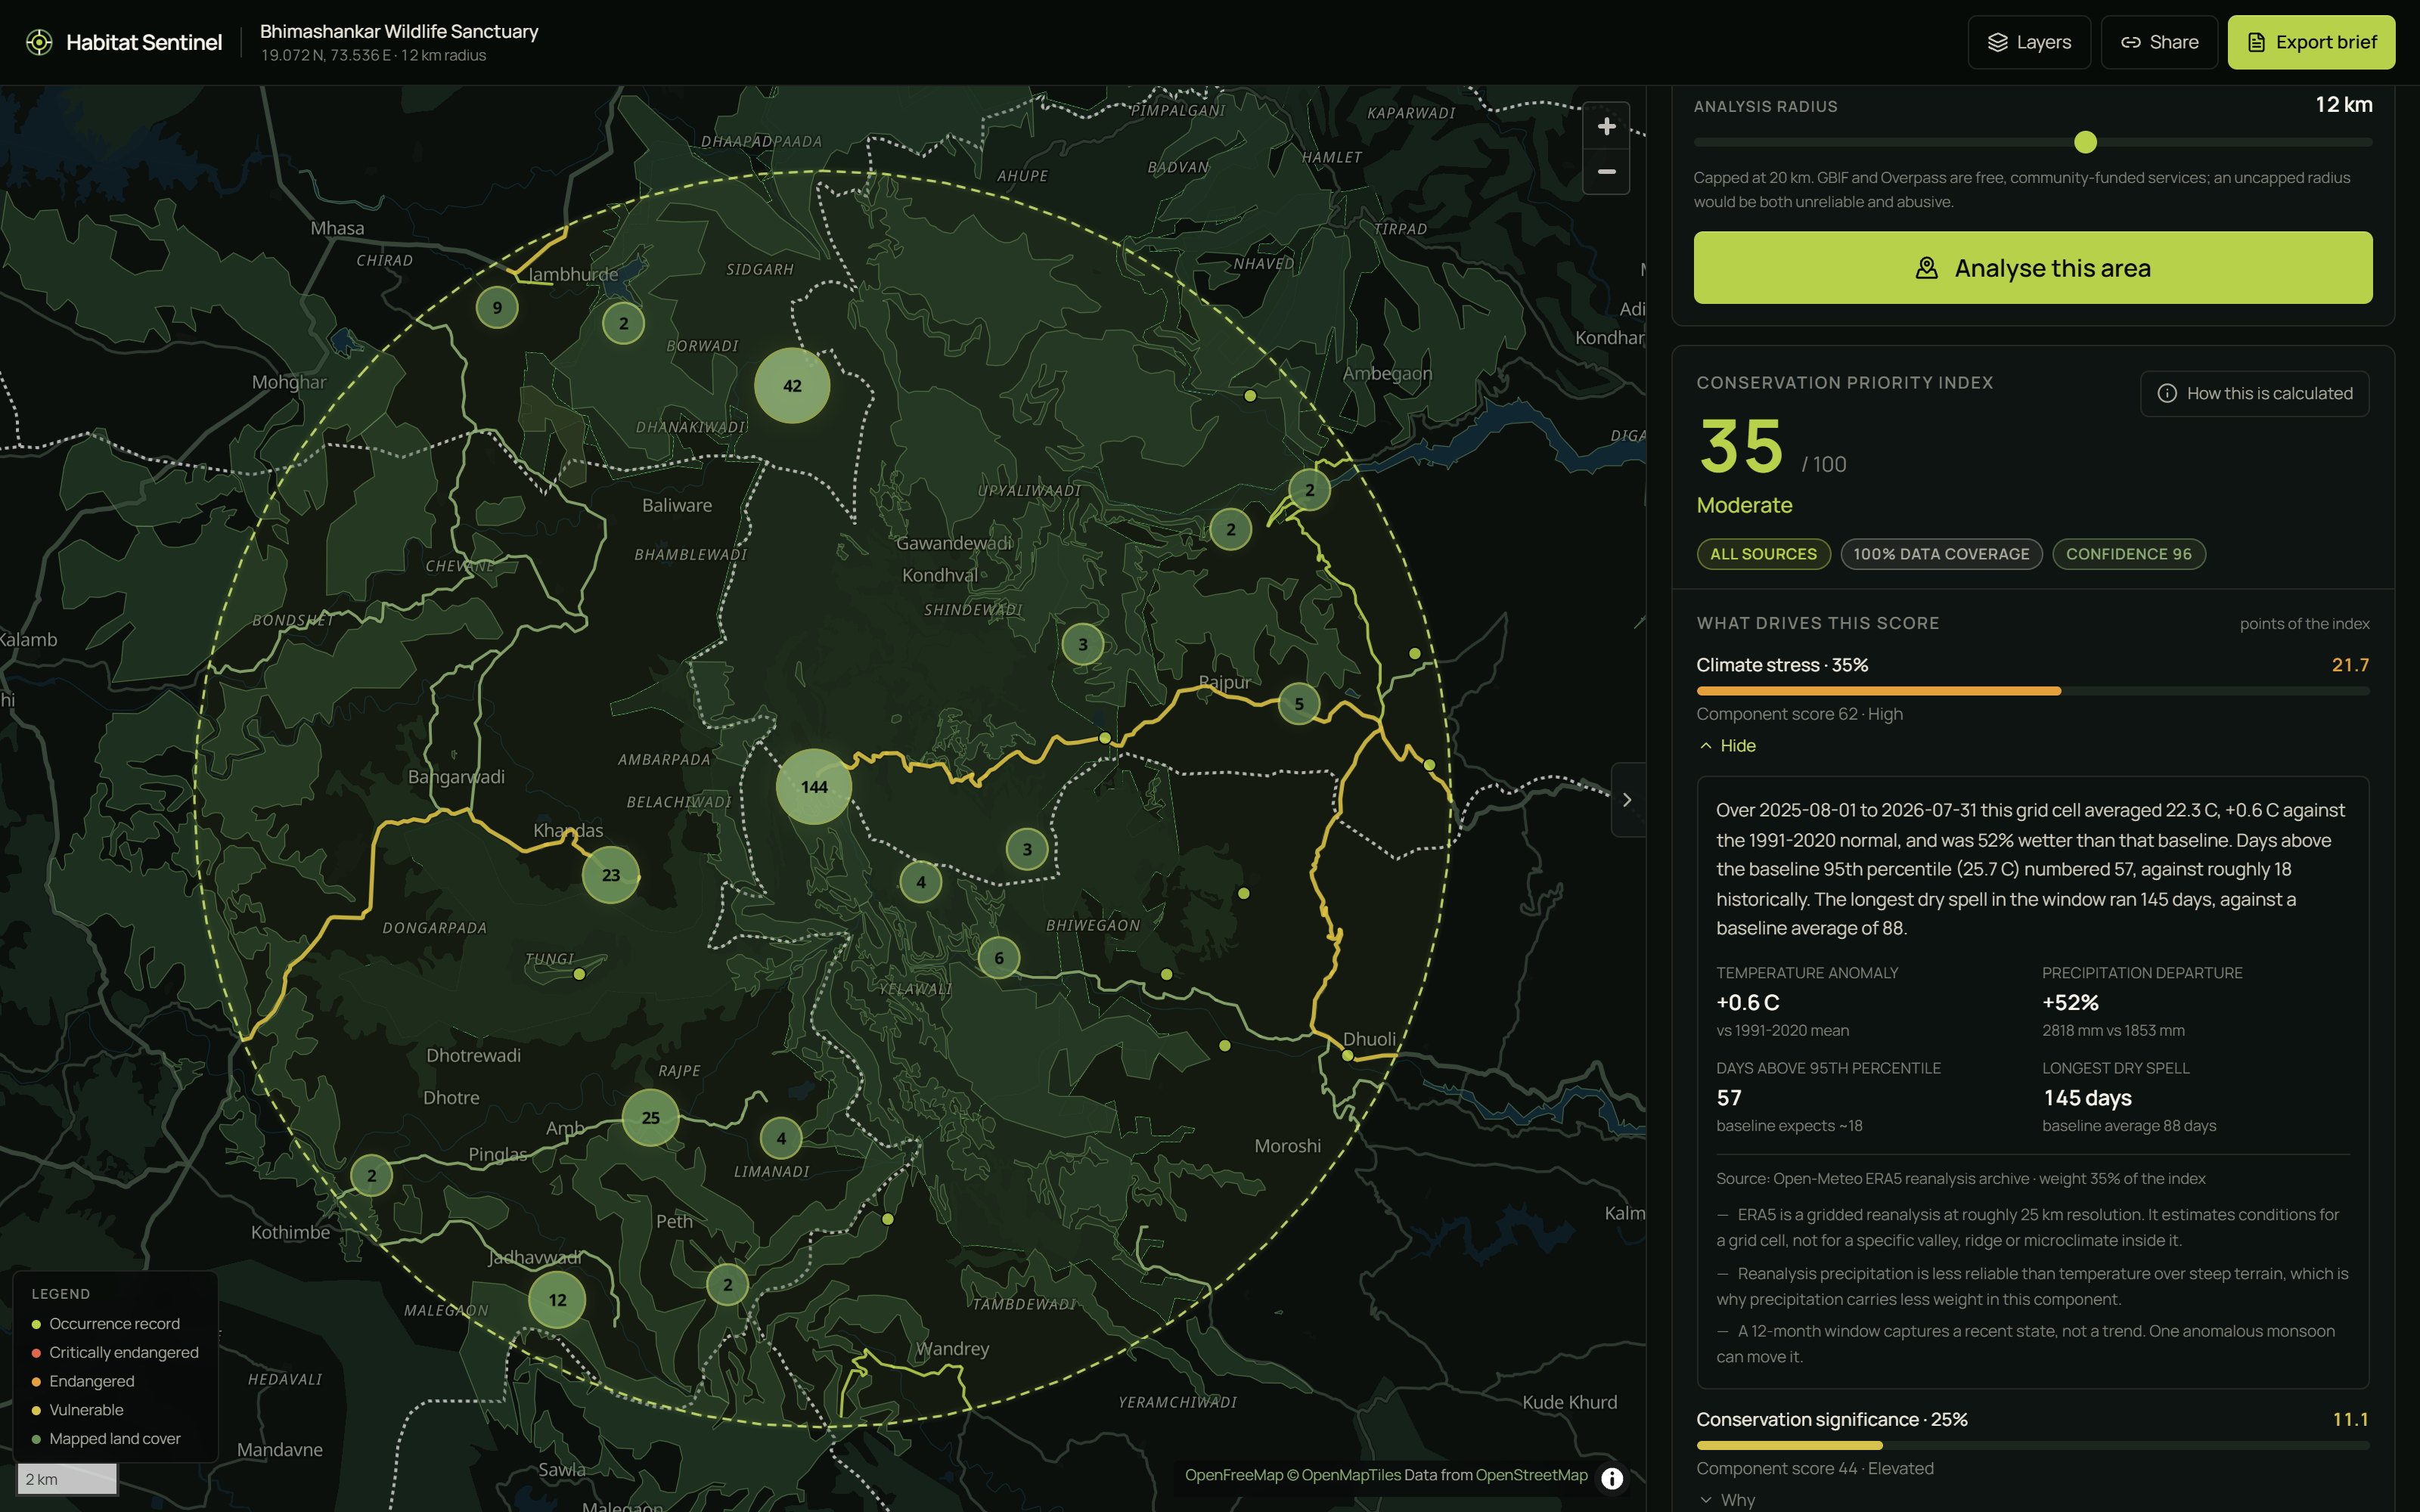
Climate stress (35%) — ERA5 temperature anomaly, precipitation departure and extreme-heat frequency against the 1991–2020 WMO normal Conservation significance (25%) — GBIF species richness and weighted CR/EN/VU presence Habitat disturbance proxy (25%) — OpenStreetMap major-road density and mapped land cover Hazard exposure (15%) — NASA EONET events, decayed by distance and recency
Every component opens to reveal its inputs, its plain-language explanation, its source, and its limitations. There are no unexplained numbers anywhere in the product.
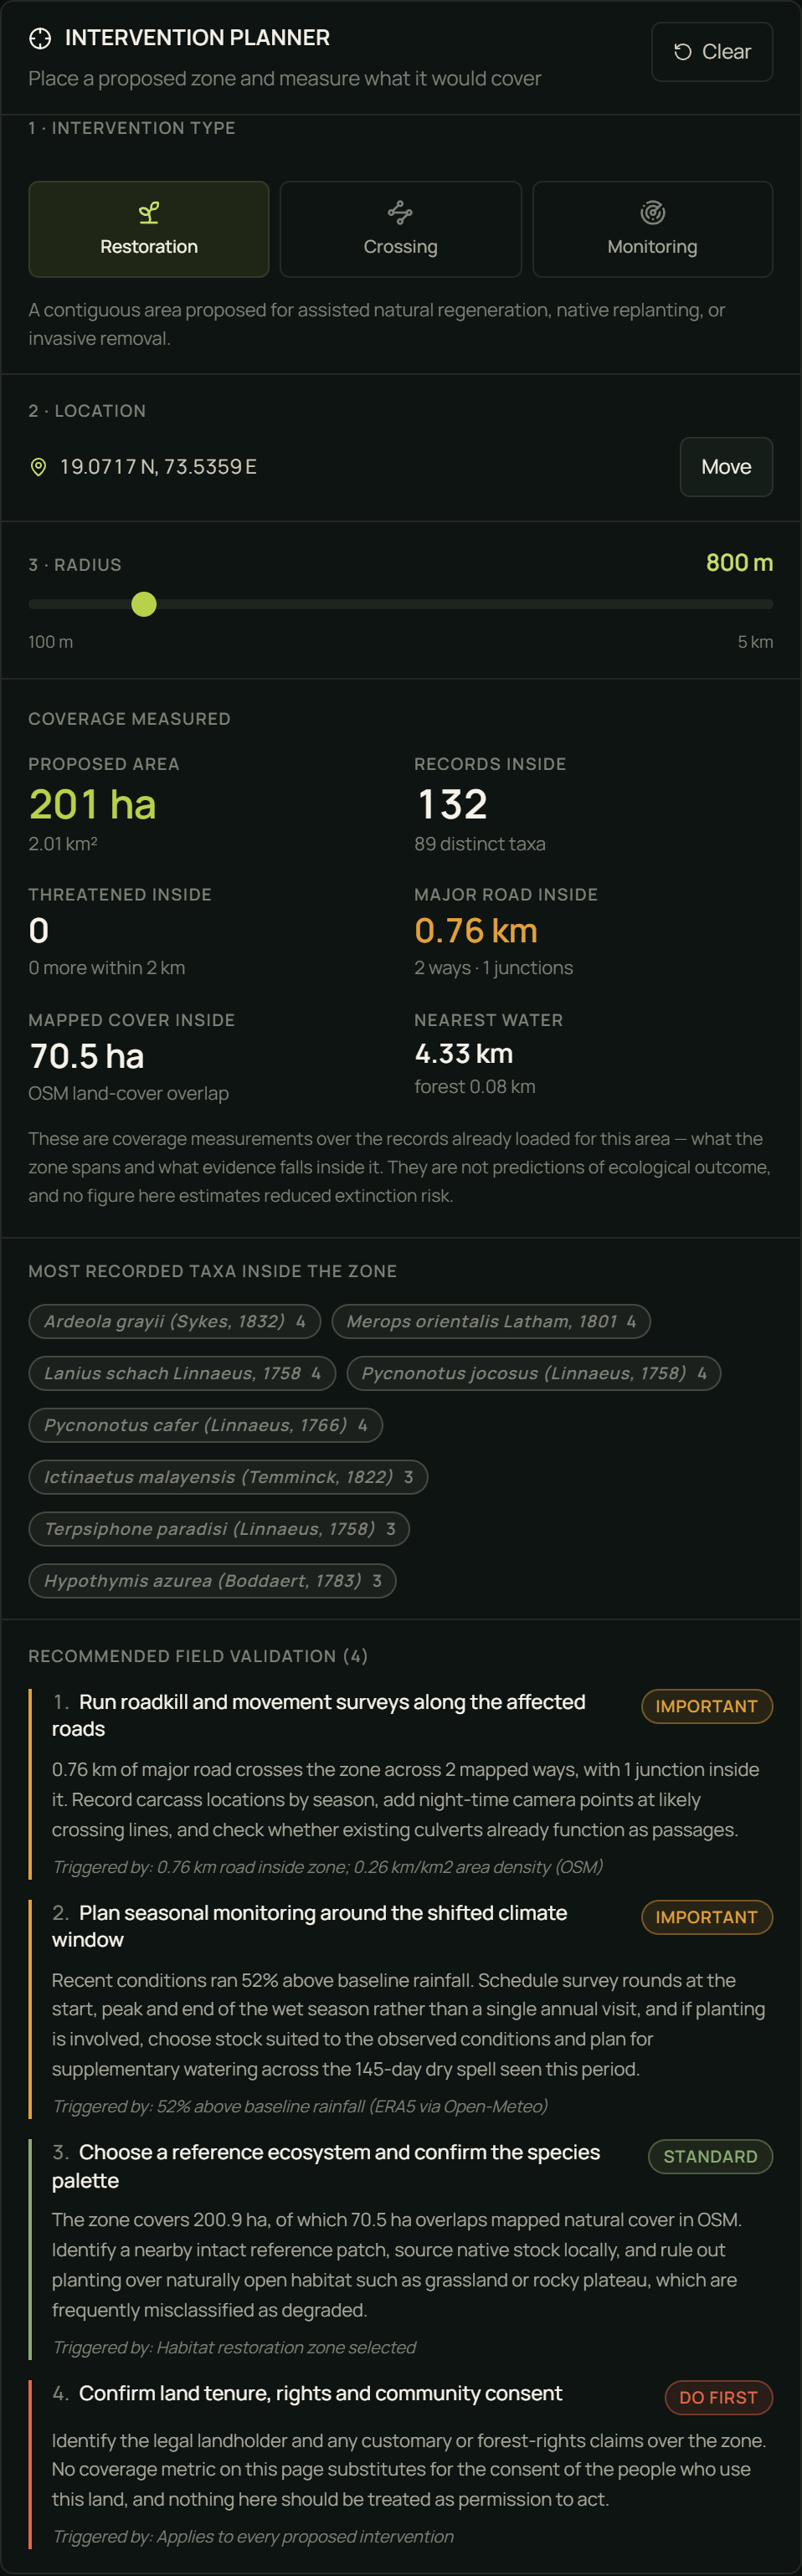
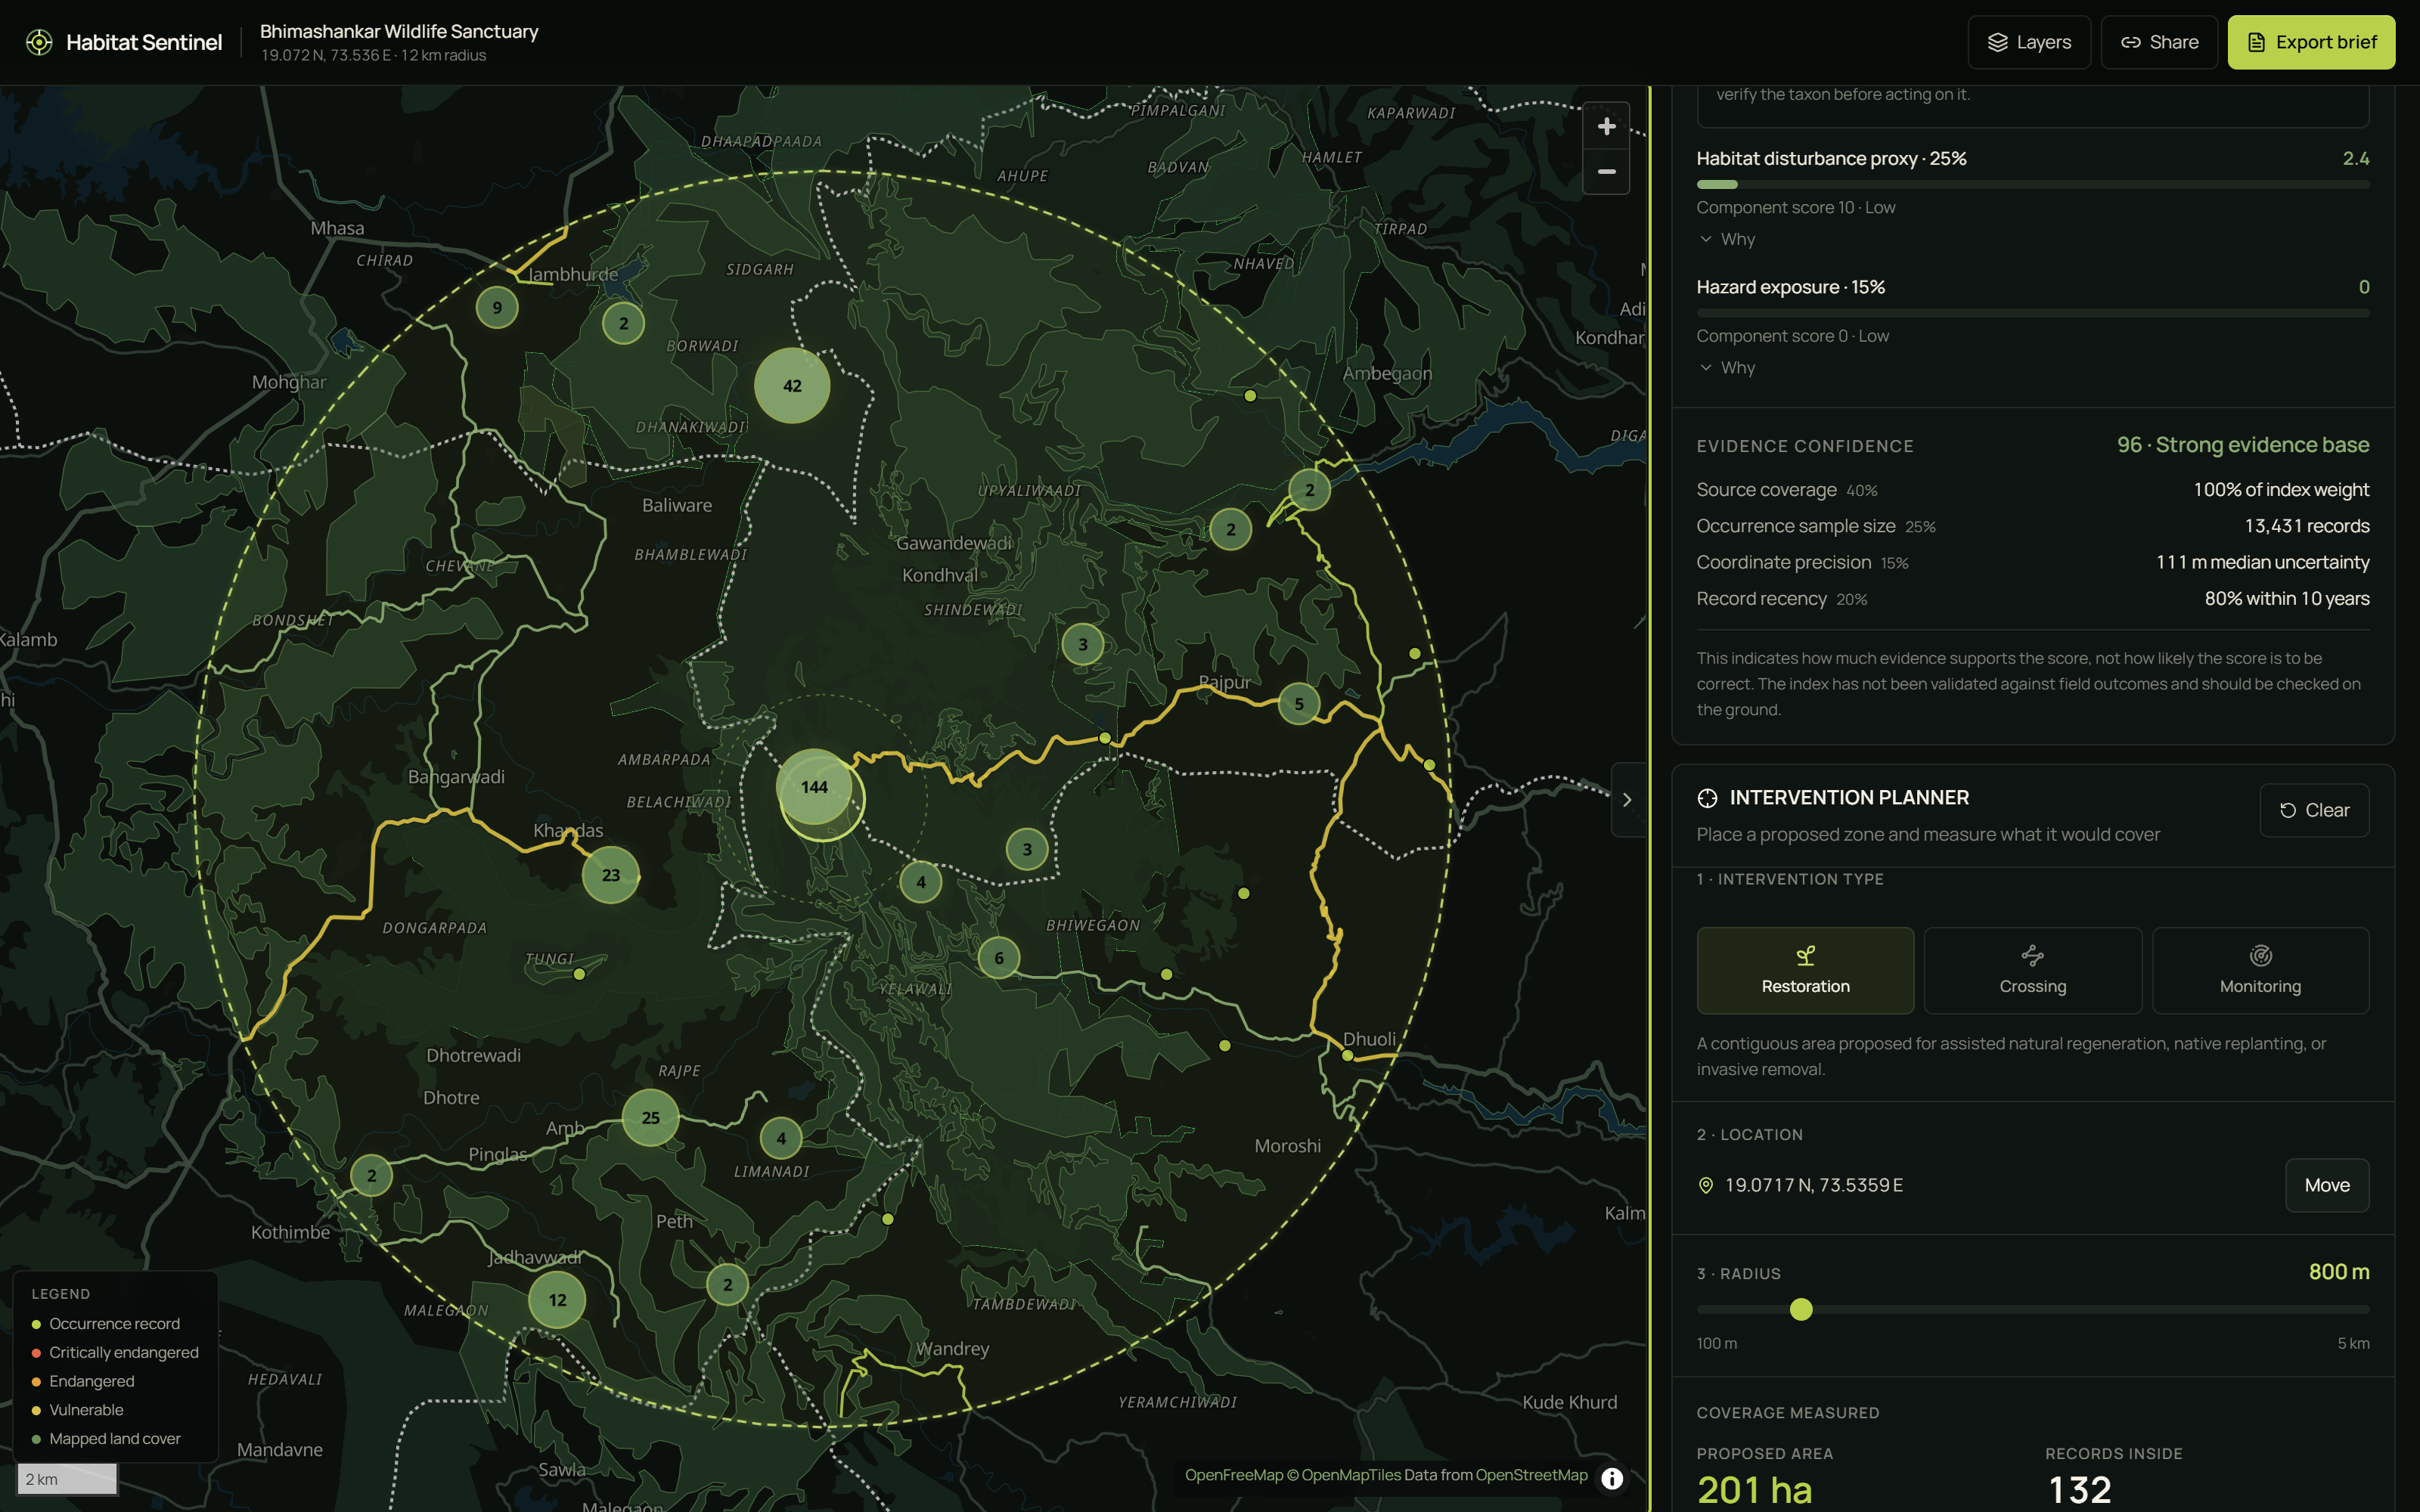
Then you act. Choose an intervention — habitat restoration zone, wildlife crossing candidate, or biodiversity monitoring station — click the map, drag the radius, and watch coverage update live: area in hectares, occurrence records enclosed, distinct taxa, threatened records inside the zone versus merely nearby (reported separately, honestly), major-road length and junctions, distance to nearest mapped water and forest, plus a deterministic field-validation checklist generated from the evidence.
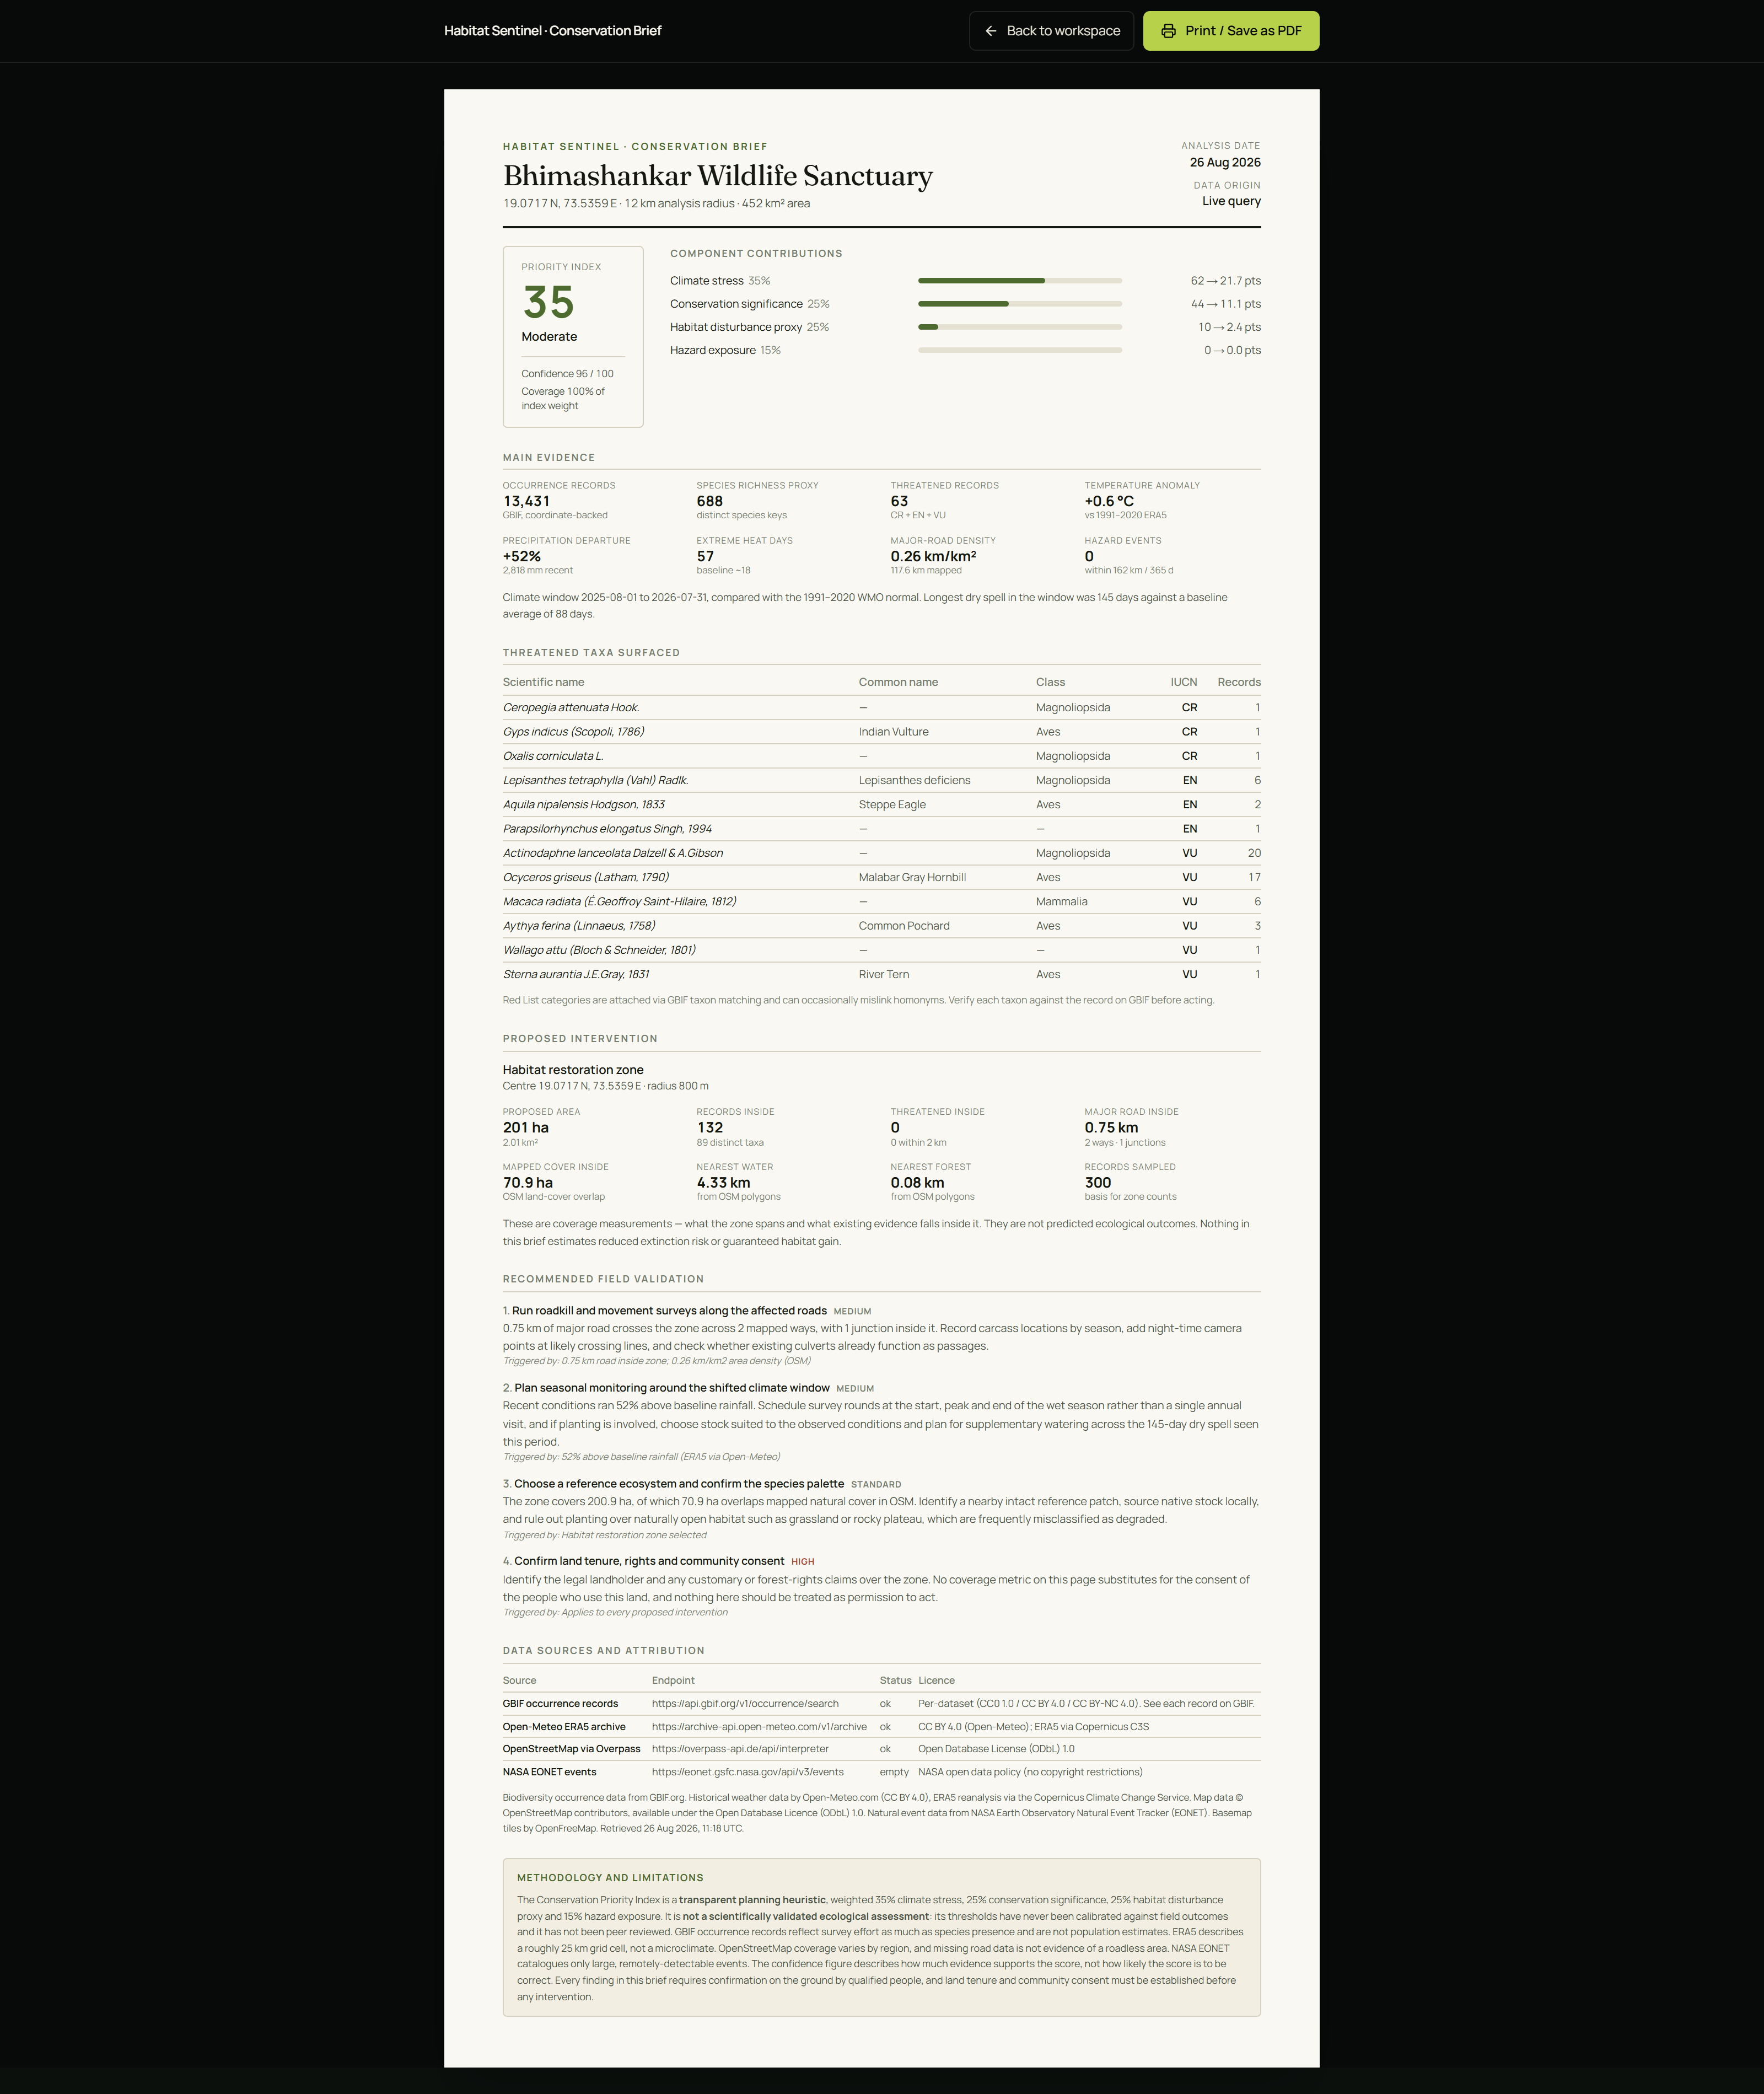
Finally, export a printable A4 Conservation Brief with full source attribution — ready to hand to a forest department or a funder.
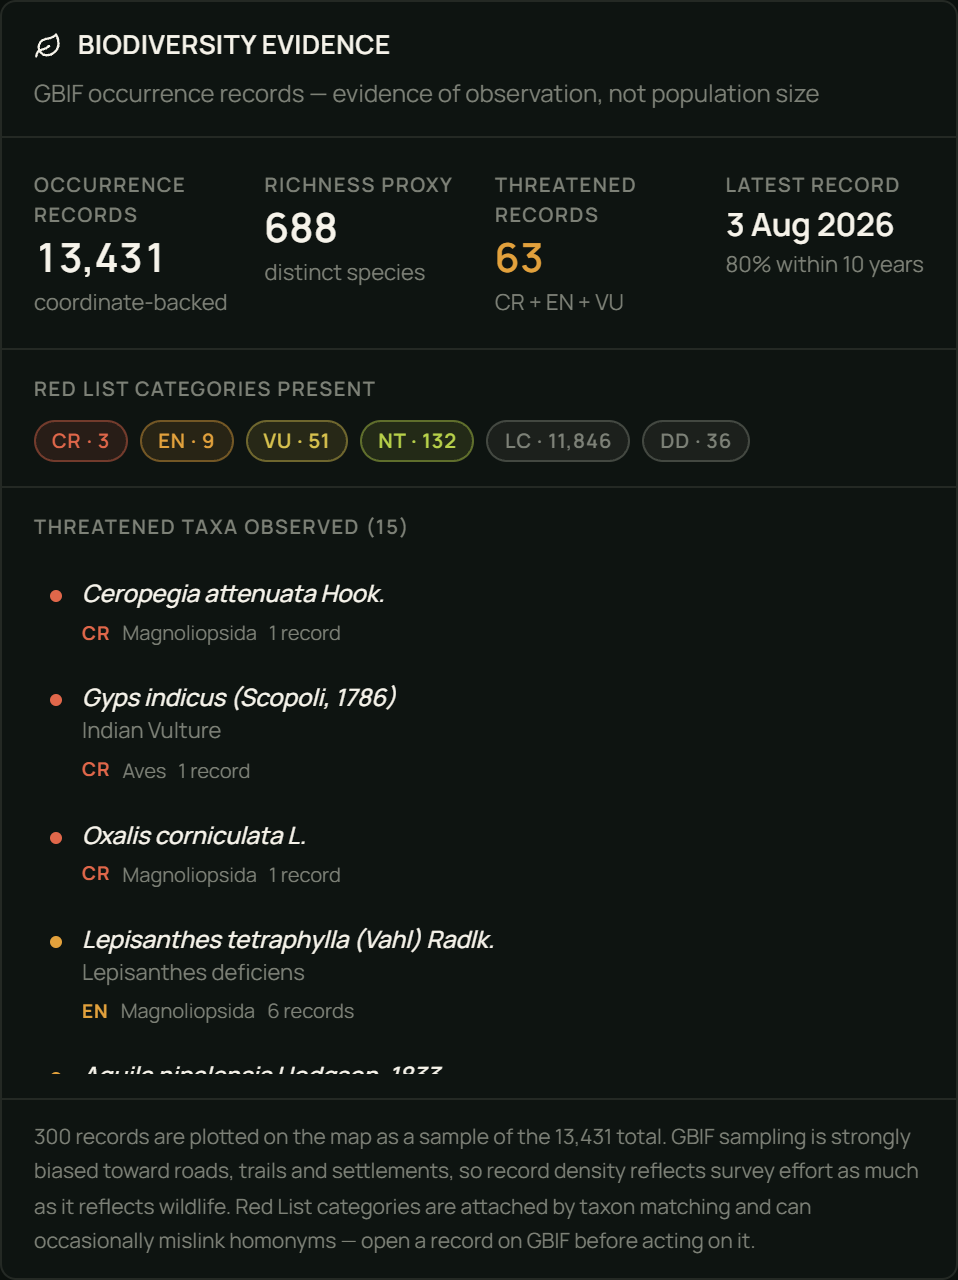
Running the default demo on Bhimashankar Wildlife Sanctuary (Western Ghats, Maharashtra) returns real numbers: 13,431 coordinate-backed occurrence records, 688 distinct species, 63 threatened records (3 CR, 9 EN, 51 VU), +0.58 °C against the 1991–2020 baseline, 57 days above the historical 95th percentile against an expected ~18, and 117.6 km of mapped major road. Index: 35 — Moderate, at 100% data coverage and 96 confidence. OpenStreetMap even returns the sanctuary's own boundary and its proposed eco-sensitive zone.
On impact, we're deliberately careful. Habitat Sentinel does not protect habitat. It shortens the distance between open data and a defensible plan — lowering the cost of looking, making prioritisation arguable rather than authoritative, turning "we want to restore this valley" into "412 ha, 1,847 records, 4 threatened records, 2.3 km of road, here is the brief," and routing effort toward field verification. When a polygon returns 12 records, that isn't "low biodiversity" — it's an under-surveyed area, and the tool says so and recommends baseline monitoring. The honest ceiling: this helps allocate scarce attention. It is not a substitute for funding, tenure reform, enforcement, or ecologists.
How we built it
Next.js 16 (App Router) · TypeScript strict · Tailwind CSS v4 · MapLibre GL JS · Turf.js · Recharts · Zod · Vitest · Playwright
Four principles drove every decision:
The scoring engine is pure. Synchronous, framework-free, no clock, no network, no randomness. Same inputs, same score, always. That's what makes it unit-testable and lets a judge reproduce any number we display.
Missing data is never zero. The decision we're most proud of. If Overpass times out, habitat disturbance is excluded from the index and its weight removed from the denominator — not scored 0. A zero asserts "we measured no disturbance here." Unavailable means "we could not look." Below 60% available weight we publish no score at all and say Insufficient evidence.
Every threshold lives in one file. lib/constants/scoring.ts holds every weight, scale and decay constant, each with a comment explaining why that number. The in-app Methodology dialog renders the same values at runtime, so documentation cannot drift from code.
Nothing is ever fabricated. No placeholder counters, no synthetic fallbacks. When a source fails, the UI names it.
Server-side adapters own all upstream I/O: AbortController timeouts, one controlled retry, Zod validation at the boundary, typed errors carrying enough context for the UI to say which source broke. Raw payloads never reach the browser — only normalized DTOs. The four sources are fetched concurrently, so the slowest dominates wall-clock time rather than the sum.
GBIF and Overpass are donated infrastructure, so we cap the radius at 20 km, request only motorway→tertiary roads and a small land-cover set (never buildings), identify ourselves in the User-Agent, and cache aggressively.
Testing: 136 Vitest unit tests pin the scoring engine — score boundaries, monotonicity, sub-additive hazard stacking, confidence factors, geospatial maths, and the missing-data exclusion rule (asserting that dropping a zero-scoring component raises the normalised index, which is only true if the weight really left the denominator). Four Playwright specs walk the live demo path end to end against real APIs, including one verifying that a mid-Pacific query degrades honestly rather than inventing data.
Challenges we ran into
Resisting the impressive-but-false number. The strongest pull in a hackathon is toward a confident metric. "This intervention protects 340 hectares of critical habitat" demos far better than "this zone spans 340 ha and encloses 1,847 occurrence records." We chose the second every time. There is no predicted outcome anywhere in the product, and a unit test asserts the checklist never contains outcome language.
Four bugs that only appeared in a production build. Every genuinely dangerous defect was invisible to unit tests and surfaced only by driving the real app:
/explore returned HTTP 500 in production — Server Components were importing from a 'use client' module. The map silently never loaded. MapLibre resolves its worker relative to its own import.meta.url, which Turbopack rewrites to a synthetic chunk URL; the request 404'd to our HTML shell and the browser refused it. Self-hosting the worker fixed it — but only after discovering the worker itself imports a sibling maplibre-gl-shared.mjs, reproducing the identical error one level down. Caching was silently broken. Playwright logs revealed items over 2MB can not be cached. The GBIF sample (~2.3 MB) and Overpass response (~2.5 MB) both blew past Next's ceiling, so our two most expensive calls were re-fetched on every request while the code looked like it was caching them — exactly the abusive load pattern our radius caps exist to prevent. Number(null) is 0, not NaN, so a missing lat parameter produced a valid-looking 0 and sent ?demo=1 to Null Island at a 1 km radius.
Catching our own methodology errors. Our first Bhimashankar run returned confidence 100. Investigating rather than celebrating revealed we were sorting the GBIF sample newest-first (right call for a planner) and then computing "share of records within 10 years" from that sample — guaranteeing ~100% by construction. The real figure is 80%. We'd have shipped an inflated confidence score on every analysis.
Deciding what "no data" means. Zero EONET events is a real answer; an Overpass timeout is not. Collapsing both into 0 would have been much simpler and much more misleading. Our SourceStatus type keeps empty and failed distinct end to end, and the UI words them completely differently.
Real data is messy in instructive ways. GBIF returned Oxalis corniculata — creeping woodsorrel, a global weed — tagged Critically Endangered via a taxon-matching homonym collision. Rather than filter it away, we surfaced it as a documented limitation with a link to verify. That mislink is exactly what a planner needs to know about the data they're using.
Accomplishments that we're proud of An index you can argue with. Open any component to see its inputs, explanation, source and limitations. Open the Methodology dialog to see the formula, every weight, and a live table of which source returned what, when, and under which licence. Missing data handled correctly — excluded and renormalised, with a hard insufficient evidence floor, and a test proving the denominator really changes. We fixed our own methodology bugs instead of shipping the flattering numbers. A 450× performance fix from a log line we could have ignored. Caching the normalized DTO instead of the raw payload cut a repeat analysis from 13.5 s to 0.03 s — and took real load off two community-funded APIs. Zero console errors across the full demo path, verified in a production build. No API keys, no database, no accounts. Deploys to Vercel with zero configuration, and a link is the entire sharing mechanism. A cached snapshot that is genuinely real — recorded from actual API responses, refuses to write if any source fails, and never appears without a visible banner and a route back to live. Attribution treated as an obligation, not a footnote — in the UI, the methodology panel, and the exported brief. What we learned
"Missing" and "zero" are different, and conflating them is the most dangerous bug in any scoring system. It's also invisible: the number still renders, it just quietly lies.
Sorting your sample changes what you can measure from it. Newest-first is right for a planner and catastrophic for a recency statistic.
Bias in open biodiversity data is structural, not incidental. GBIF density maps survey effort at least as much as it maps life. Any tool built on it that doesn't say so is misleading its users by omission.
Reanalysis is not observation. ERA5 gives a physically consistent estimate for a ~25 km cell. In the Western Ghats a single cell spans a ridge, a plateau and a rain shadow.
Test the demo path, not just the units. All four of our most dangerous bugs surfaced from driving the real app in a production build — none from unit tests.
Constraints improve honesty. Capping the radius at 20 km to protect donated infrastructure also made every query fast and every result interpretable.
What's next for Habitat Sentinel Validate the index. Compare its rankings against expert-ranked sites. Until that happens the weights are reasoned guesses, and we say so on every screen. This is the single most valuable next step. Real land-cover classification (ESA WorldCover / Dynamic World) to replace the OSM land-cover proxy with measured data. Patch-level fragmentation metrics — effective mesh size, core-area ratio — so "disturbance" stops being a road-density stand-in. WDPA protected-area context: is this inside, adjacent to, or outside protection? Temporal trends rather than a 12-month snapshot — rolling anomalies over 10+ years. Multi-zone comparison for evaluating candidate interventions side by side. Offline field mode, because the users who most need this often work without connectivity. Write observations back to GBIF/iNaturalist, closing the very data gap the tool exposes.
Built With
- era5
- gbif-api
- maplibre-gl
- nasa-eonet
- nasa-gibs
- next.js
- open-meteo
- openstreetmap
- overpass-api
- playwright
- react
- recharts
- tailwindcss
- turf.js
- typescript
- vercel
- vitest
- zod

Log in or sign up for Devpost to join the conversation.