-
-
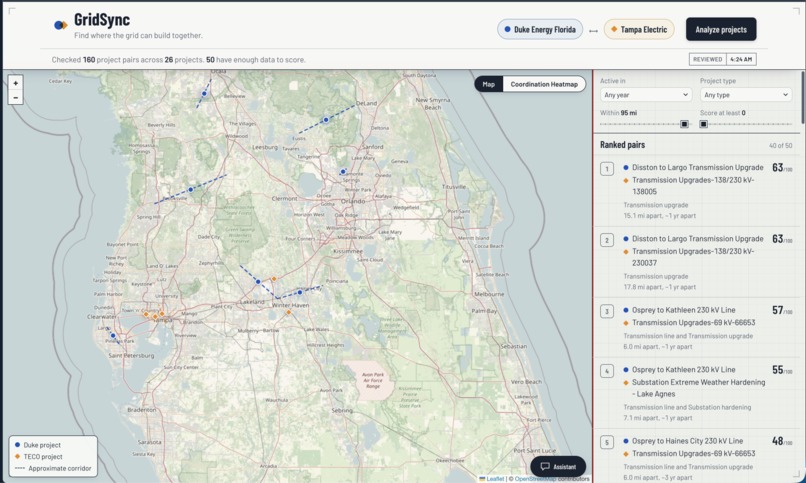
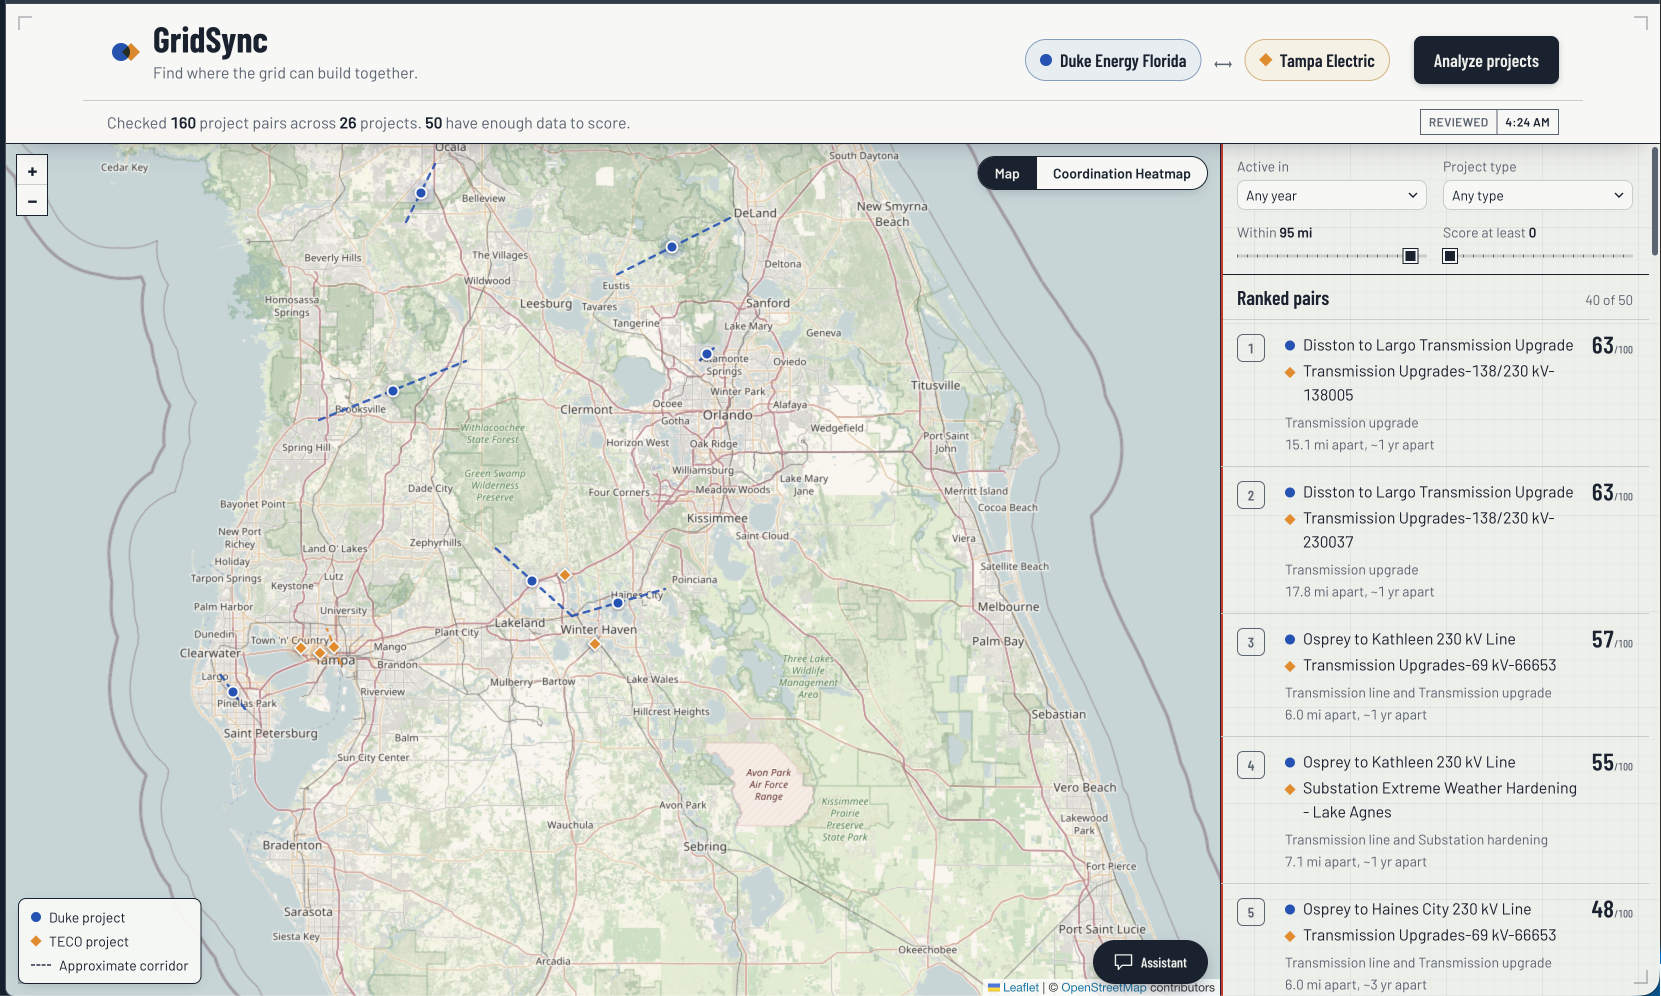
All Pairs being shown
-

GridSync Logo

The idea for GridSync came from thinking about how much planning goes into large energy and construction projects, and how difficult it can be for different organizations to see where their plans overlap.
During the hackathon, we became especially interested in Sperry Tech's dedication to bringing machine learning and modern technology into industries like construction and energy. A lot of the time when people think about AI and machine learning, they think about chatbots or consumer applications. We liked seeing those same technologies being applied to real infrastructure and real-world engineering problems.
That got us thinking: What if we could use public utility data to find situations where companies may have opportunities to coordinate before construction even starts?
Utilities already publish information about future transmission projects, infrastructure upgrades, and construction plans. The problem is that this information is spread across different datasets and large planning documents.
That's where the idea for GridSync came from.
Our goal became simple:
Find where the grid can build together.
What We Built
GridSync is a planning tool that analyzes upcoming utility infrastructure projects and looks for potential coordination opportunities between different utility companies.
For our prototype, we focused on Duke Energy Florida and Tampa Electric (TECO).
Instead of just looking at whether two projects exist in the same general area, GridSync asks a few important questions:
- How close are the projects?
- Are they happening around the same time?
- Are they doing similar types of work?
- Do they involve similar infrastructure?
- How confident are we in the available data?
GridSync brings those factors together into a Coordination Score that helps surface project pairs that may be worth looking into further.
We also wanted the score to be understandable. Rather than simply showing someone a number, GridSync breaks down why the opportunity was identified and shows potential areas that could be investigated, such as specialized crews, heavy equipment, material logistics, construction mobilization, or outage planning.
The goal isn't to tell utilities that they should coordinate. It's to help planners find opportunities that might otherwise be difficult to notice.
How We Built It
We started with real public infrastructure data from sources such as the Our Grid Future Planned Transmission Projects database, Tampa Electric planning documents, and supporting utility records.
One of the first things we realized was that real-world infrastructure data is messy.
Different sources describe projects differently. Some projects have exact construction dates while others only provide a year. Some have clear geographic information while others only provide known substations or endpoints.
So before doing any machine learning, we spent time cleaning and organizing the data into a format GridSync could actually compare.
From there, we built several parts of the analysis.
For location, GridSync looks at known project locations and endpoints to determine how geographically close projects are.
For timing, we compare the available construction schedules while being careful not to pretend we know more than the public data actually tells us.
For project similarity, we use TF-IDF and cosine similarity to compare project descriptions. We then combine project similarity with structured infrastructure information, geographic proximity, and schedule compatibility to create the Coordination Score.
On the frontend, we built an interactive experience where users can explore projects on a map, view potential coordination opportunities, understand why they received their scores, and see the original evidence behind the analysis.
We also added a Coordination Opportunity Heatmap to make it easier to see areas where potential opportunities are concentrated.
Finally, we built a GridSync Planning Assistant so users can ask questions about projects and opportunities in normal language. The assistant doesn't make up the analysis or calculate scores itself. GridSync performs the calculations first, and the assistant helps explain those results and find relevant information from the original planning documents.
Challenges We Faced
The hardest part of building GridSync wasn't actually the machine learning.
It was figuring out how to work with real infrastructure data without making assumptions that the data couldn't support.
For example, one utility might provide a specific construction month while another only provides a construction year. It would be easy to turn that year into an exact date just to make the calculations simpler, but that would give the user a false sense of accuracy.
We ran into similar issues with project locations. Sometimes we knew the endpoints of a project but not the exact transmission route between them.
Because of that, we made a few important rules for ourselves while building GridSync:
- Missing information should stay missing instead of becoming zero.
- We shouldn't invent project routes or locations.
- We shouldn't make dates look more precise than they actually are.
- The user should be able to understand where a score came from.
- Potential shared resources should be treated as things to investigate, not things we know are available.
Another challenge was simply knowing when to stop adding things. There were a lot of directions we could have taken the project, but we wanted to focus on building something that felt useful instead of adding technology just for the sake of adding technology.
What We Learned
One of our biggest takeaways from building GridSync was that using machine learning in infrastructure isn't always about creating the most complicated model.
Sometimes the bigger opportunity is using technology to connect information that already exists and make it easier for people to make decisions from it.
We also learned how important explainability becomes when you're working with real infrastructure.
It's not enough for a system to say:
"These two projects are a good match."
A planner is naturally going to ask:
Why?
How close are they?
When are they being built?
What makes the projects similar?
Where did the information come from?
What information do we still need to verify?
GridSync was designed around being able to answer those questions.
That connects back to what originally caught our attention about Sperry Tech. We were fascinated by seeing a company focused on bringing machine learning and modern technology into construction and energy instead of keeping those technologies limited to traditional software applications.
Building GridSync gave us a chance to explore that same idea ourselves.
At its core, GridSync is about taking information that's already out there and turning it into something more useful:
helping planners discover where the grid might have an opportunity to build together.
Built With
- fastapi
- geminiapi
- leaflet.js
- leafletheat
- nextjs
- openstreetmap
- pandas
- python
- react
- scikitlearn
- tailwindcss
- typescript


Log in or sign up for Devpost to join the conversation.