GridSync
Find the connection before the conflict.
Live: https://beforewebuildlets.compare Code: https://github.com/GridSyncDev/GridSync-Main
Inspiration
Utilities plan new transmission lines and substations years in advance, and they publish those plans. But each utility plans mostly on its own. A neighbor across a state line can be rebuilding a line a few miles away, in the same year, and nobody connects the two. That means two crews, two outages, two staging yards and two rounds of permitting for work that could have been coordinated.
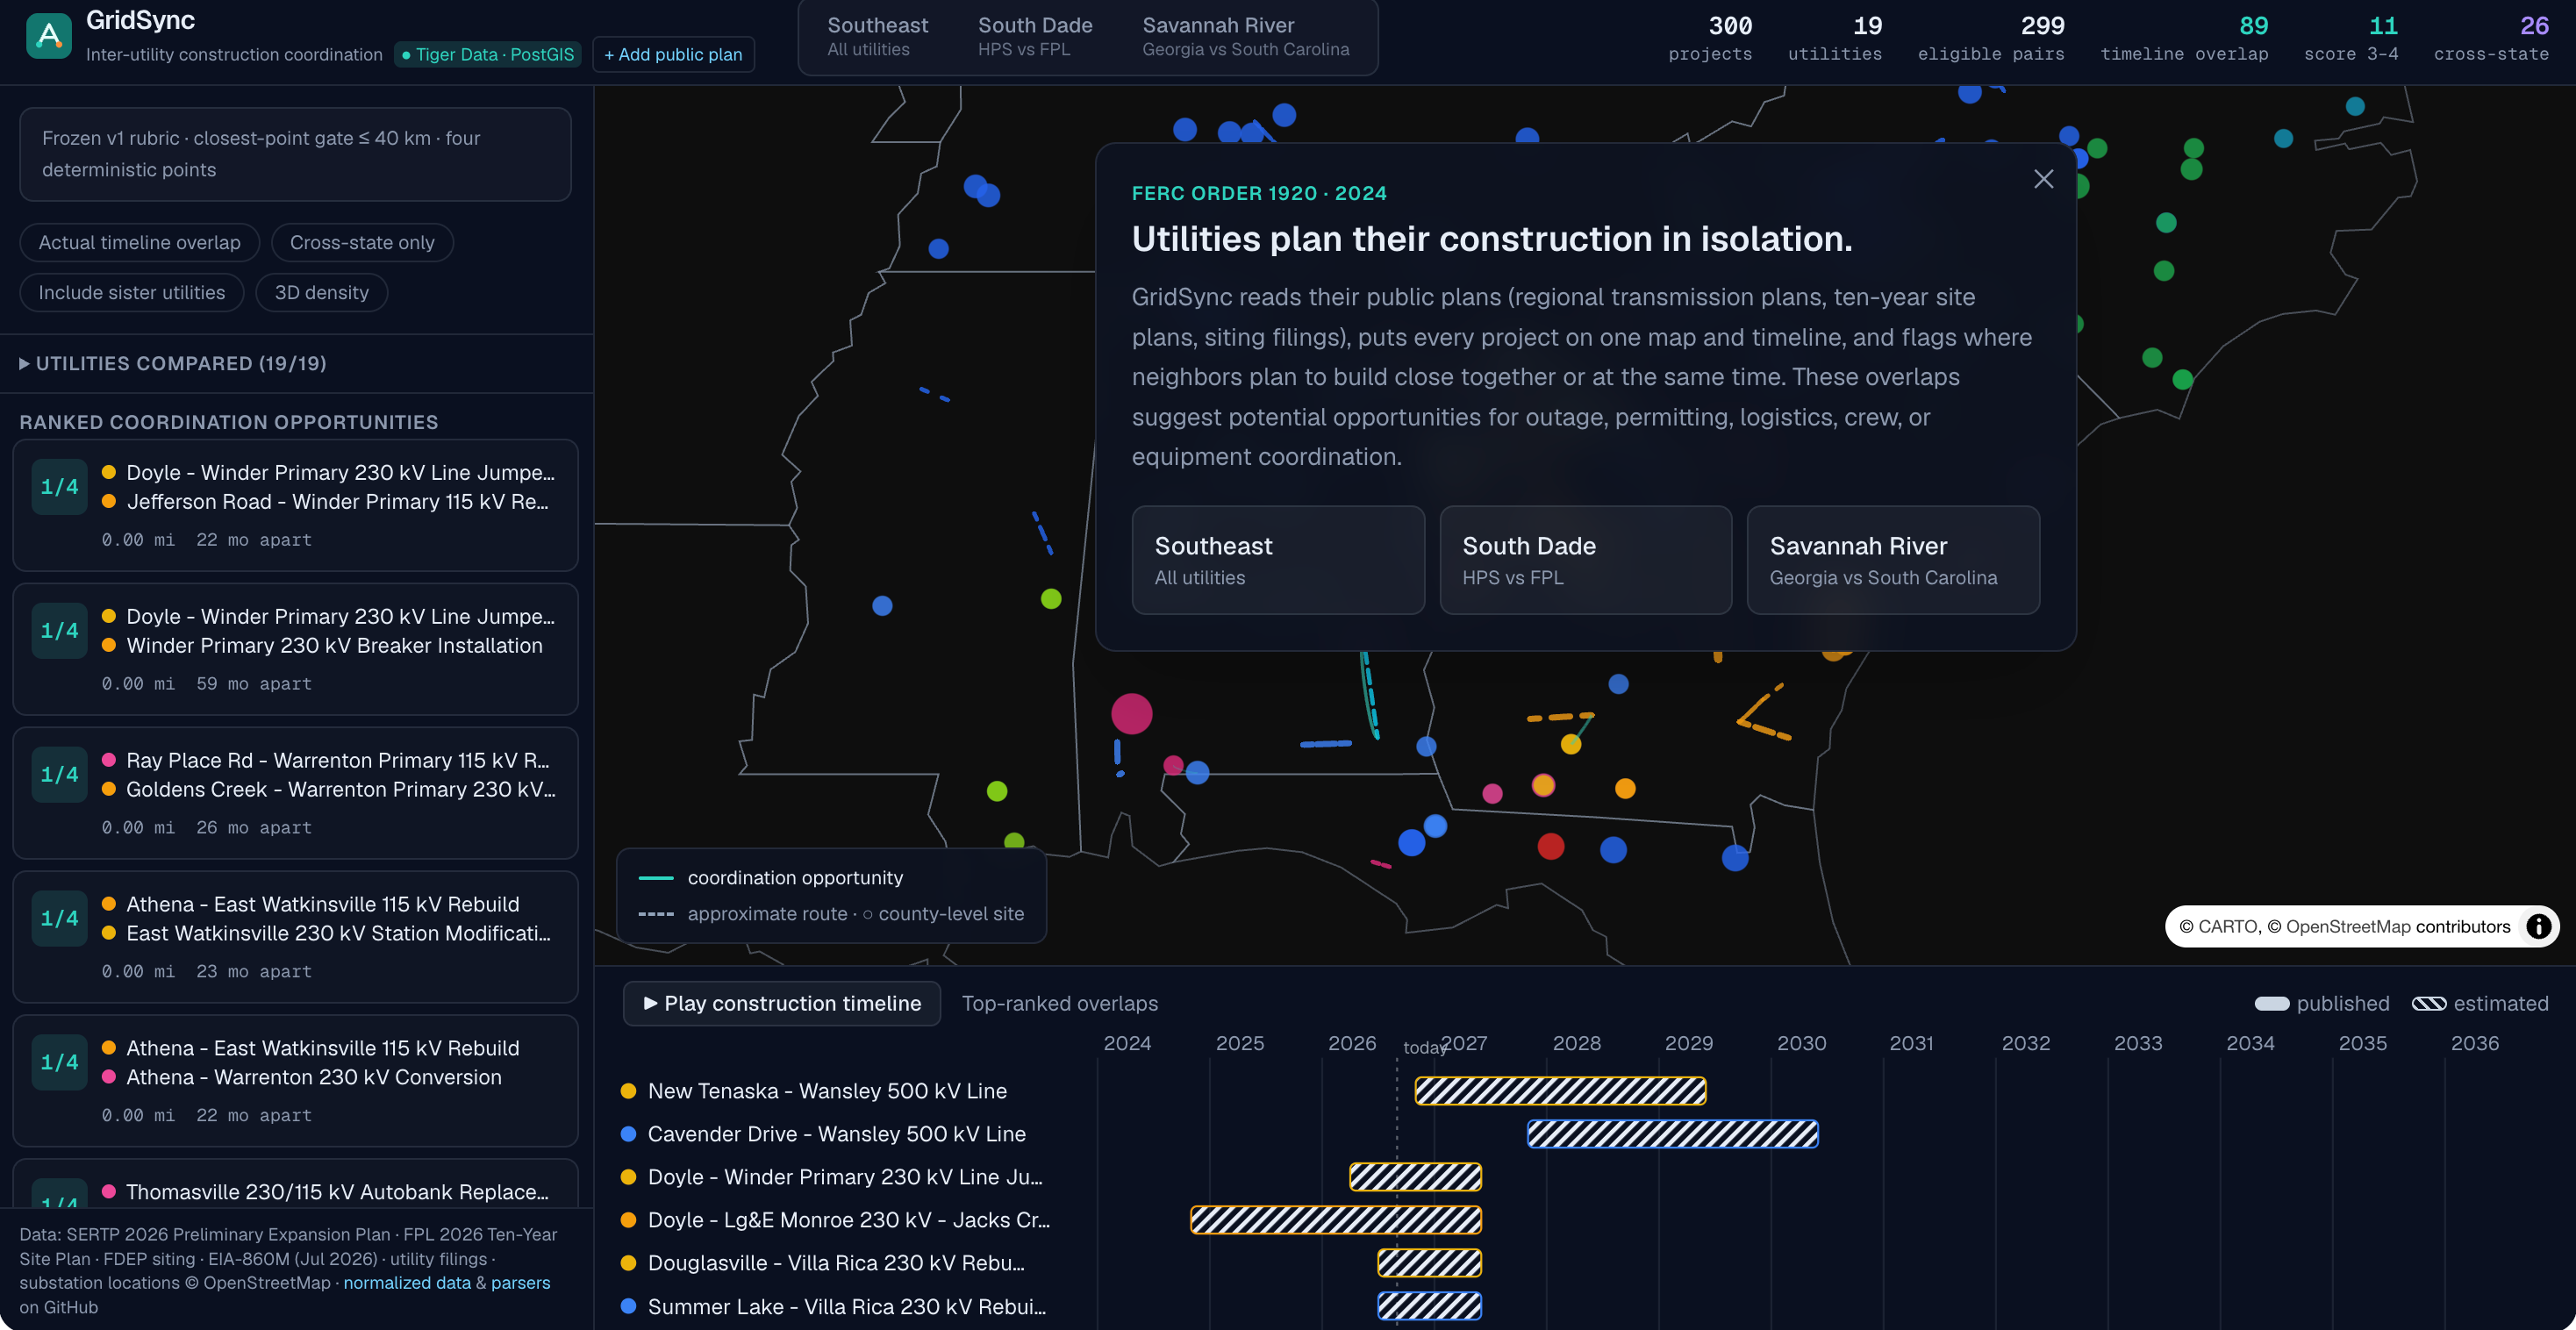
This is a real and current problem. In 2024 FERC issued Order No. 1920 because utilities have historically planned in isolation. Sperry Tech's Gridlock challenge asked us to build a smaller version of that coordination tool: take the public plans of at least two utilities and show where their work overlaps in space and time.
What it does
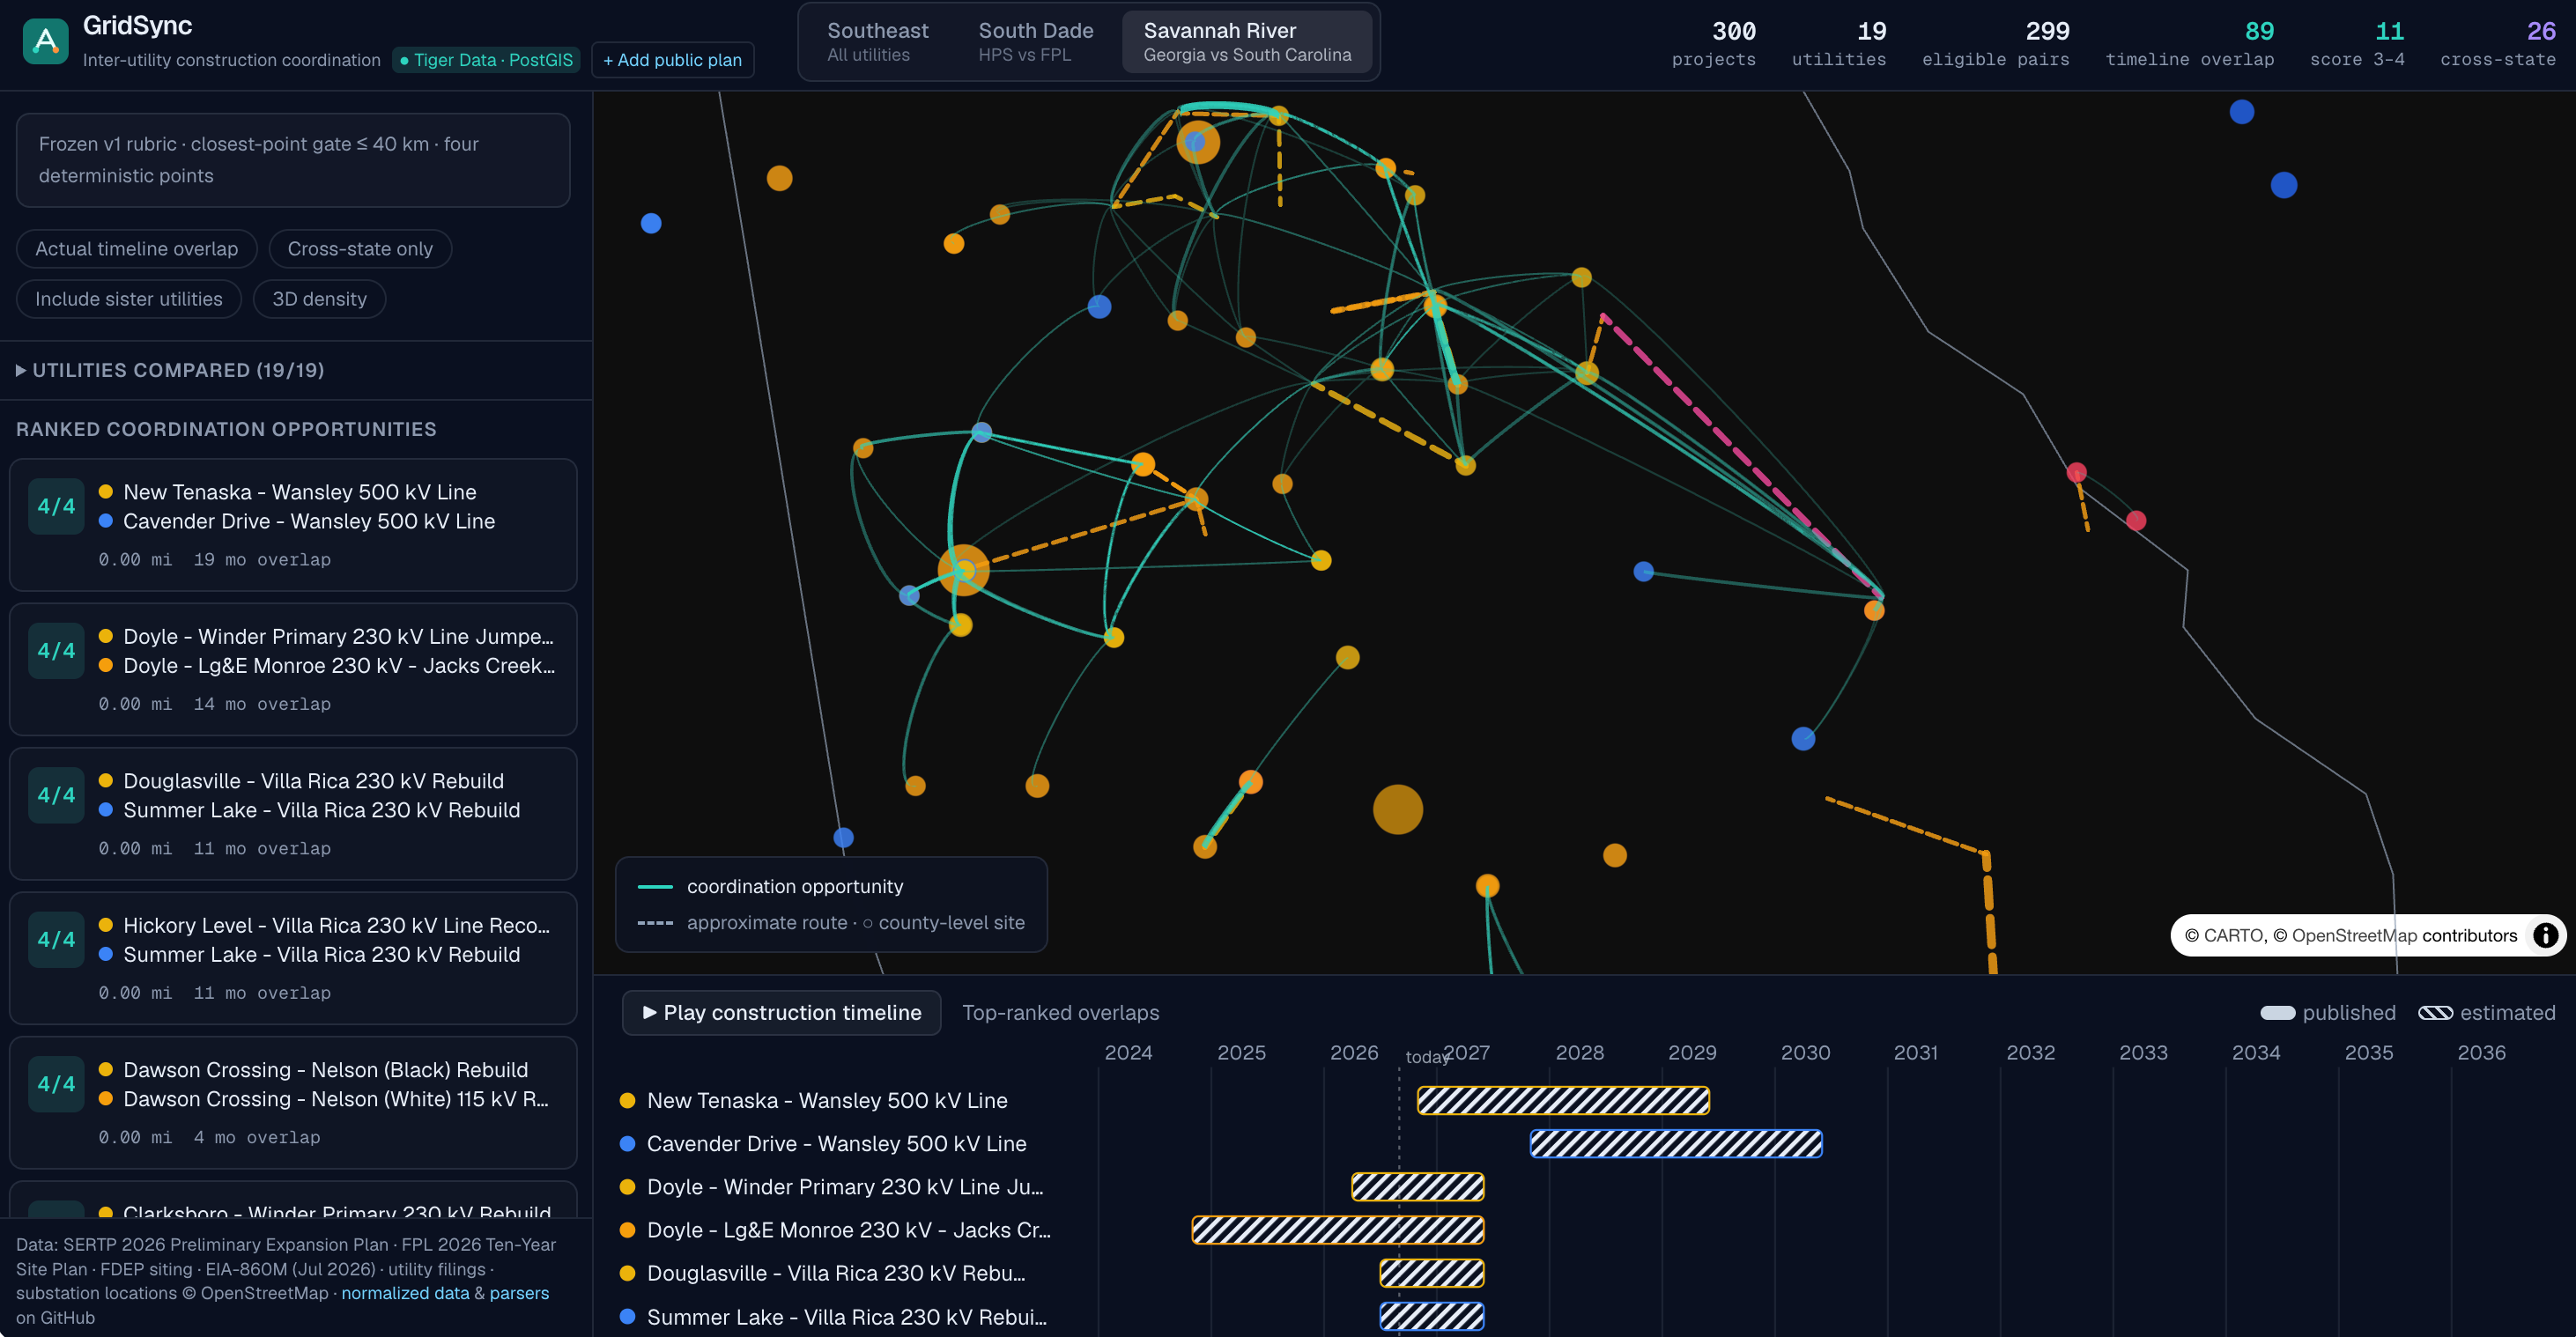
GridSync reads public construction plans from multiple utilities, puts them into one schema, and shows them on one map and one timeline. It then finds every pair of projects from different utilities that are close enough to coordinate and ranks them.
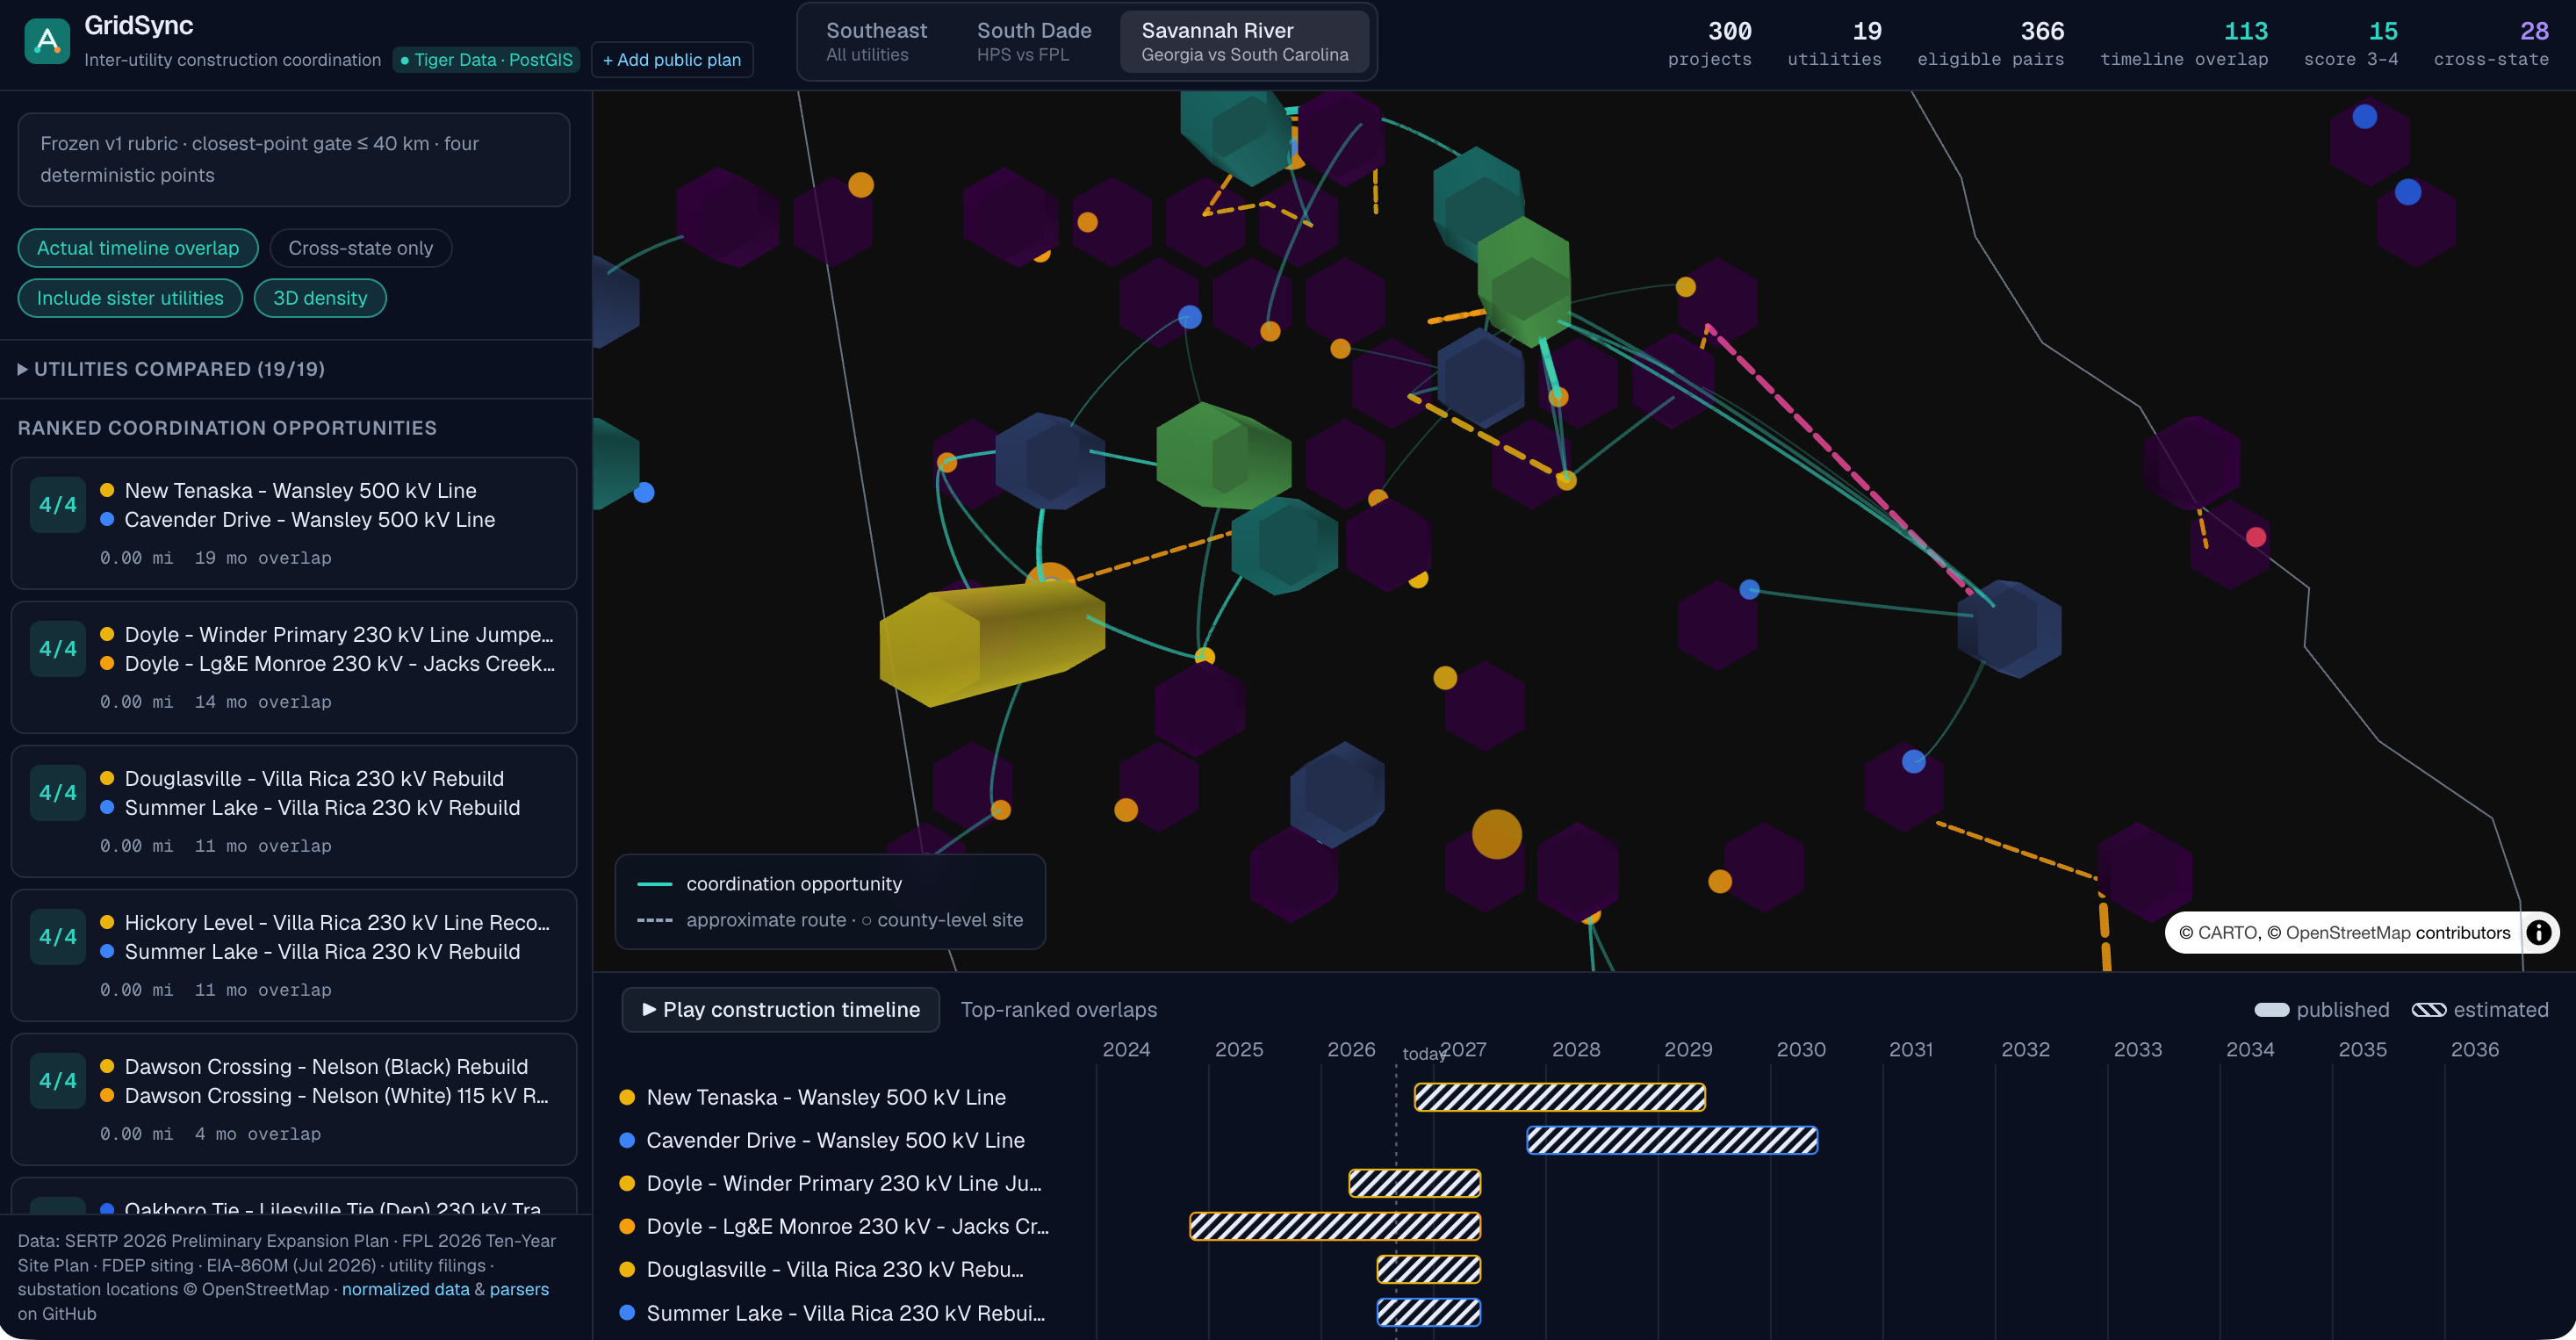
- Map: every utility's planned lines and substations, with overlapping pairs highlighted. Pan, zoom and click any project or pair.
- Timeline: construction windows side by side, so you can see which projects are built at the same time.
- Ranked opportunities: each candidate pair gets a score from 0 to 4 using a simple, explainable rubric:
- Crossing / outage: the projects touch or cross and their construction windows overlap, so one outage could serve both.
- Right-of-way: the projects are less than 1.6 km apart, so access roads and permitting could be shared.
- Site logistics: less than 8 km apart with overlapping or back-to-back schedules, so laydown yards and deliveries could be shared.
- Crews and equipment: less than 40 km apart (about 25 miles, the challenge's threshold), with overlapping or back-to-back schedules, and the same kind of work (line or substation).
- Overlap detail: click a pair to see which points it earned, the distance, the schedule overlap, and links to the source documents for both projects, often with the exact sentence the numbers came from.
- What-if scheduling: slide either project's construction window up to 24 months earlier or later and watch the score update live.
- Impact estimate: for a real 4/4 pair near Winder, Georgia (a Georgia Transmission 230 kV rebuild and a Georgia Power 115 kV rebuild whose lines touch), GridSync shows that one shared staging yard instead of two would avoid 1 to 3 acres of duplicated footprint, based on U.S. DOE guidance that transmission staging areas are generally 1 to 3 acres. A planner can enter their own cost per acre to turn that into a dollar range.
- AI brief: Gemini writes a short plain-English summary of a pair using only the facts the engine computed, and ElevenLabs can read it aloud.
- Plan ingestion: paste text from a utility plan, Gemini extracts the project fields, and the record must pass our schema before it is accepted.
Results on real data: 300 planned projects from 19 utilities produce 366 cross-utility pairs within 40 km. Most of them do not line up in time: 250 score 0, and only 21 earn 2 points or more. That short list is where a planner should start.
For the sponsor's own example, GridSync finds Dominion Energy South Carolina's Jasper-Okatie 230 kV line and Georgia Power's McIntosh-Purrysburg 230 kV line 2.99 miles apart across the Savannah River, with construction windows overlapping by an estimated 4 months.
How we built it
Data sources (all public)
- SERTP 2026 Preliminary Transmission Expansion Plan, the regional plan covering Georgia Power, Southern Company, Georgia Transmission, Duke, TVA and others. We parsed the PDF with Python and pypdf and matched substation names to OpenStreetMap through the Overpass API, searching only within each balancing area's states. 235 of 426 projects matched with confidence. The rest stay unmapped instead of being guessed.
- Georgia Power and Dominion Energy South Carolina project records along the Savannah River, including the sponsor's starter projects.
- FPL 2026 Ten-Year Site Plan and the Florida DEP siting record for Andytown-Oasis.
- City of Homestead substation bids and council records.
- U.S. EIA-860M planned generators (July 2026).
Pipeline
- Each source has an ingestion script that writes normalized JSON.
- A single zod schema is the team's shared contract. If any record fails validation, the build fails.
- The overlap engine is deterministic TypeScript. It measures the closest-point distance between the real geometries (every segment of every line), not the distance between center points, because a long line can pass right next to a substation while its midpoint is far away. Crossing lines have a distance of 0.
- The same data is loaded into Postgres + PostGIS on Tiger Data, where the candidate search runs with
ST_DWithinon the stored geometries using the same 40 km threshold from one shared config file. - The front end is Next.js 16 with deck.gl and MapLibre for the map.
- Gemini is used only to phrase explanations and to extract fields from pasted text. It never produces a distance, date or score.
- The app is deployed on DigitalOcean App Platform and redeploys on every merge to main.
Challenges we ran into
- Plans do not come with coordinates. The SERTP plan lists projects by substation names, so we had to geocode names like "Winder Primary" against OpenStreetMap and reject matches in the wrong state or balancing area. Getting a confident match for 235 of 426 projects was a lot of careful filtering.
- Most plans give only an in-service year, not a construction window. We estimate the window and label it as estimated everywhere a score depends on it, instead of presenting guesses as facts.
- Distance between long transmission lines is not simple. Center-to-center distance gave misleading results, so we implemented closest-point distance between line segments and kept it consistent between TypeScript and PostGIS.
- Scoring had to be explainable. We replaced weighted percentages with four yes/no points so a planner can see exactly why a pair ranked where it did.
- Using AI without letting it make up numbers. We drew a hard line: the engine computes every number, and AI output must validate against the schema or it is rejected.
Accomplishments that we're proud of
- Everything runs on real, public utility plans, and every project links back to its source document.
- The sponsor's Georgia Power / Dominion Energy South Carolina example is found by the engine from the data, not hard-coded.
- The score is a whole number from 0 to 4 that anyone can check by hand.
- The impact estimate is sourced and honest about its assumptions.
- A four-person team with backgrounds in electrical engineering, cybersecurity and computer science shipped a working, deployed product in one weekend, with tests guarding the engine and the data.
What we learned
- How utility transmission planning works: IRPs, regional plans like SERTP, in-service dates, and why FERC Order 1920 exists.
- That the hardest part of working with public infrastructure data is location and timing, not the math.
- How to use PostGIS for real geographic queries instead of approximating in application code.
- That being explicit about what is estimated or missing makes a tool more trustworthy, not less.
What's next for GridSync
- Extend the impact scenario from the Winder pair to every high-scoring pair.
- Replace the generic staging-yard acreage with project-specific data from the utilities.
- Add more regions and refresh automatically when new plan filings are published.
Built With
- deck.gl
- elevenlabs
- google-gemini
- maplibre
- next.js
- openstreetmap
- overpass-api
- pandas
- postgis
- postgresql
- pypdf
- python
- react
- tailwind-css
- tiger-data
- typescript
- zod


Log in or sign up for Devpost to join the conversation.