
Inspiration
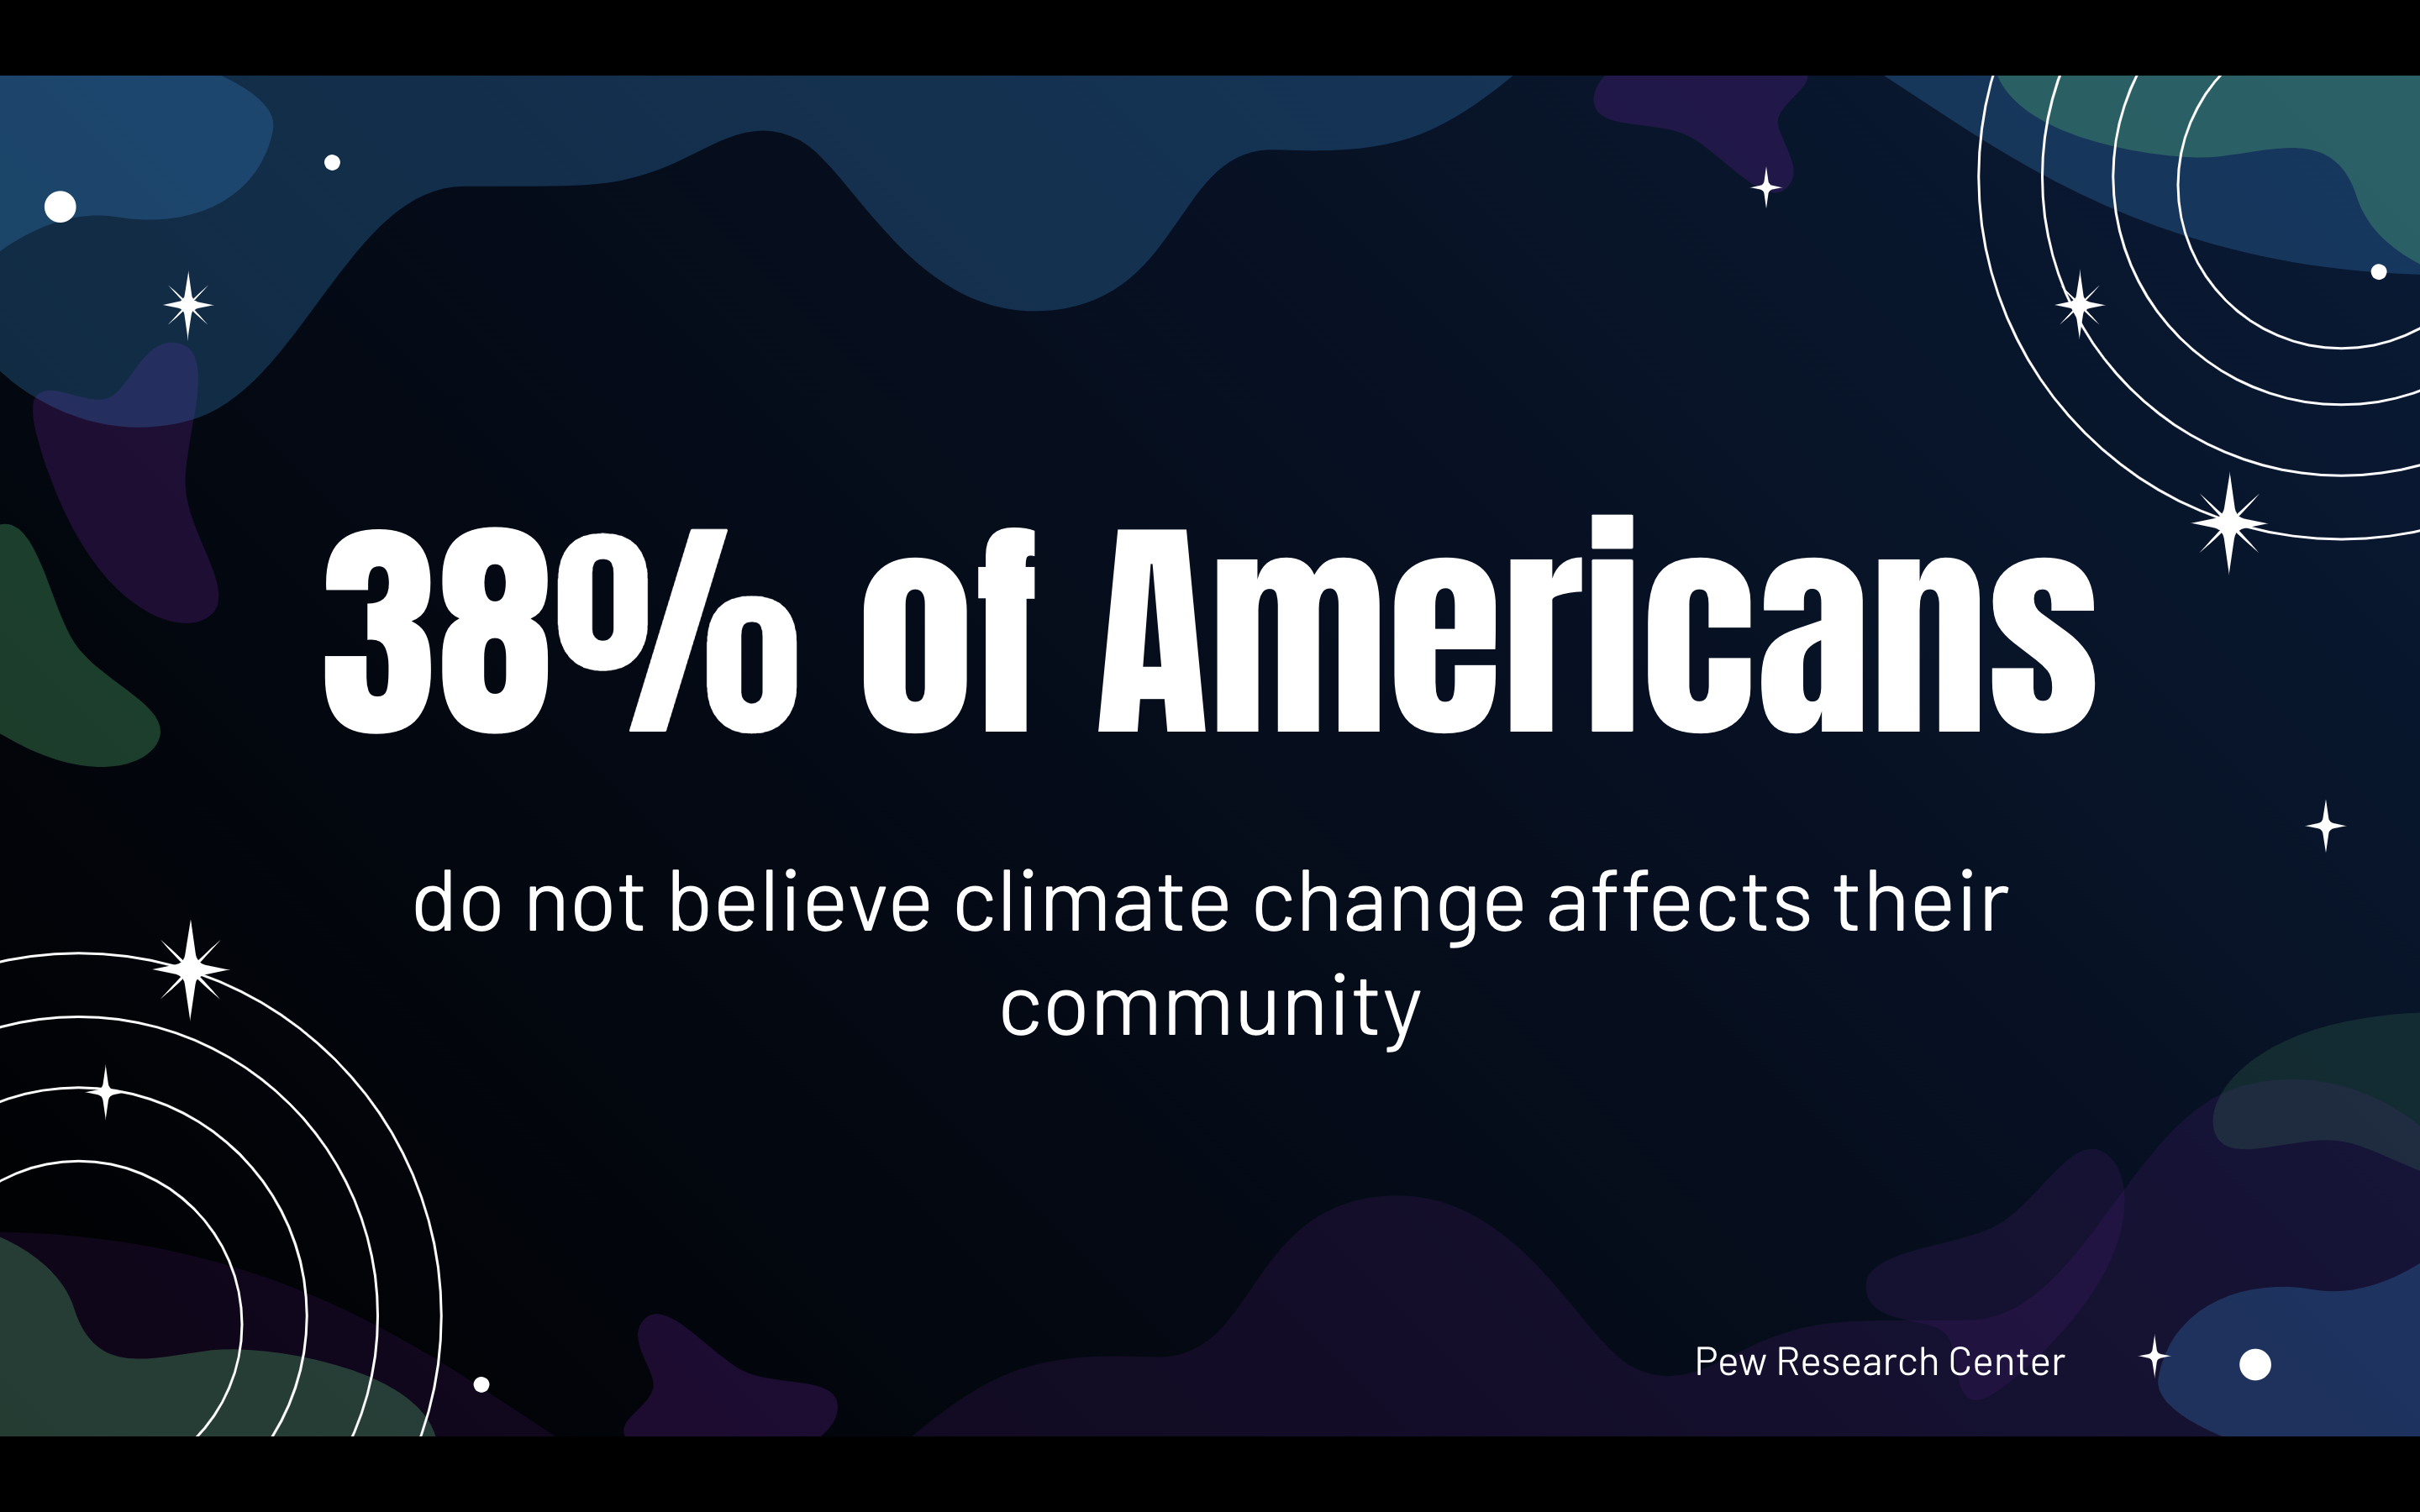
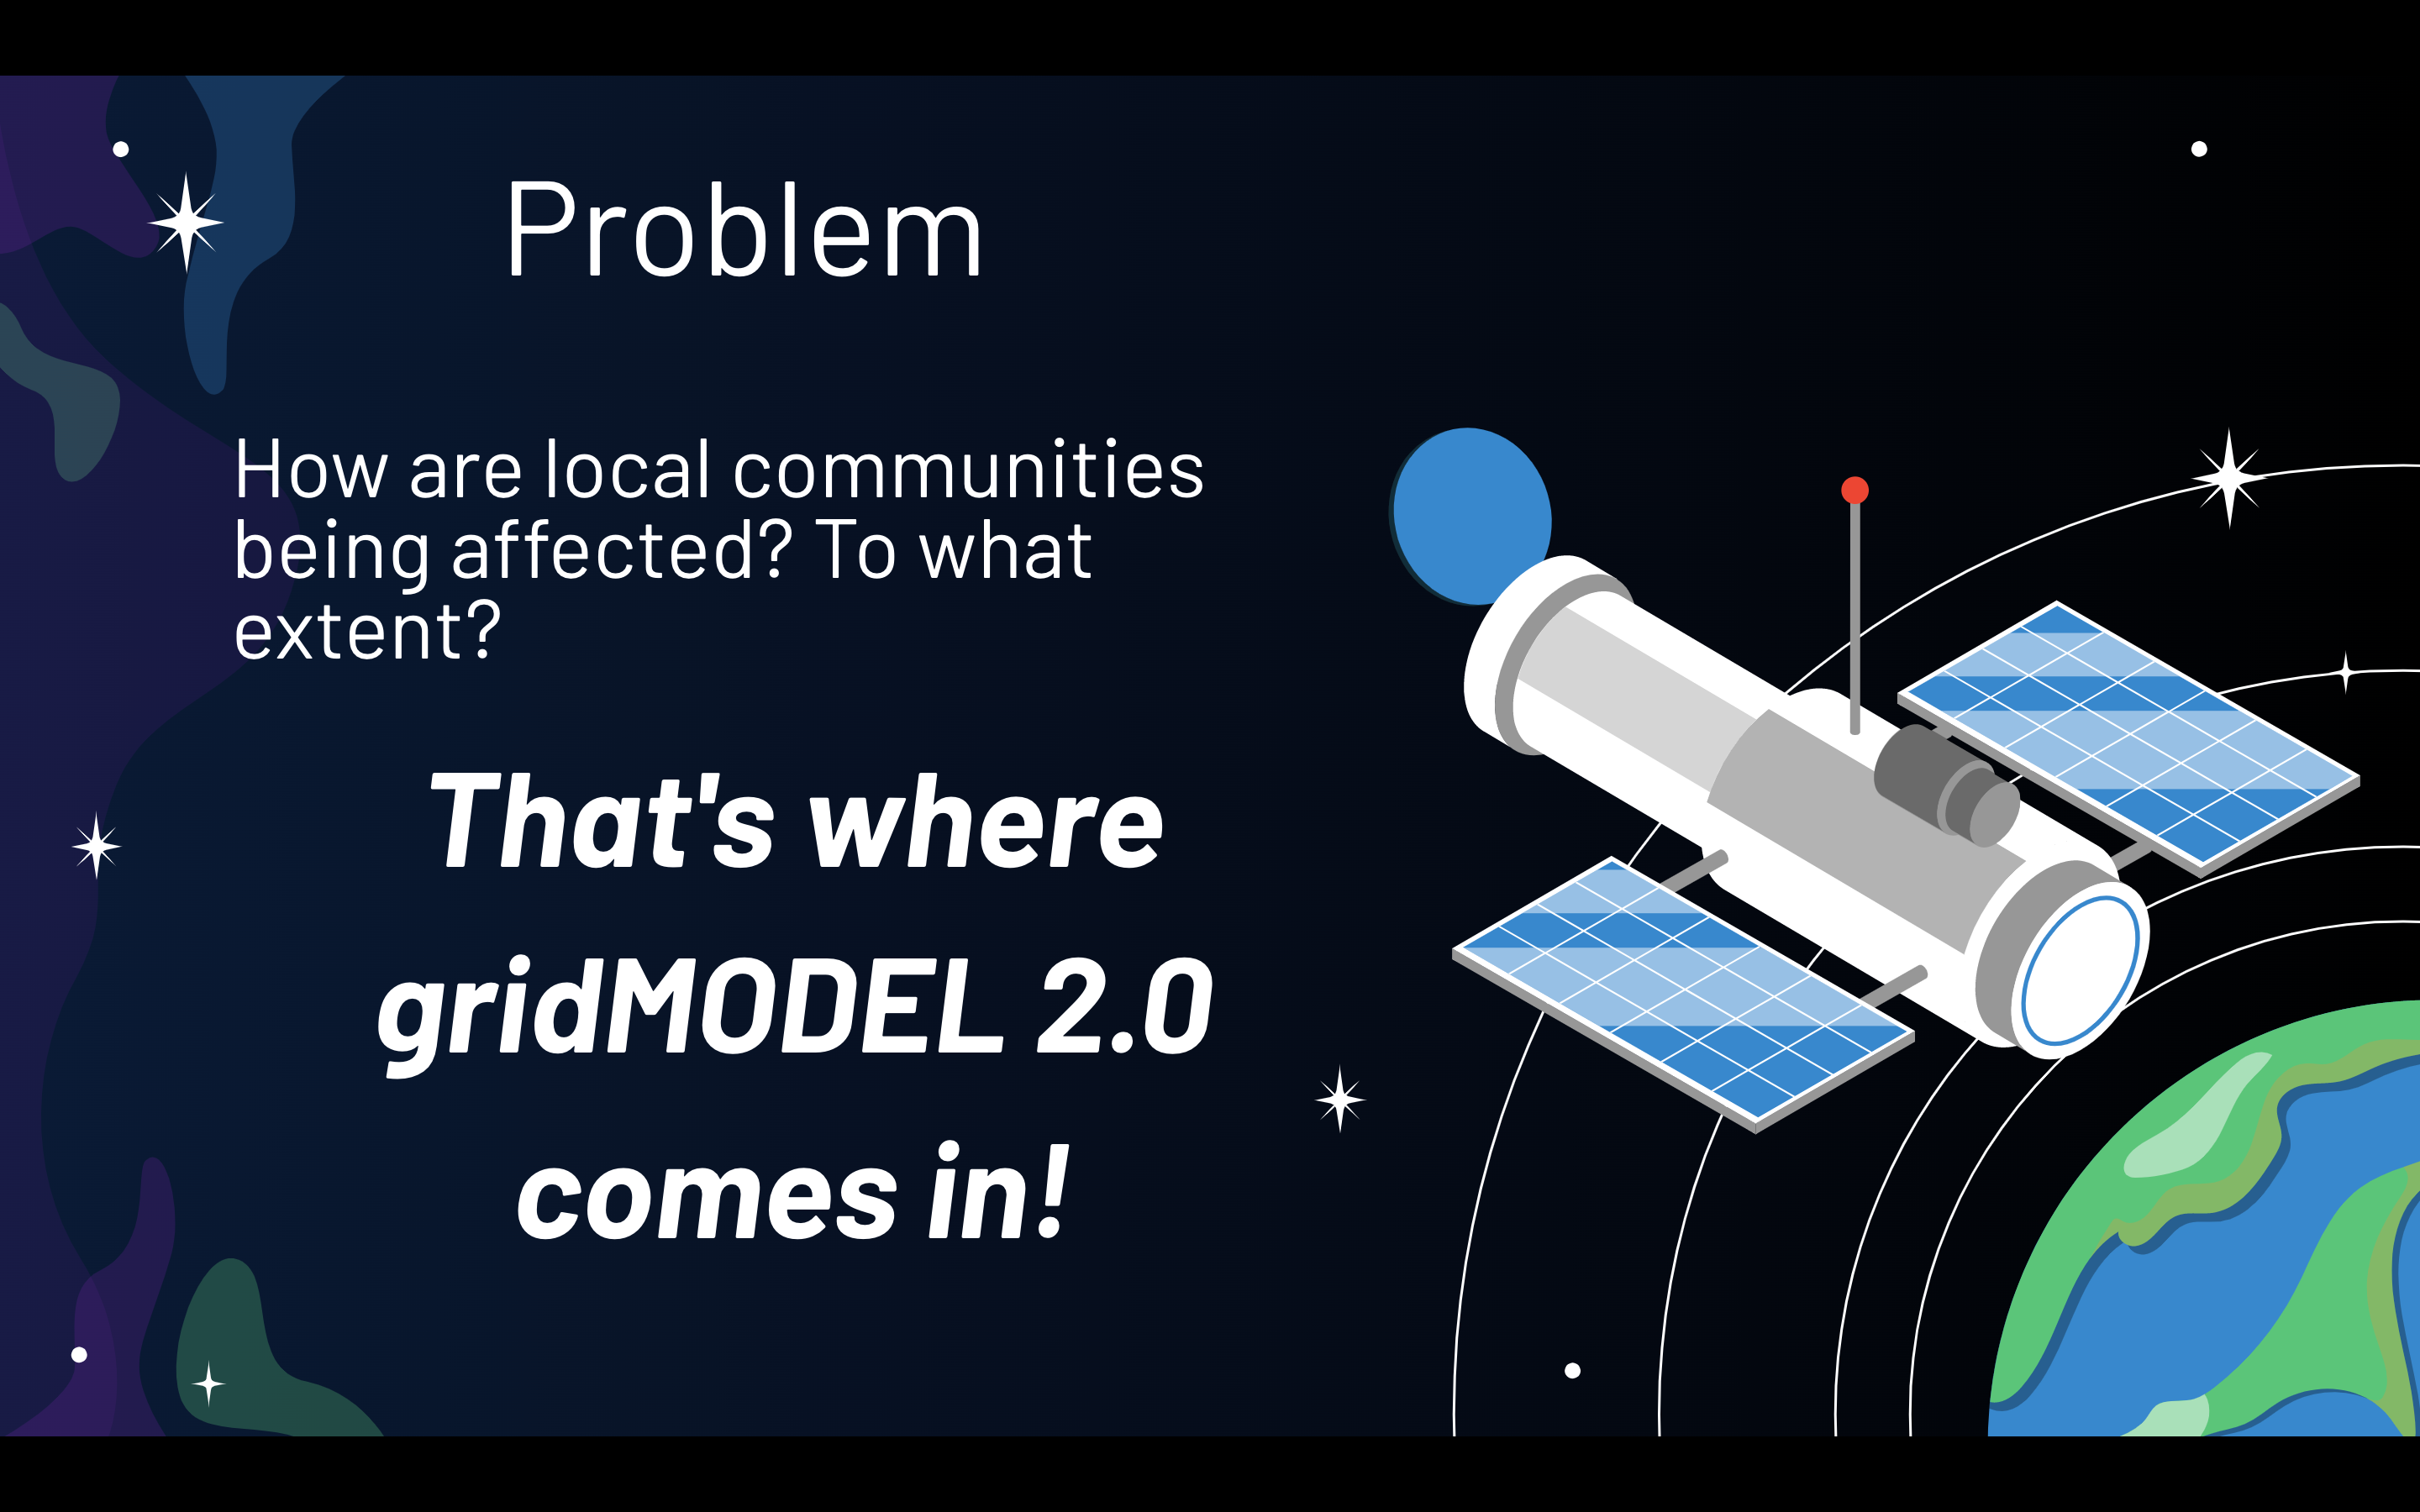
Climate change is becoming an increasingly prevalent issue in our society today, but many people often do not have ways of easily accessing some indicators of climate change. In order to combat this global issue, every citizen needs to be informed of how their local community is being affected and, consequently, what they can do about it. That's where gridMODEL 2.0 comes in!
What it does
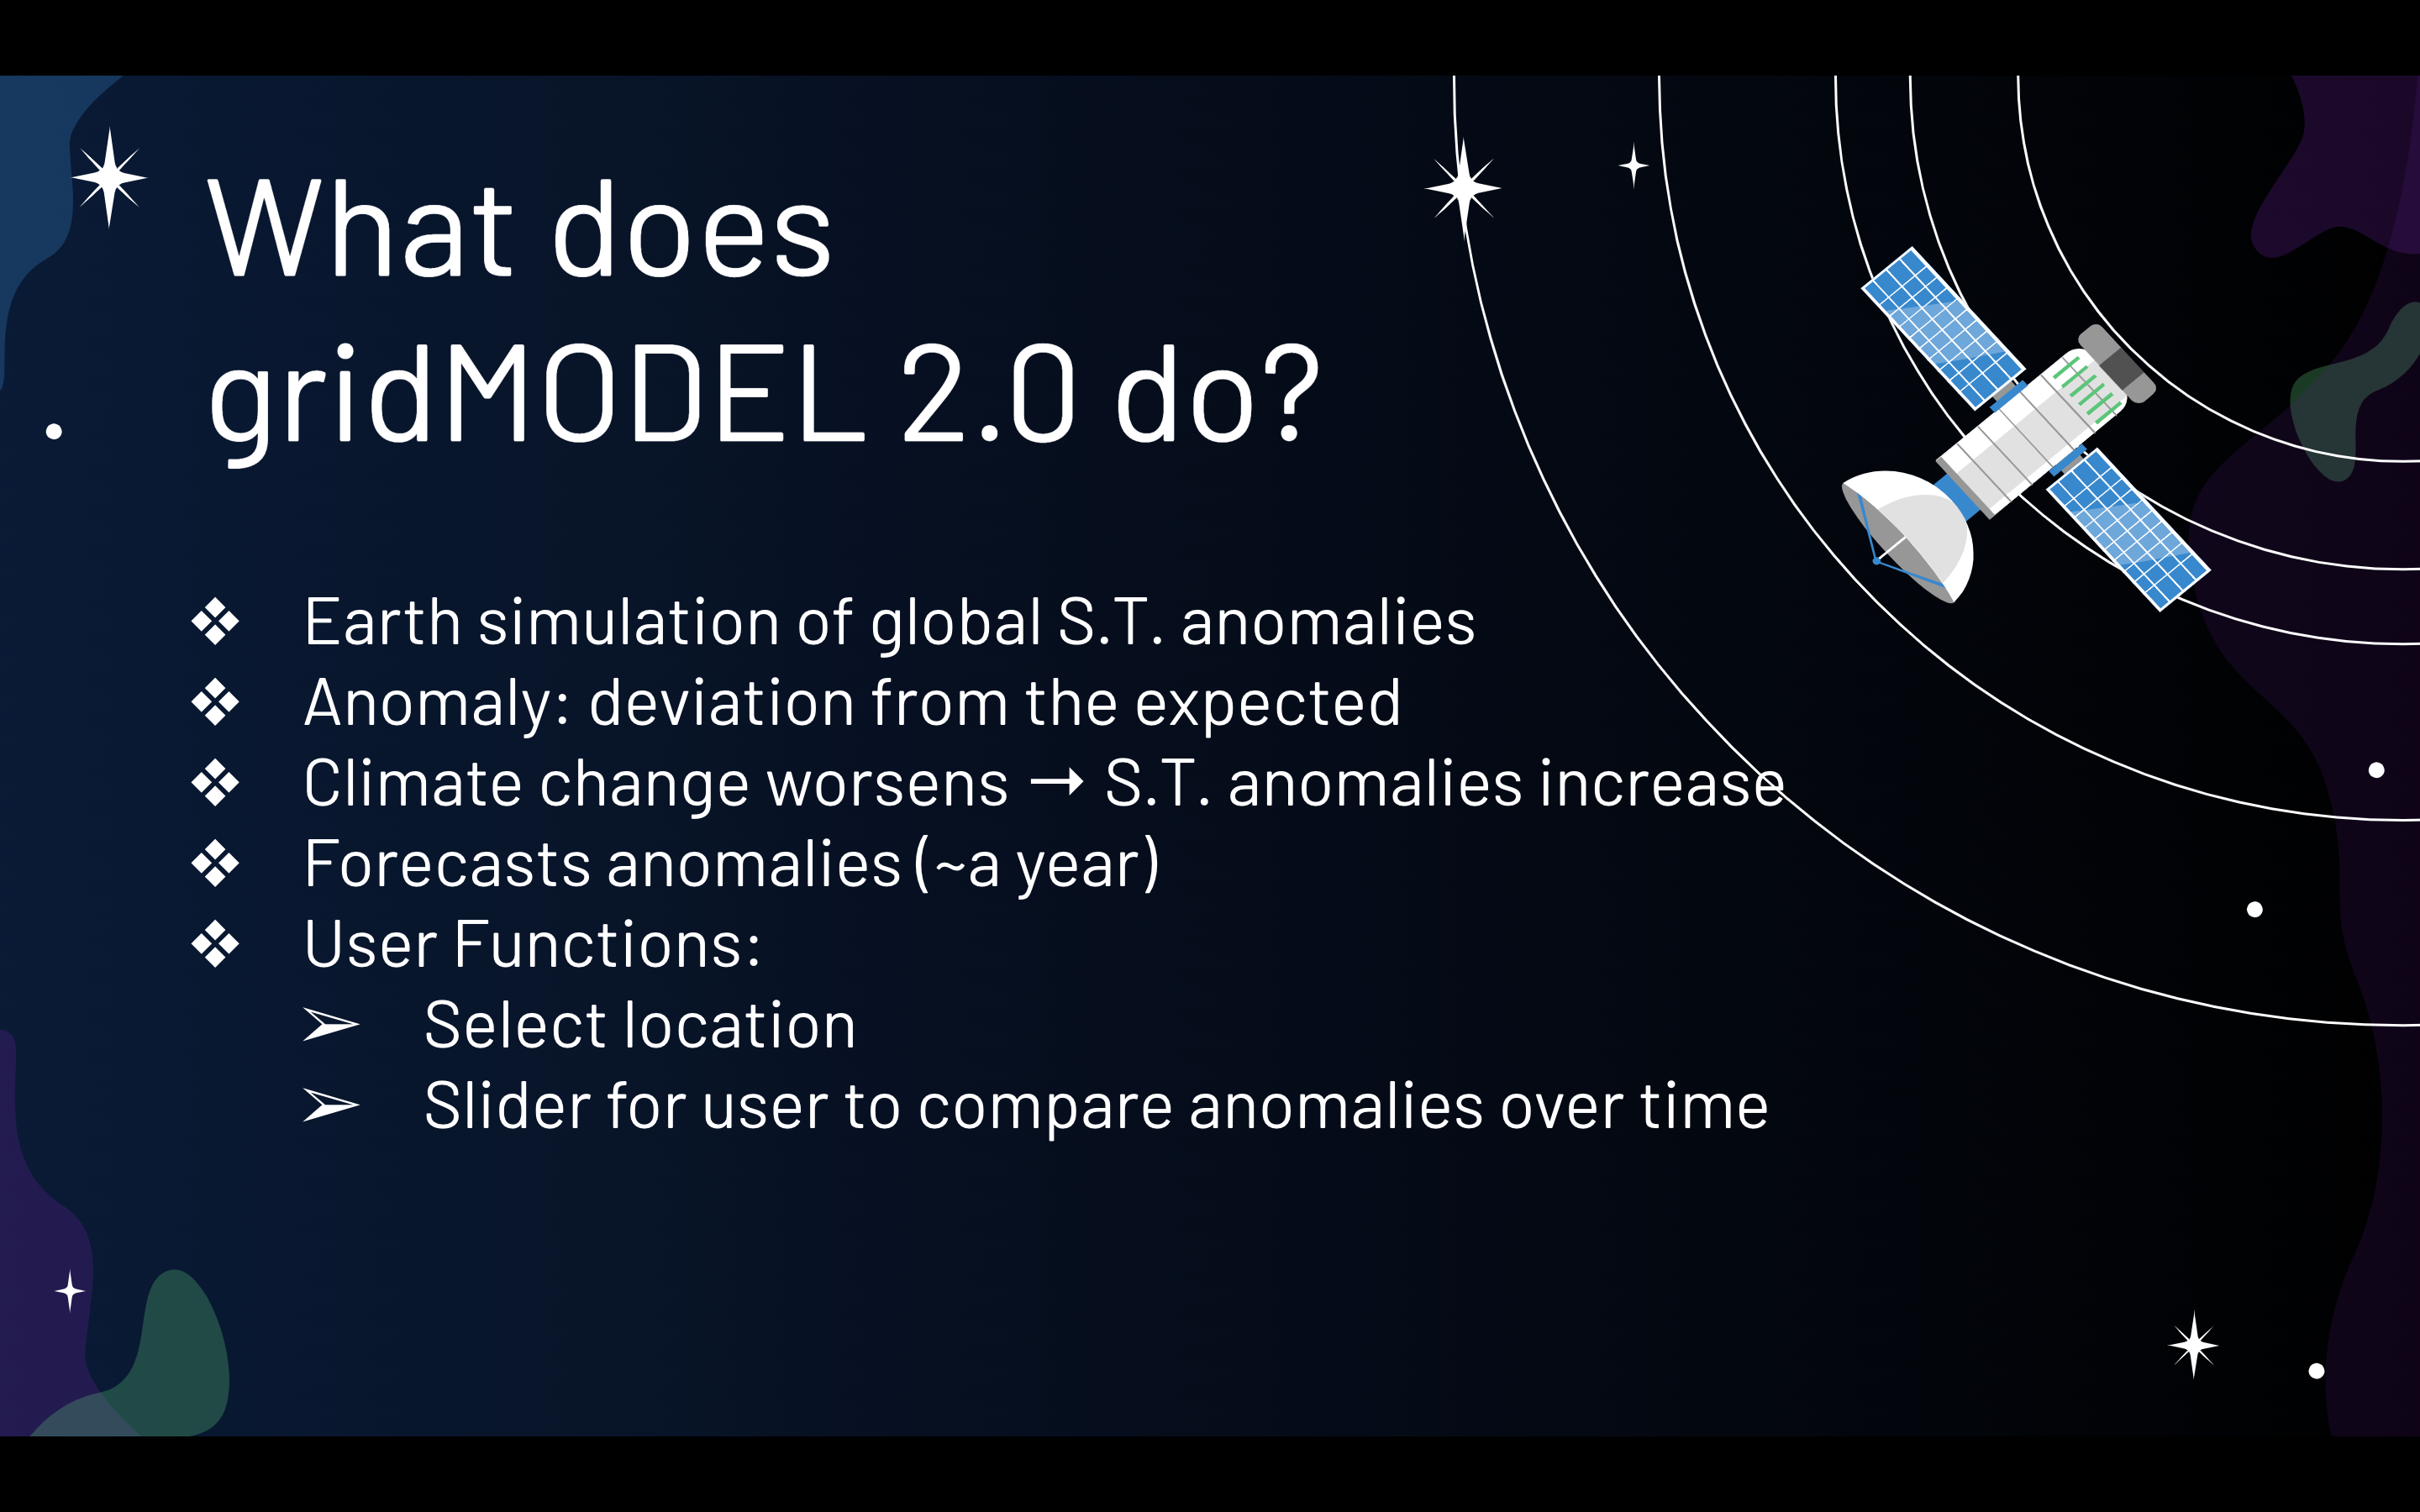
gridMODEL 2.0 is a website that contains a stimulation of Earth showing anomalies in global surface temperature. An anomaly is a deviation from the expected surface temperature. It is predicted that as climate change becomes more severe, surface temperature anomalies will increase as surface temperatures are often increased via global warming. gridMODEL 2.0 is a forecasting stimulation, meaning it can forecast anomalies approximately a year ahead of time. In addition, a user can select a location to determine the surface temperature anomaly values.
How we built it
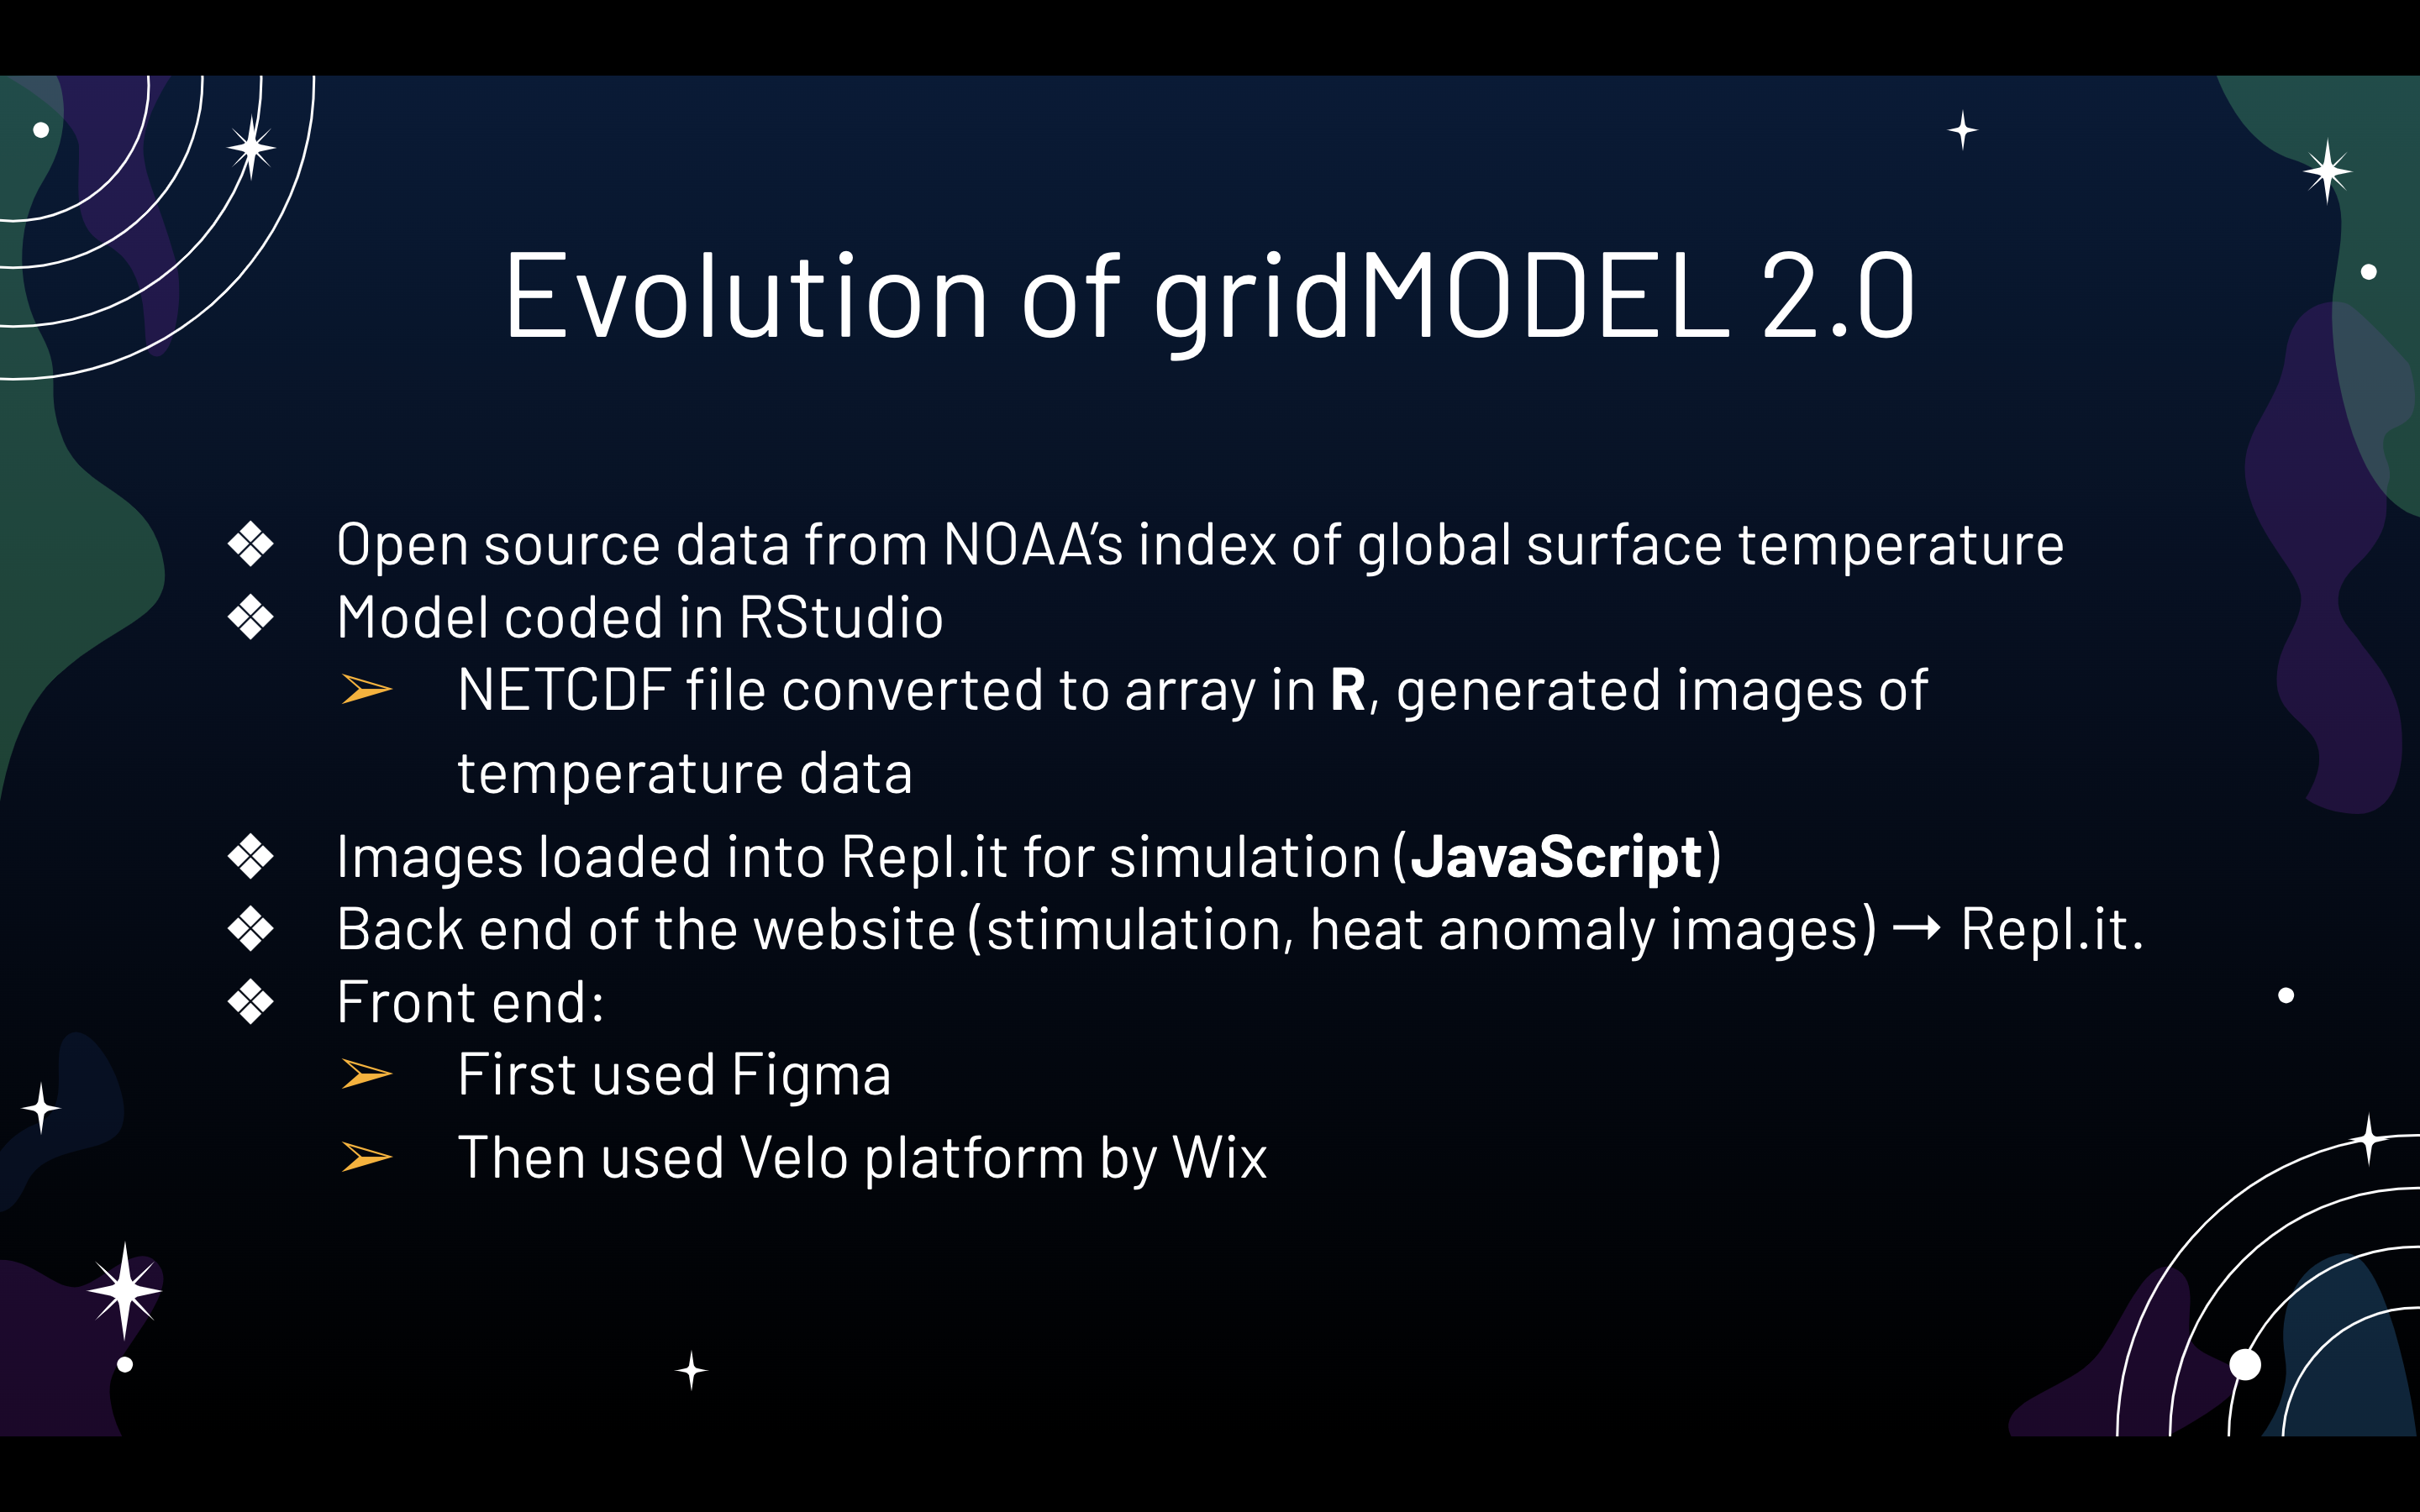
gridMODEL 2.0 was built via multiple programming avenues. The model itself was built off open source data from the National Oceanic and Atmospheric Administration's index of global surface temperature. The model was coded in RStudio. Since the source data was in a NETCDF file it was converted to an array in R, from which images of temperature data were generated. These images were then loaded into Repl.it to be loaded into the simulation, which was written in JavaScript. The back end of the website, which contained the stimulation itself with the heat anomaly images overlaid on it, was written in Repl.it. The front end of the website was made using several platforms. First, we used Figma and an associated plugin to convert it to HTML. Then, we decided to try and use the Velo platform by Wix to create the front end.
Challenges we ran into
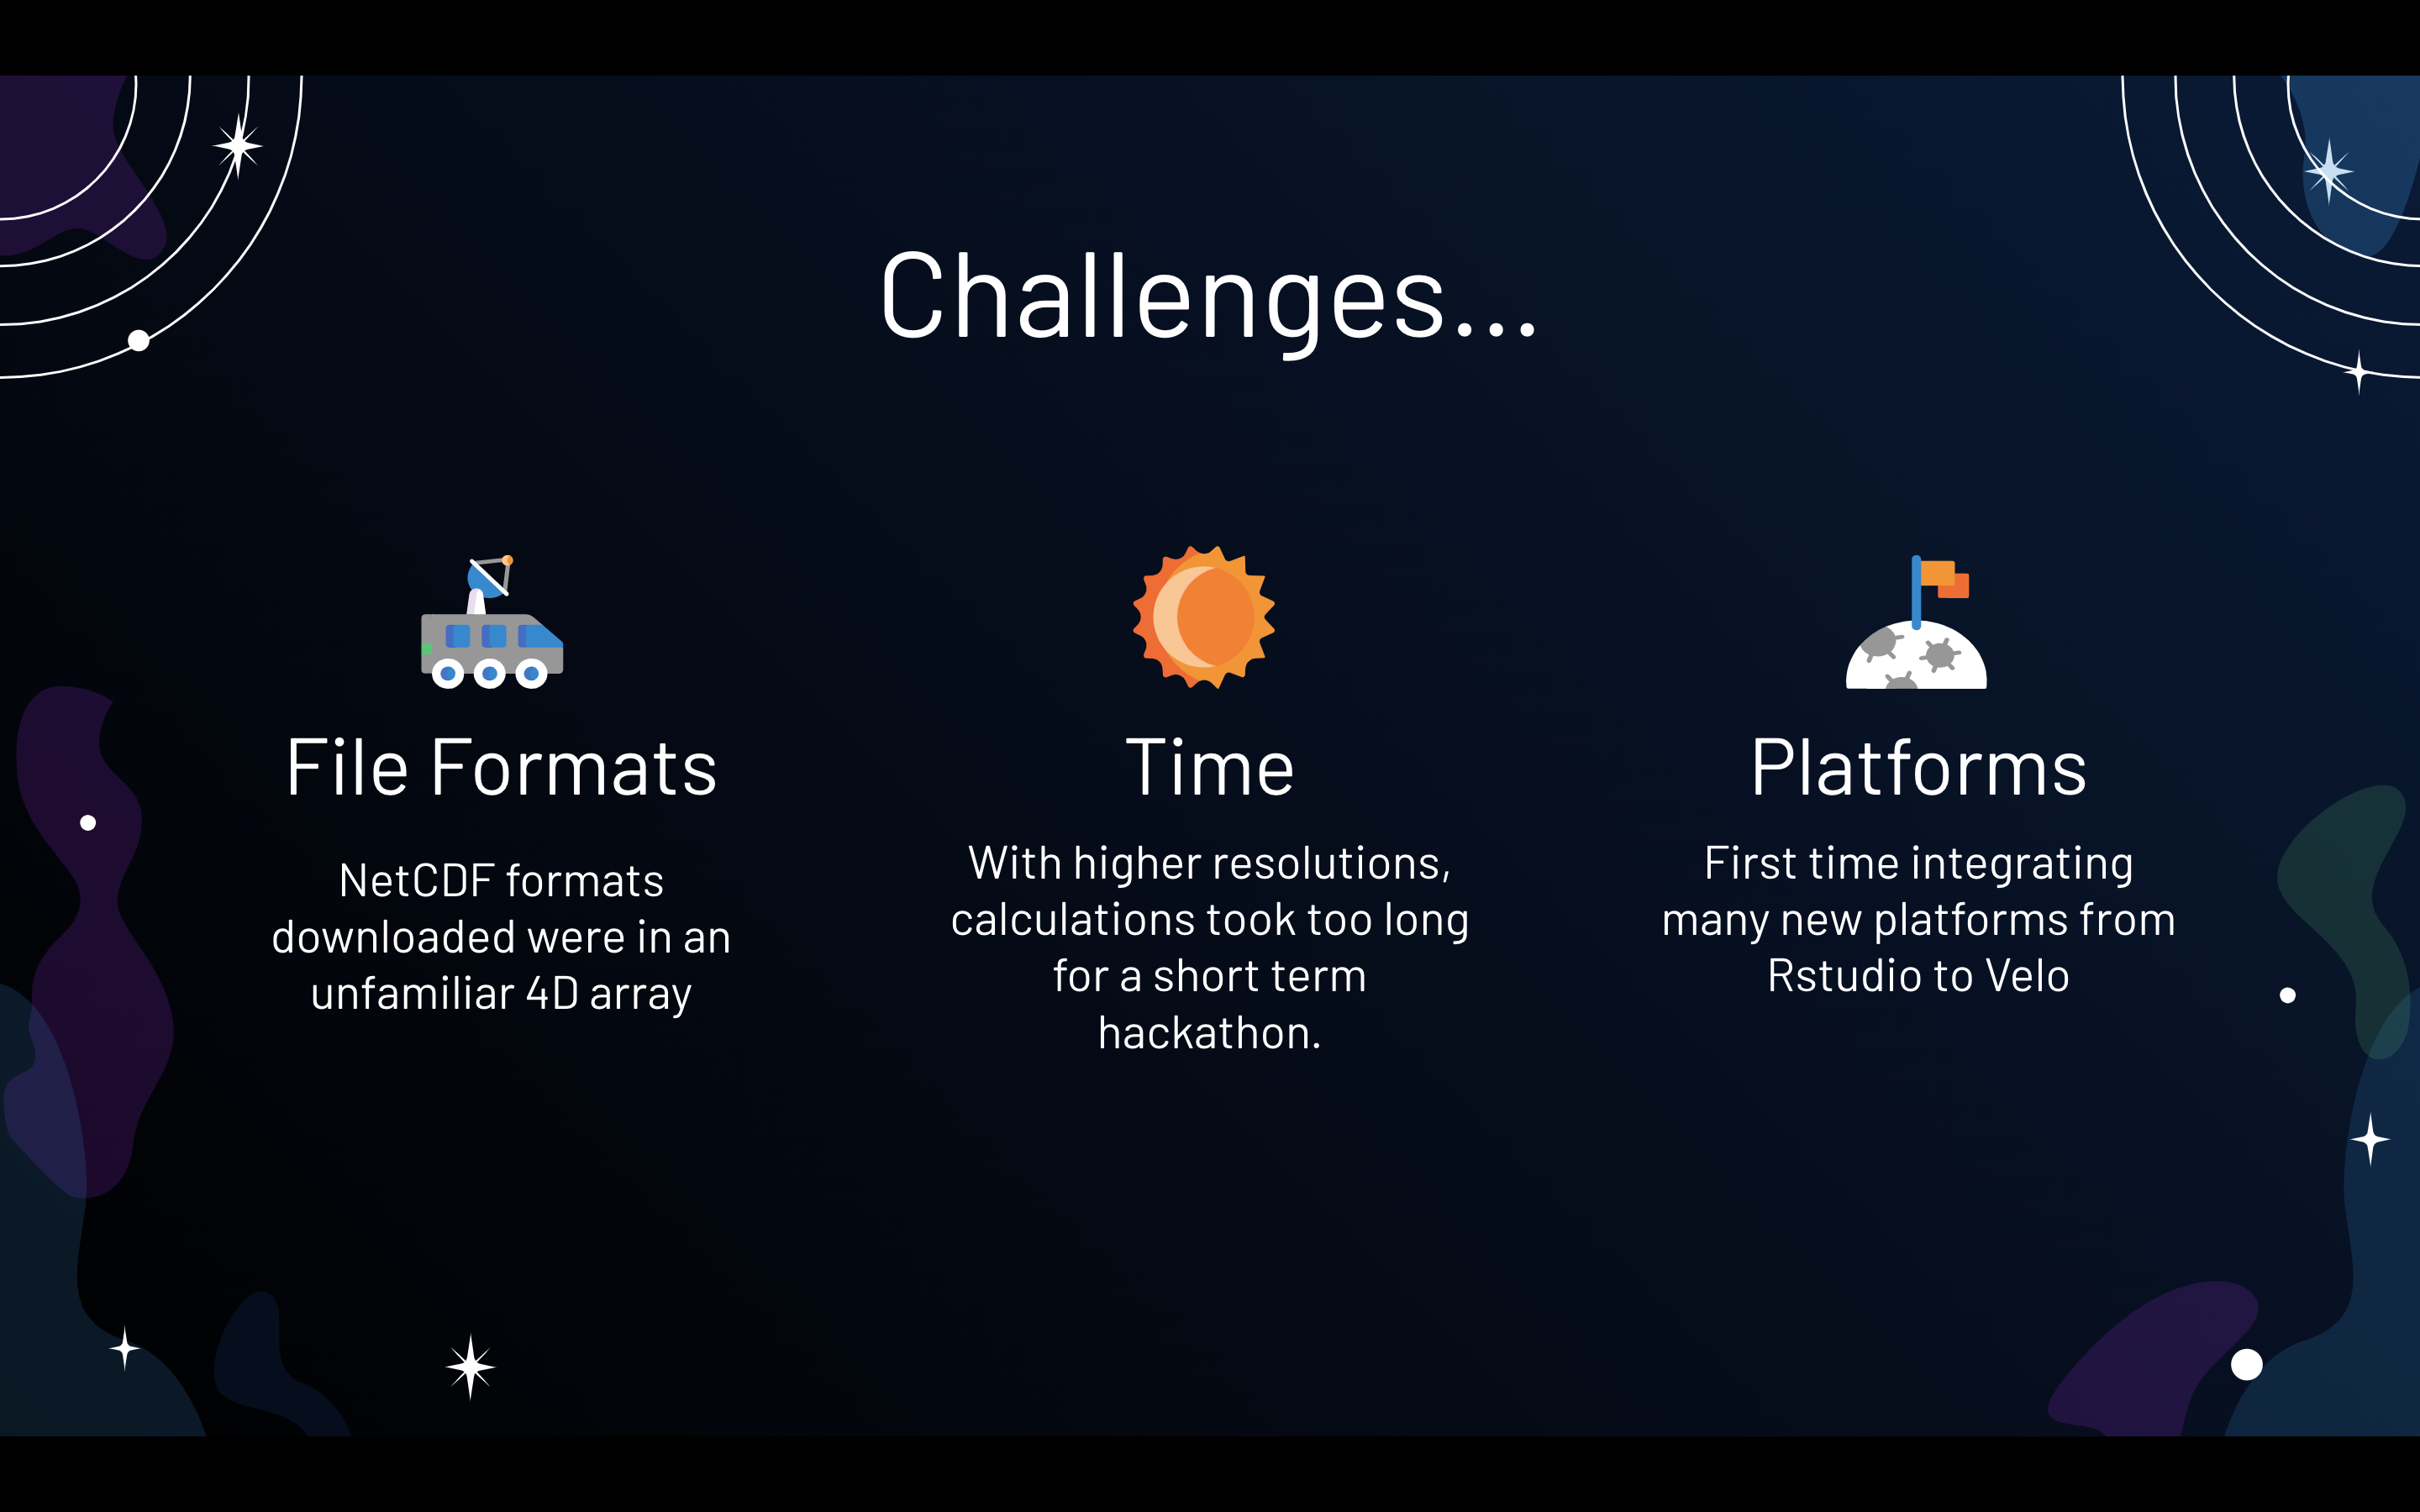
Some challenges we ran into was creating the model itself. Converting the NETCDF file into a format that could easily be analyzed proved harder than we thought it would. In addition, we had to change the layout of our model several times, thinking of options ranging from greybody model approximations for total earth temperature based on fluctuations in albedo and greenhouse gases to forecasting temperature on past data. We also had to repeat the analysis for different lattitudes by manually changing the location, as we couldn't find a way to automate it, but this did not change accuracy.
Accomplishments that we're proud of
We're really proud that we stuck with our idea. There were definitely times where we were thinking about completely starting over, but we stood by our ideas and thought of clever workarounds instead. In the end, our goal was not only to create a complete product, but to learn some new skills.
What we learned
Our team learned a variety of skills while doing our project. We learned how to take earth science data and overlay it onto a global simulation. In addition, we realized the importance of integrating different platforms to achieve our goal. Finally, we learned how to persevere :)
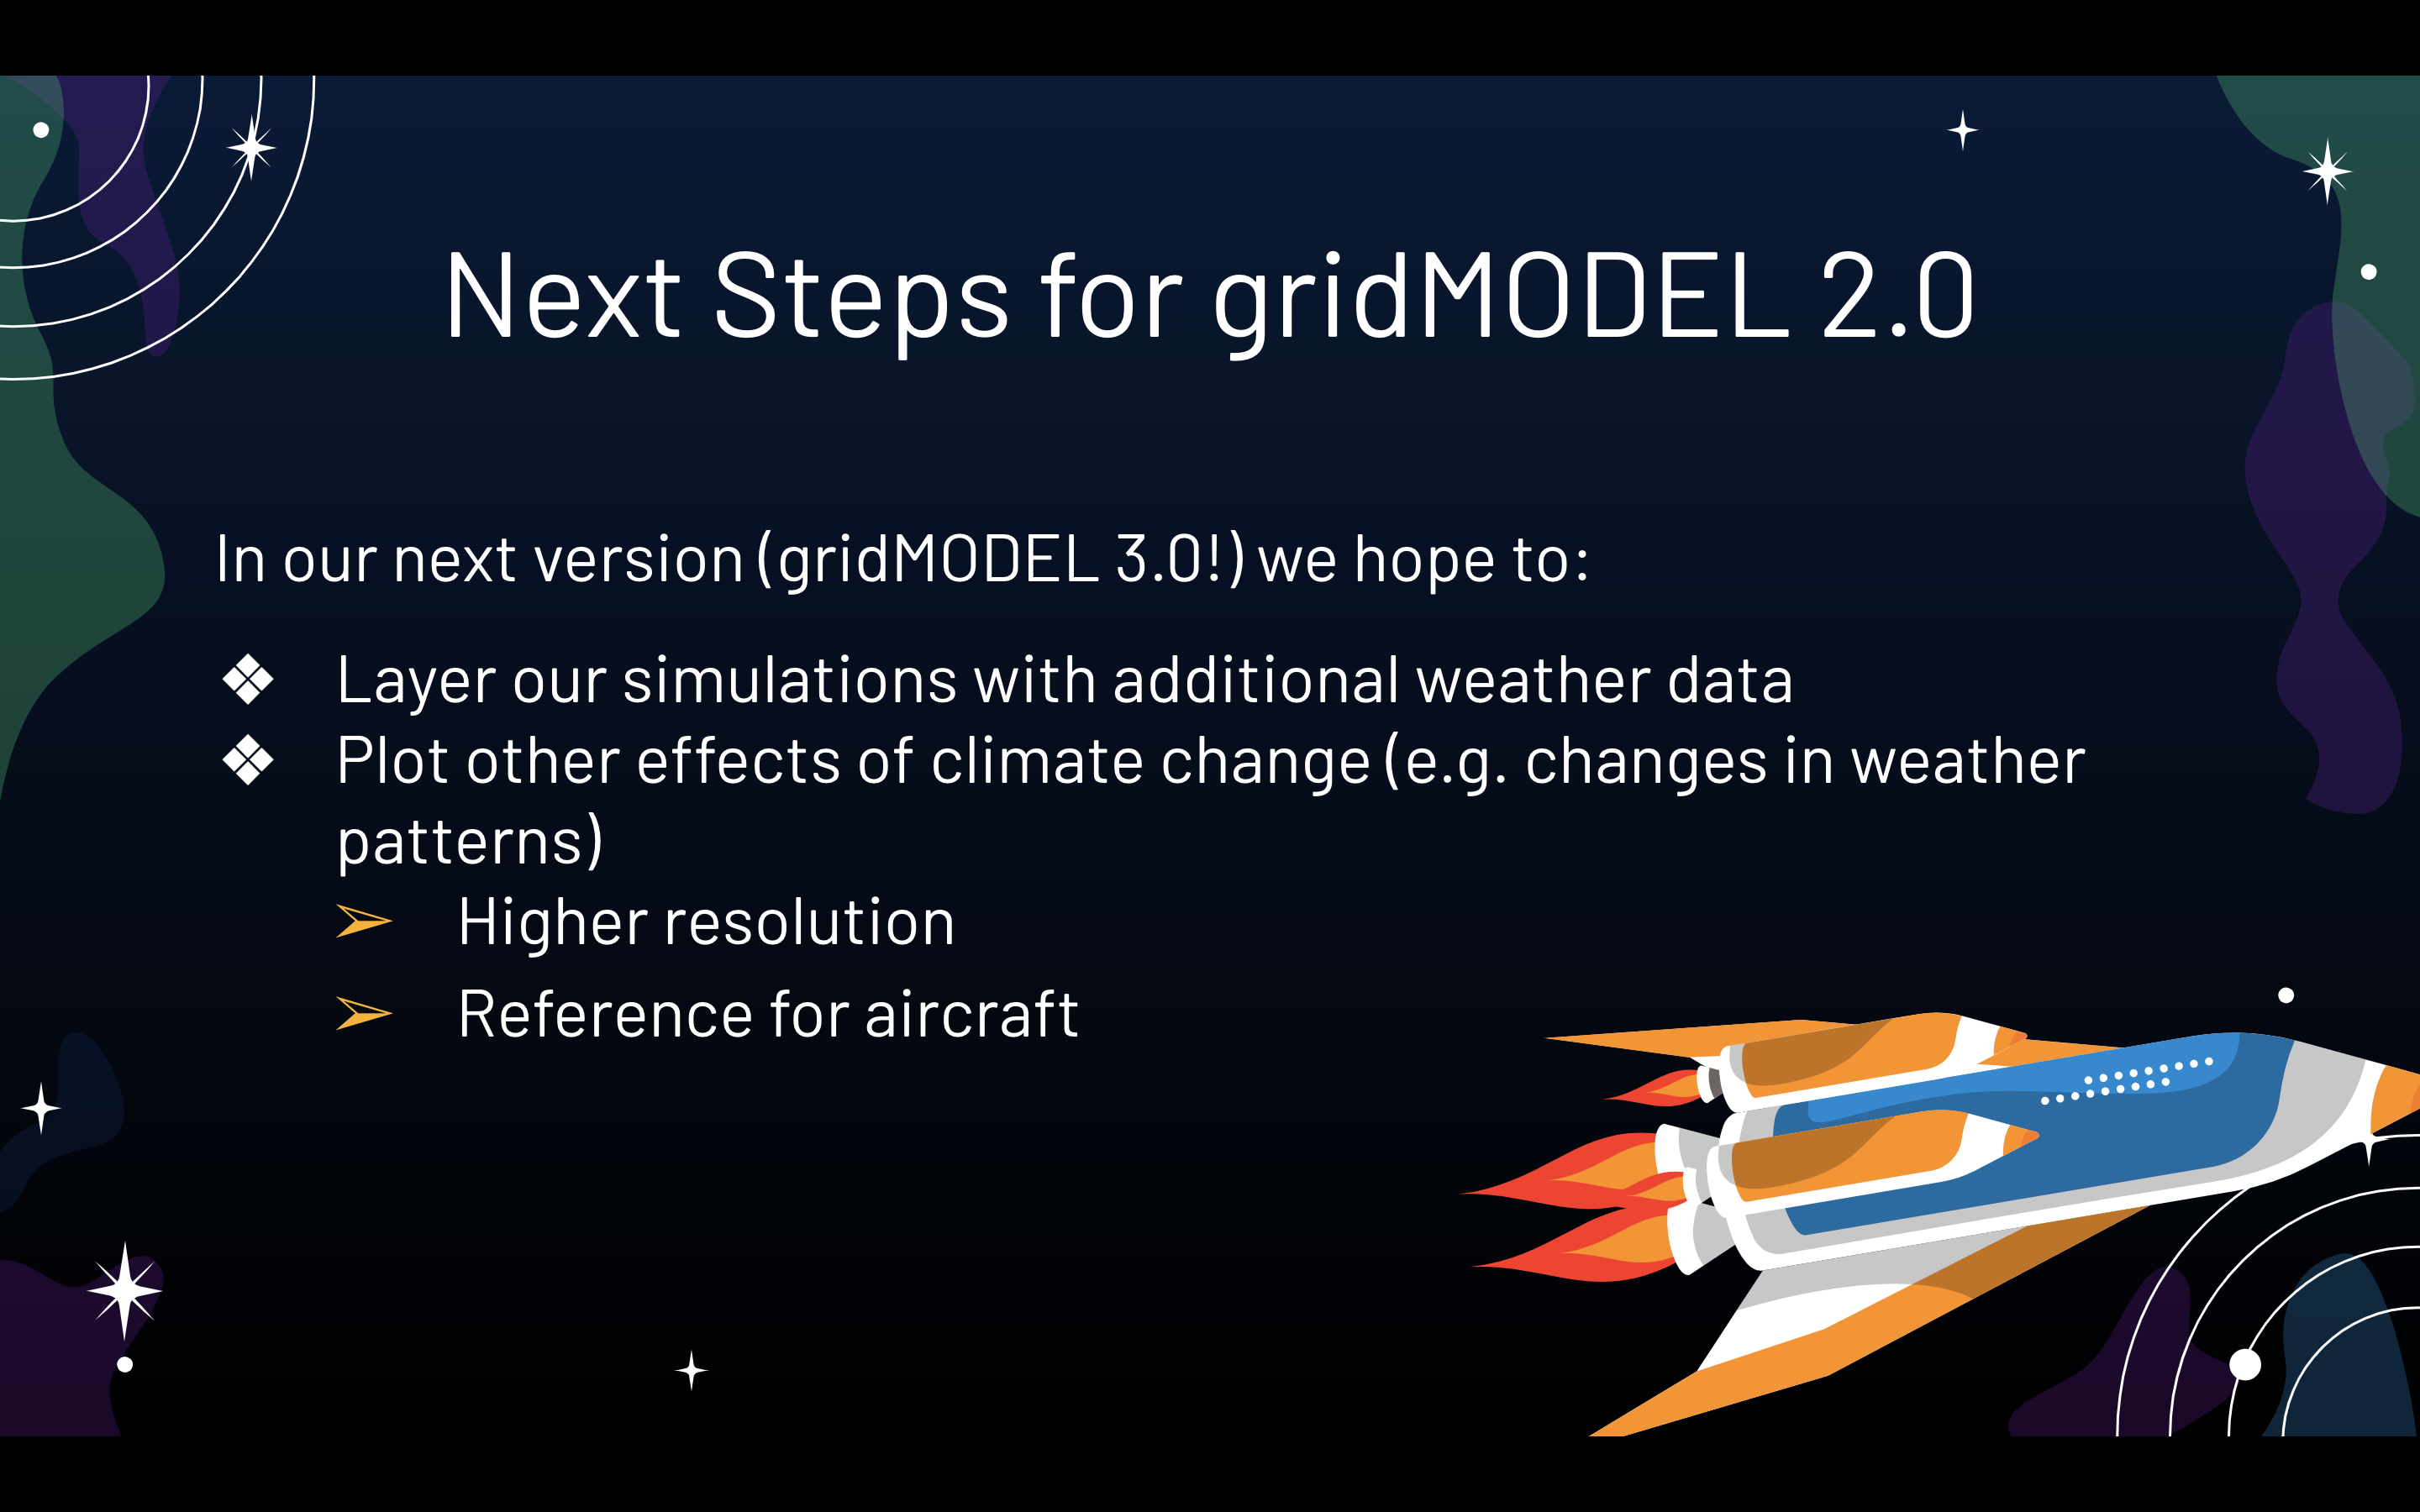
What's next for gridMODEL 2.0
In our next version (gridMODEL 3.0!) we hope to layer our stimulations with additional weather data. Along with anomalies, we can plot other factors of climate change such as changes in weather patterns. These changes have a variety of applications, ranging from more thorough weather modeling which would have applications beyond climate modeling to things like planes, as weather patterns such as wind are especially important for pilots to remain updated about.
Built With
- figma
- javascript
- noaa-climate-data-online
- r
- repl
- velo
- wix

Log in or sign up for Devpost to join the conversation.