-
-
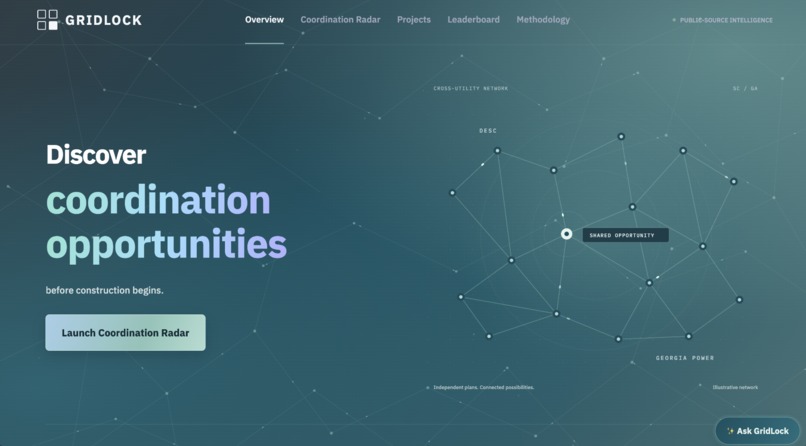
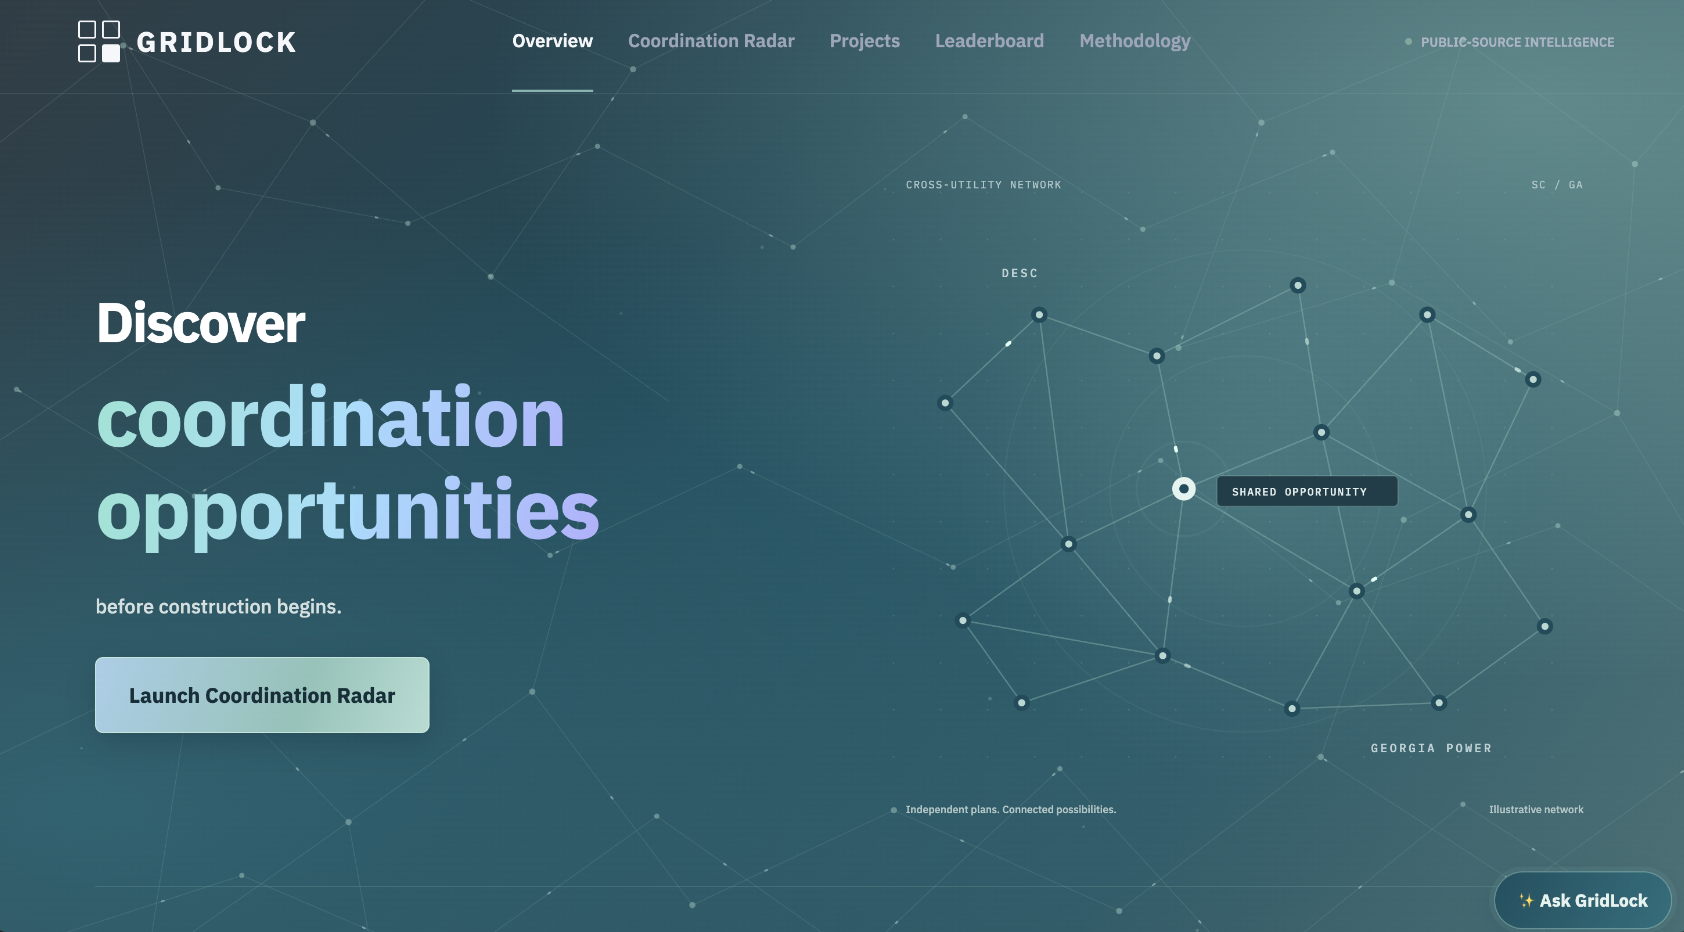
Landing page
-
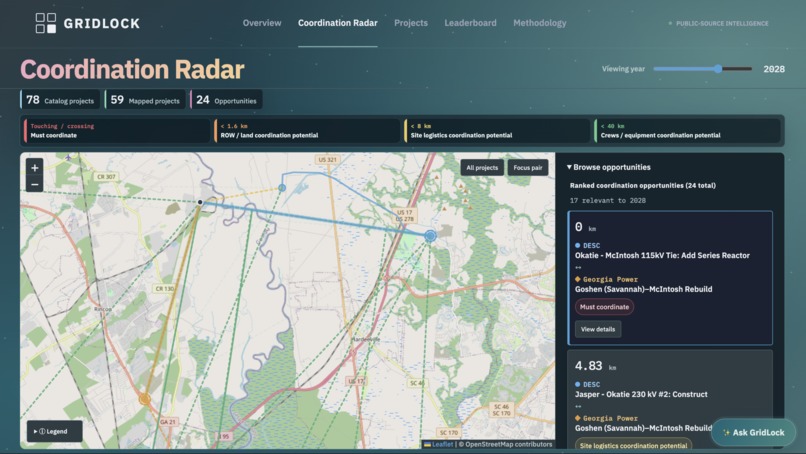
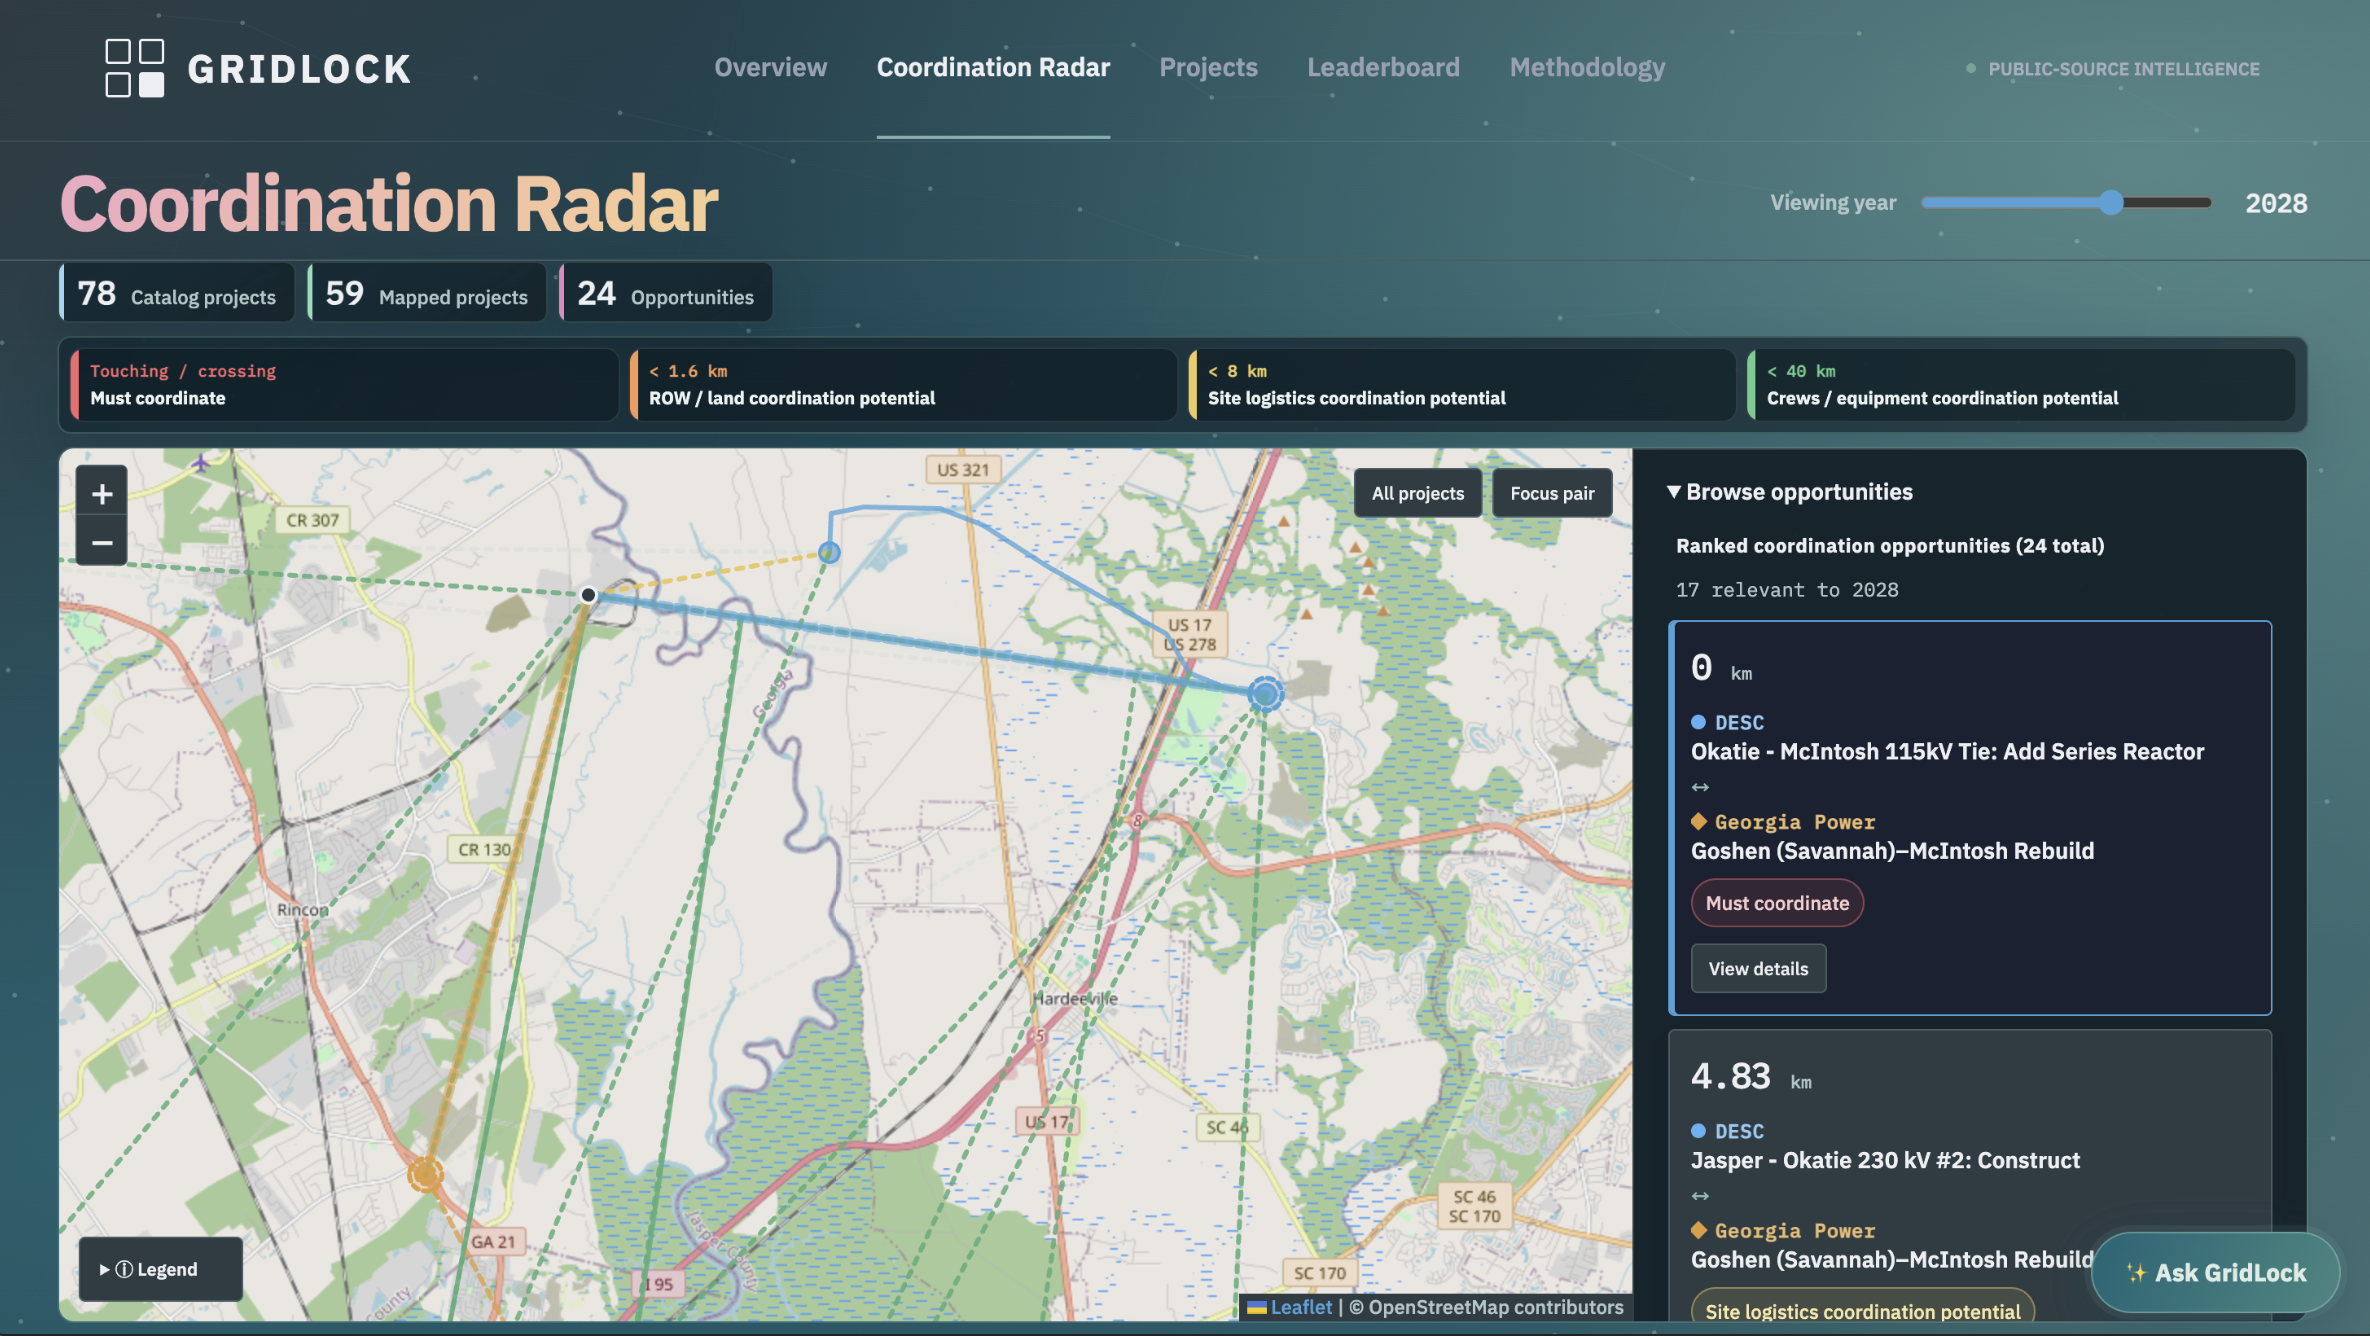
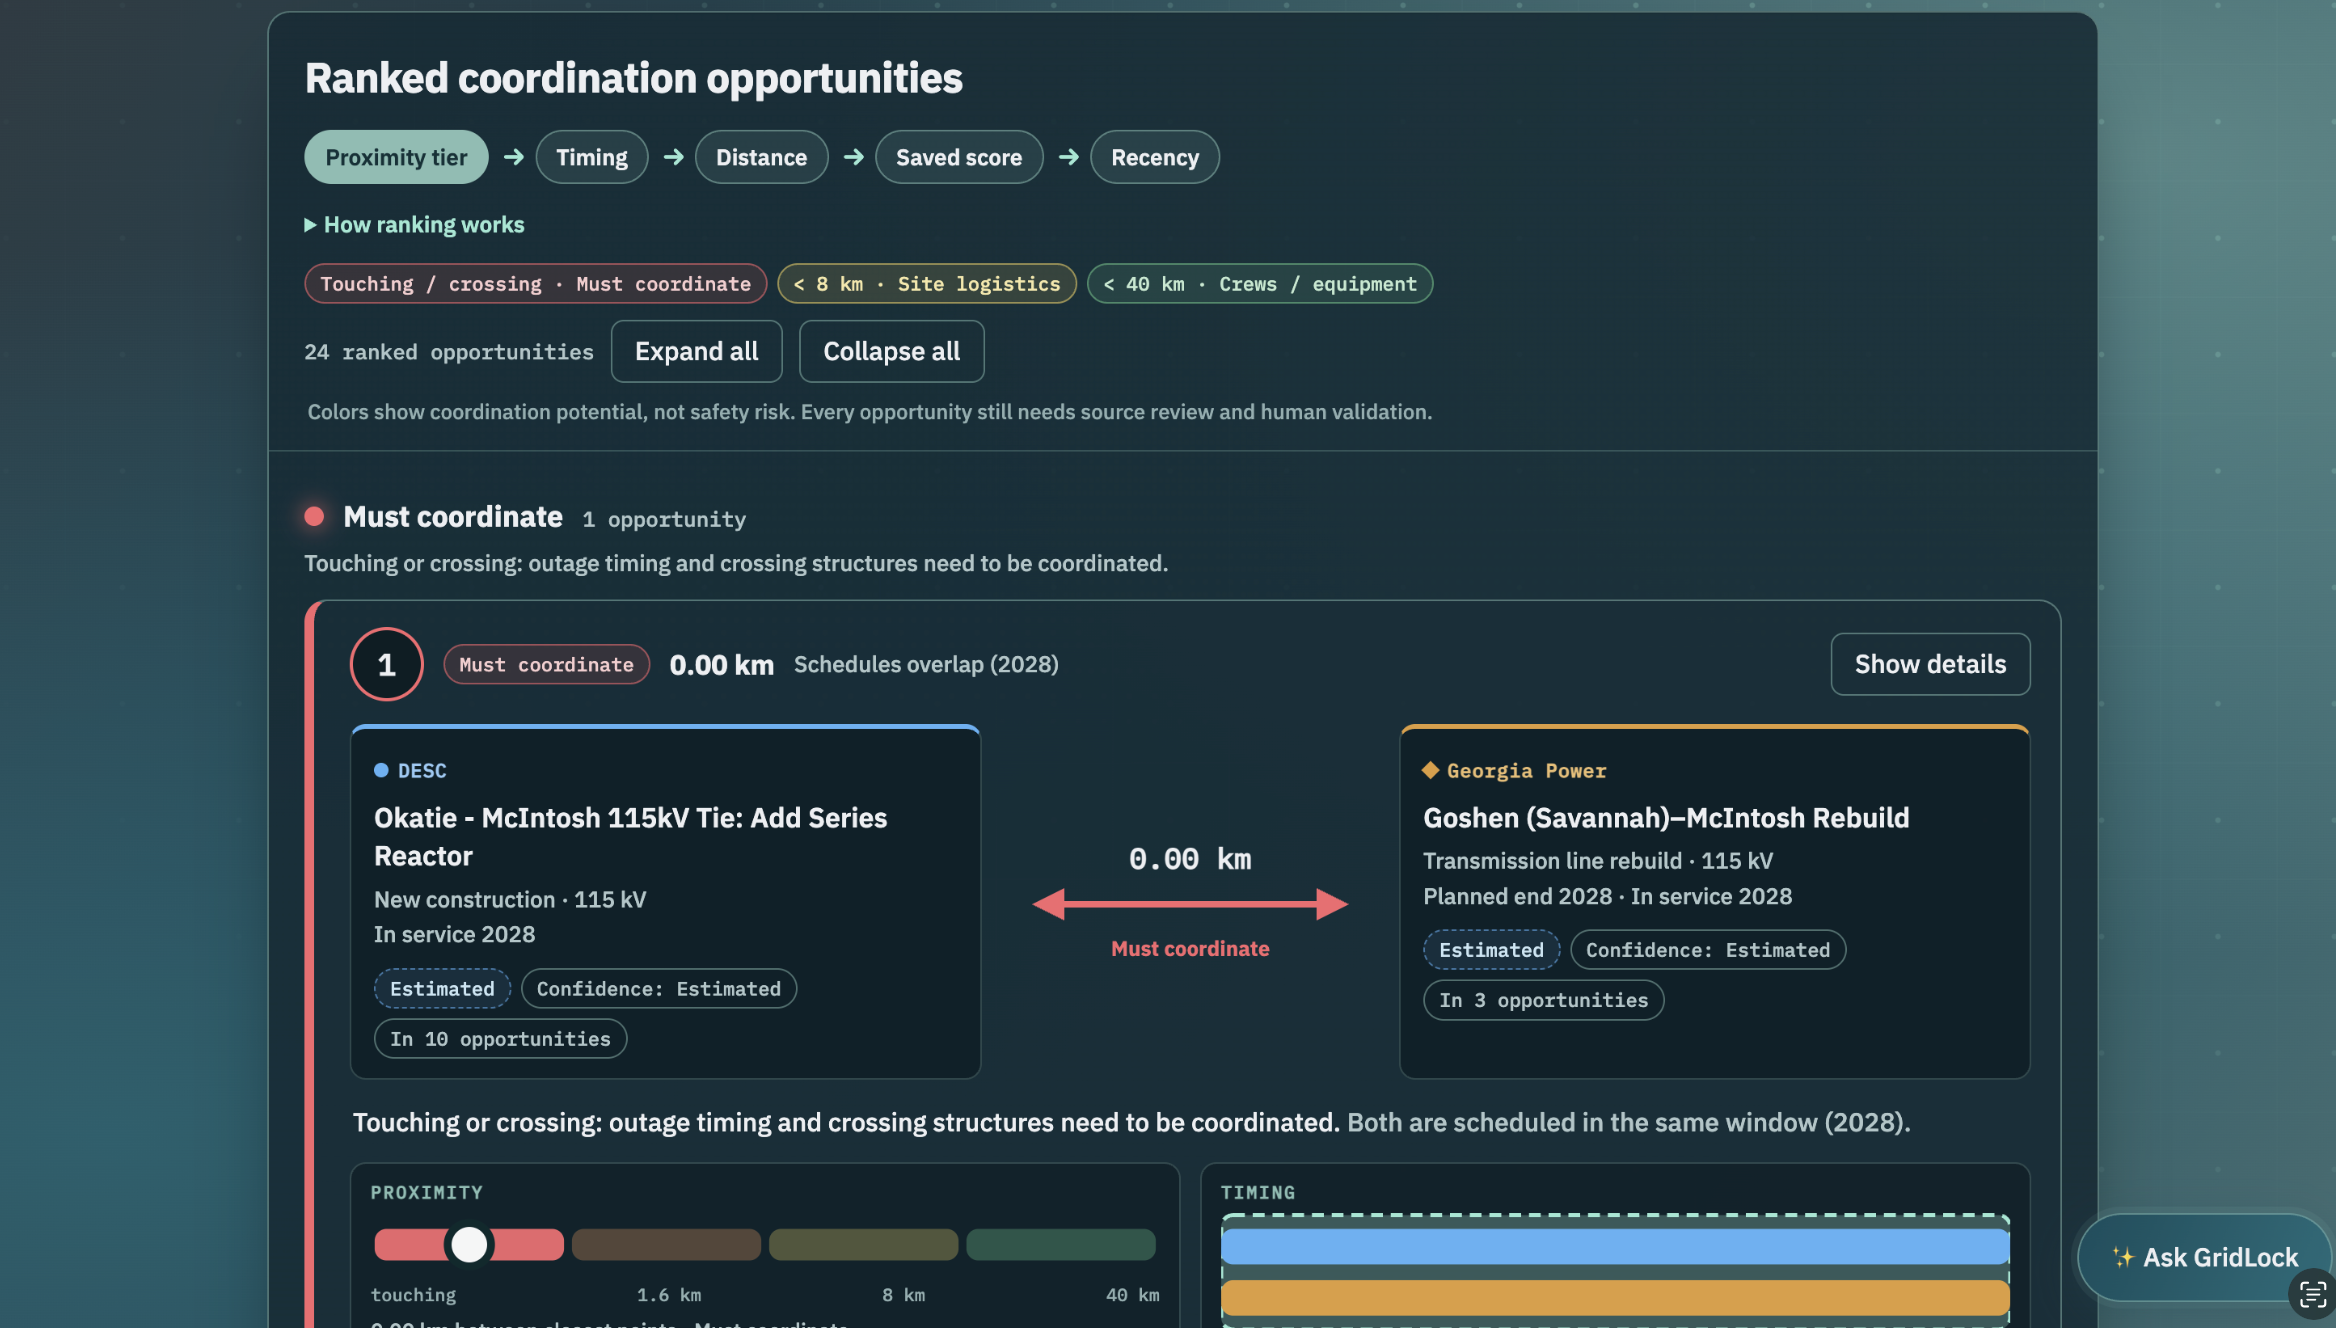
Coordination Radar
-
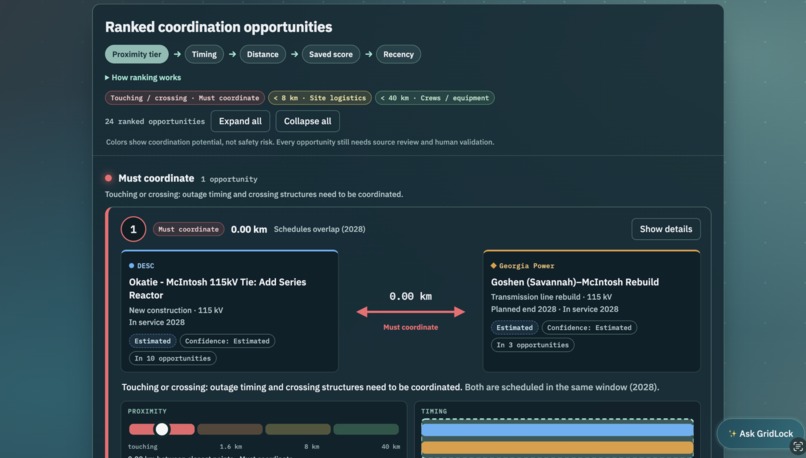
Leaderboard
-
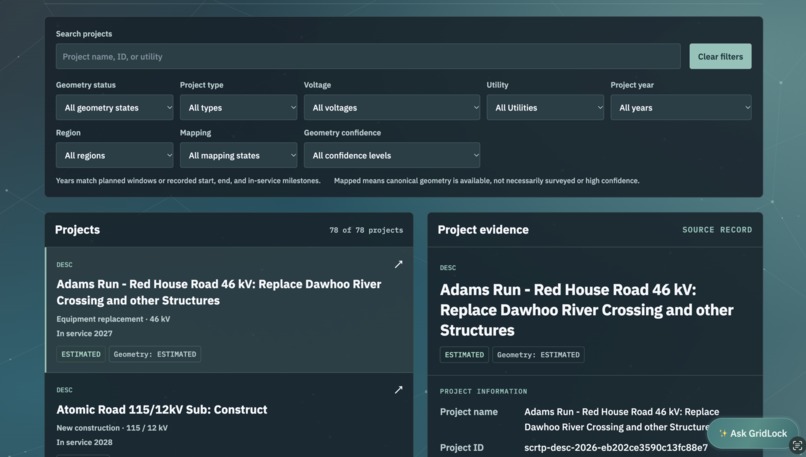
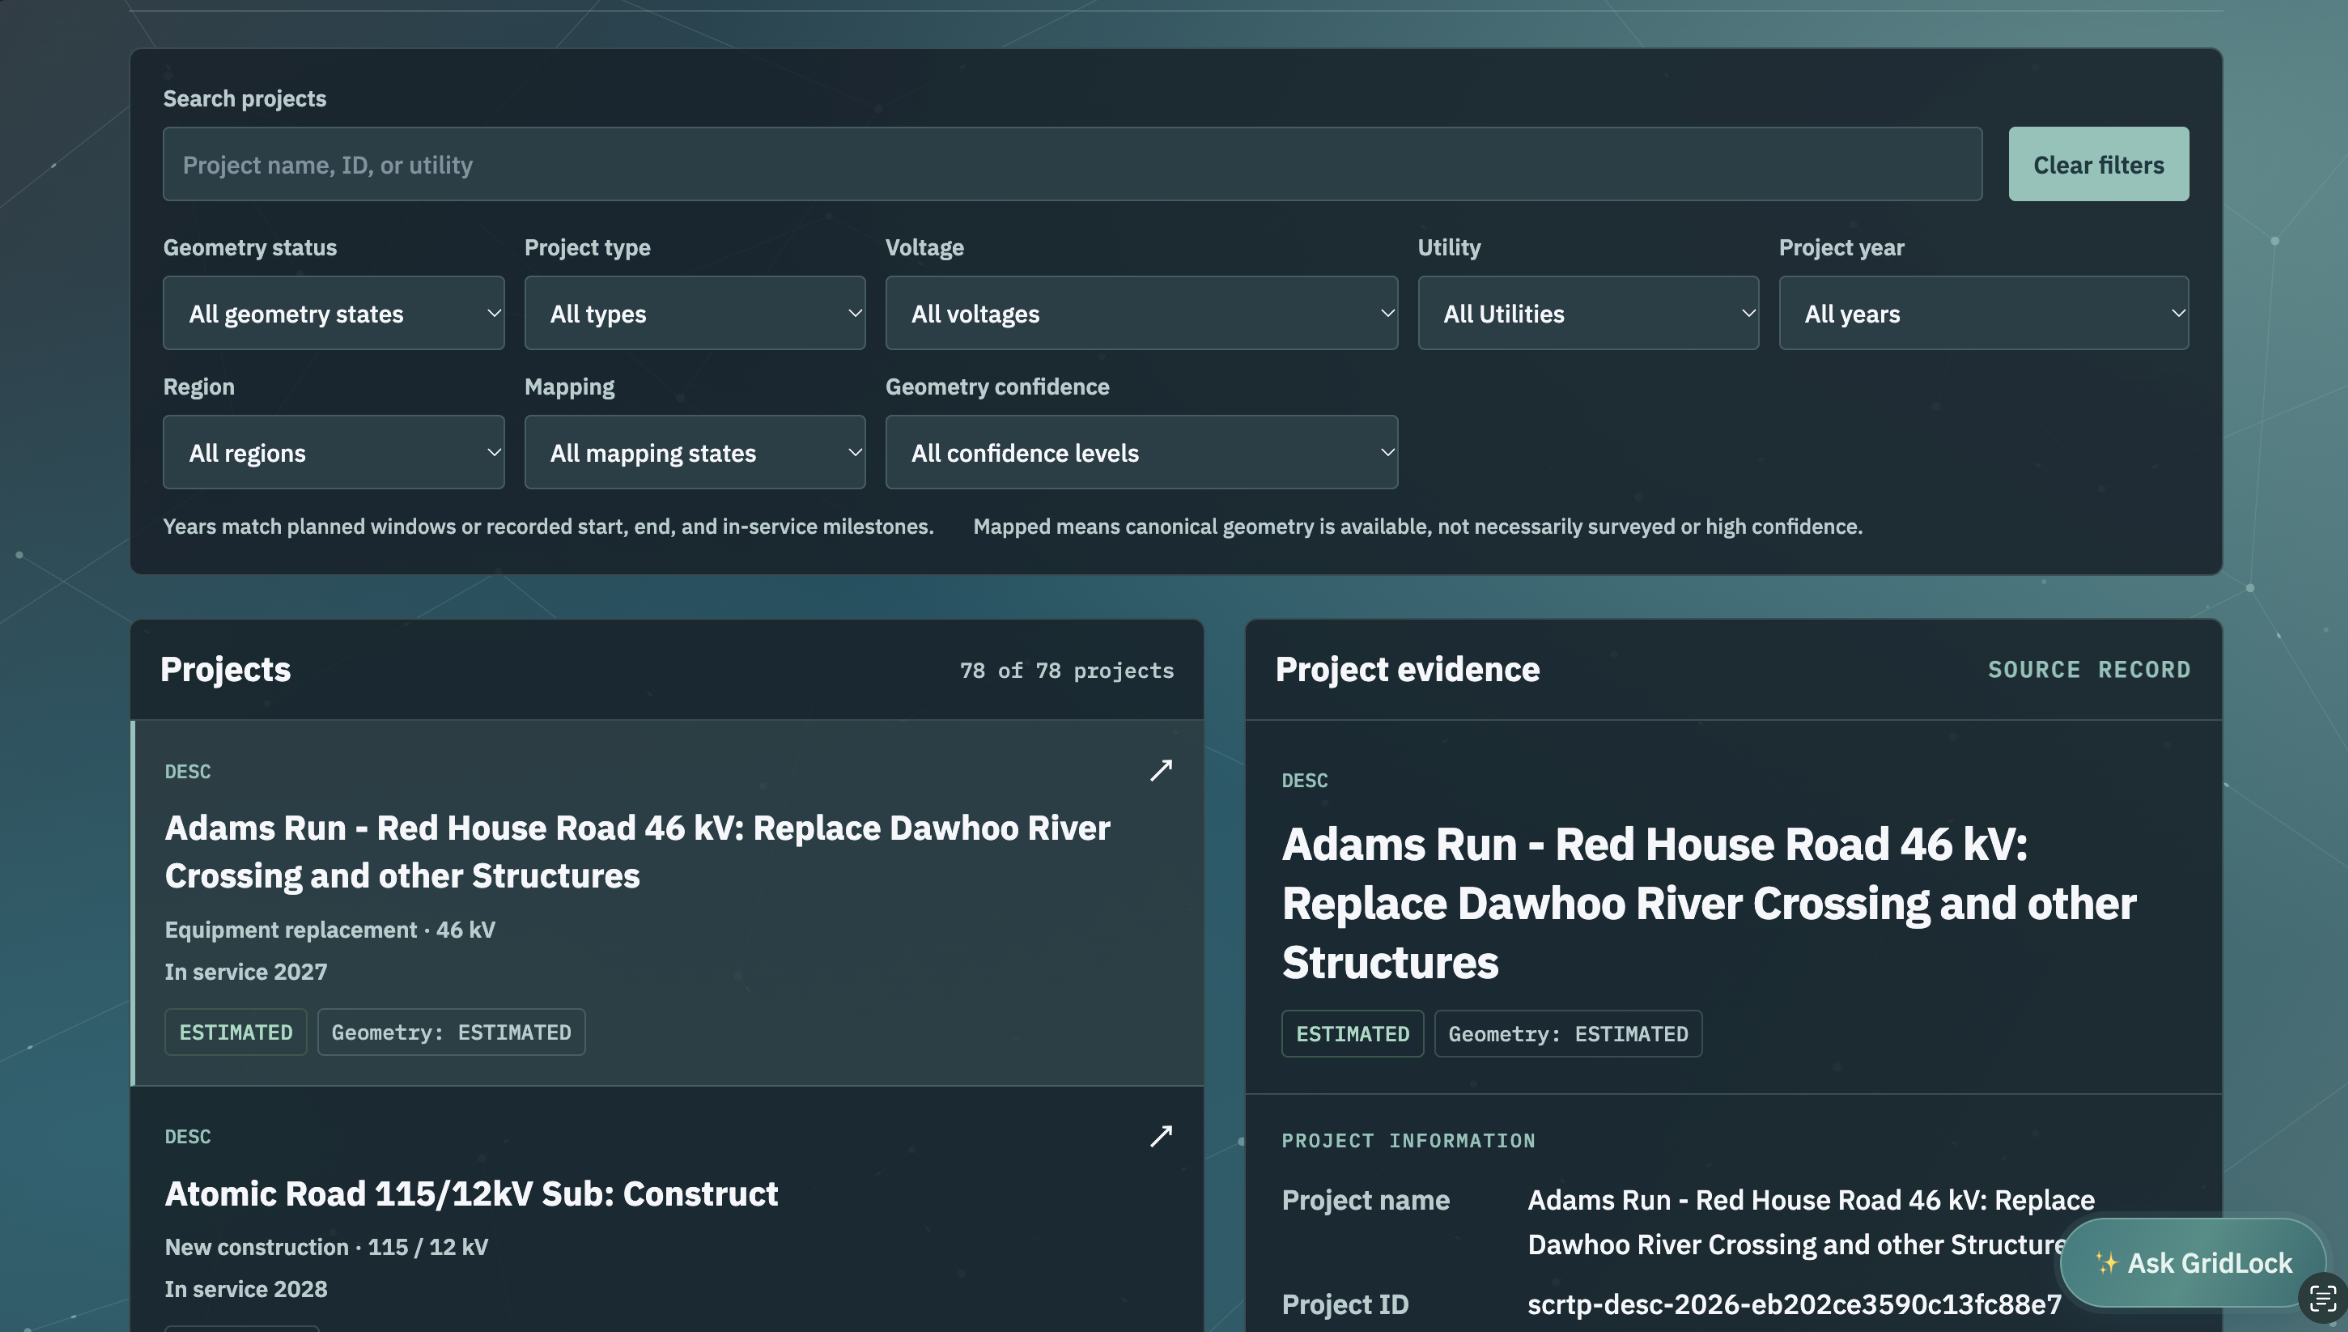
Project List
-
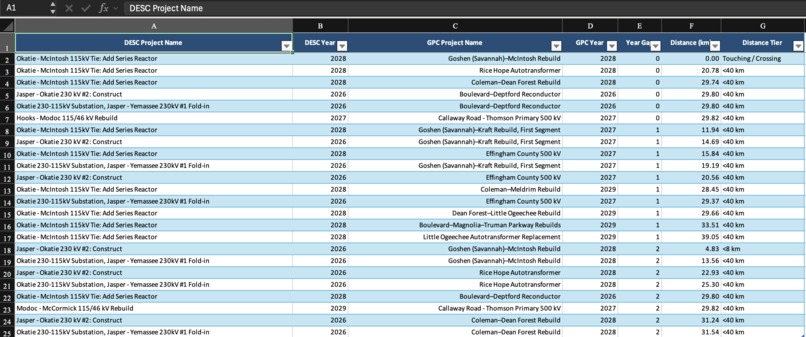
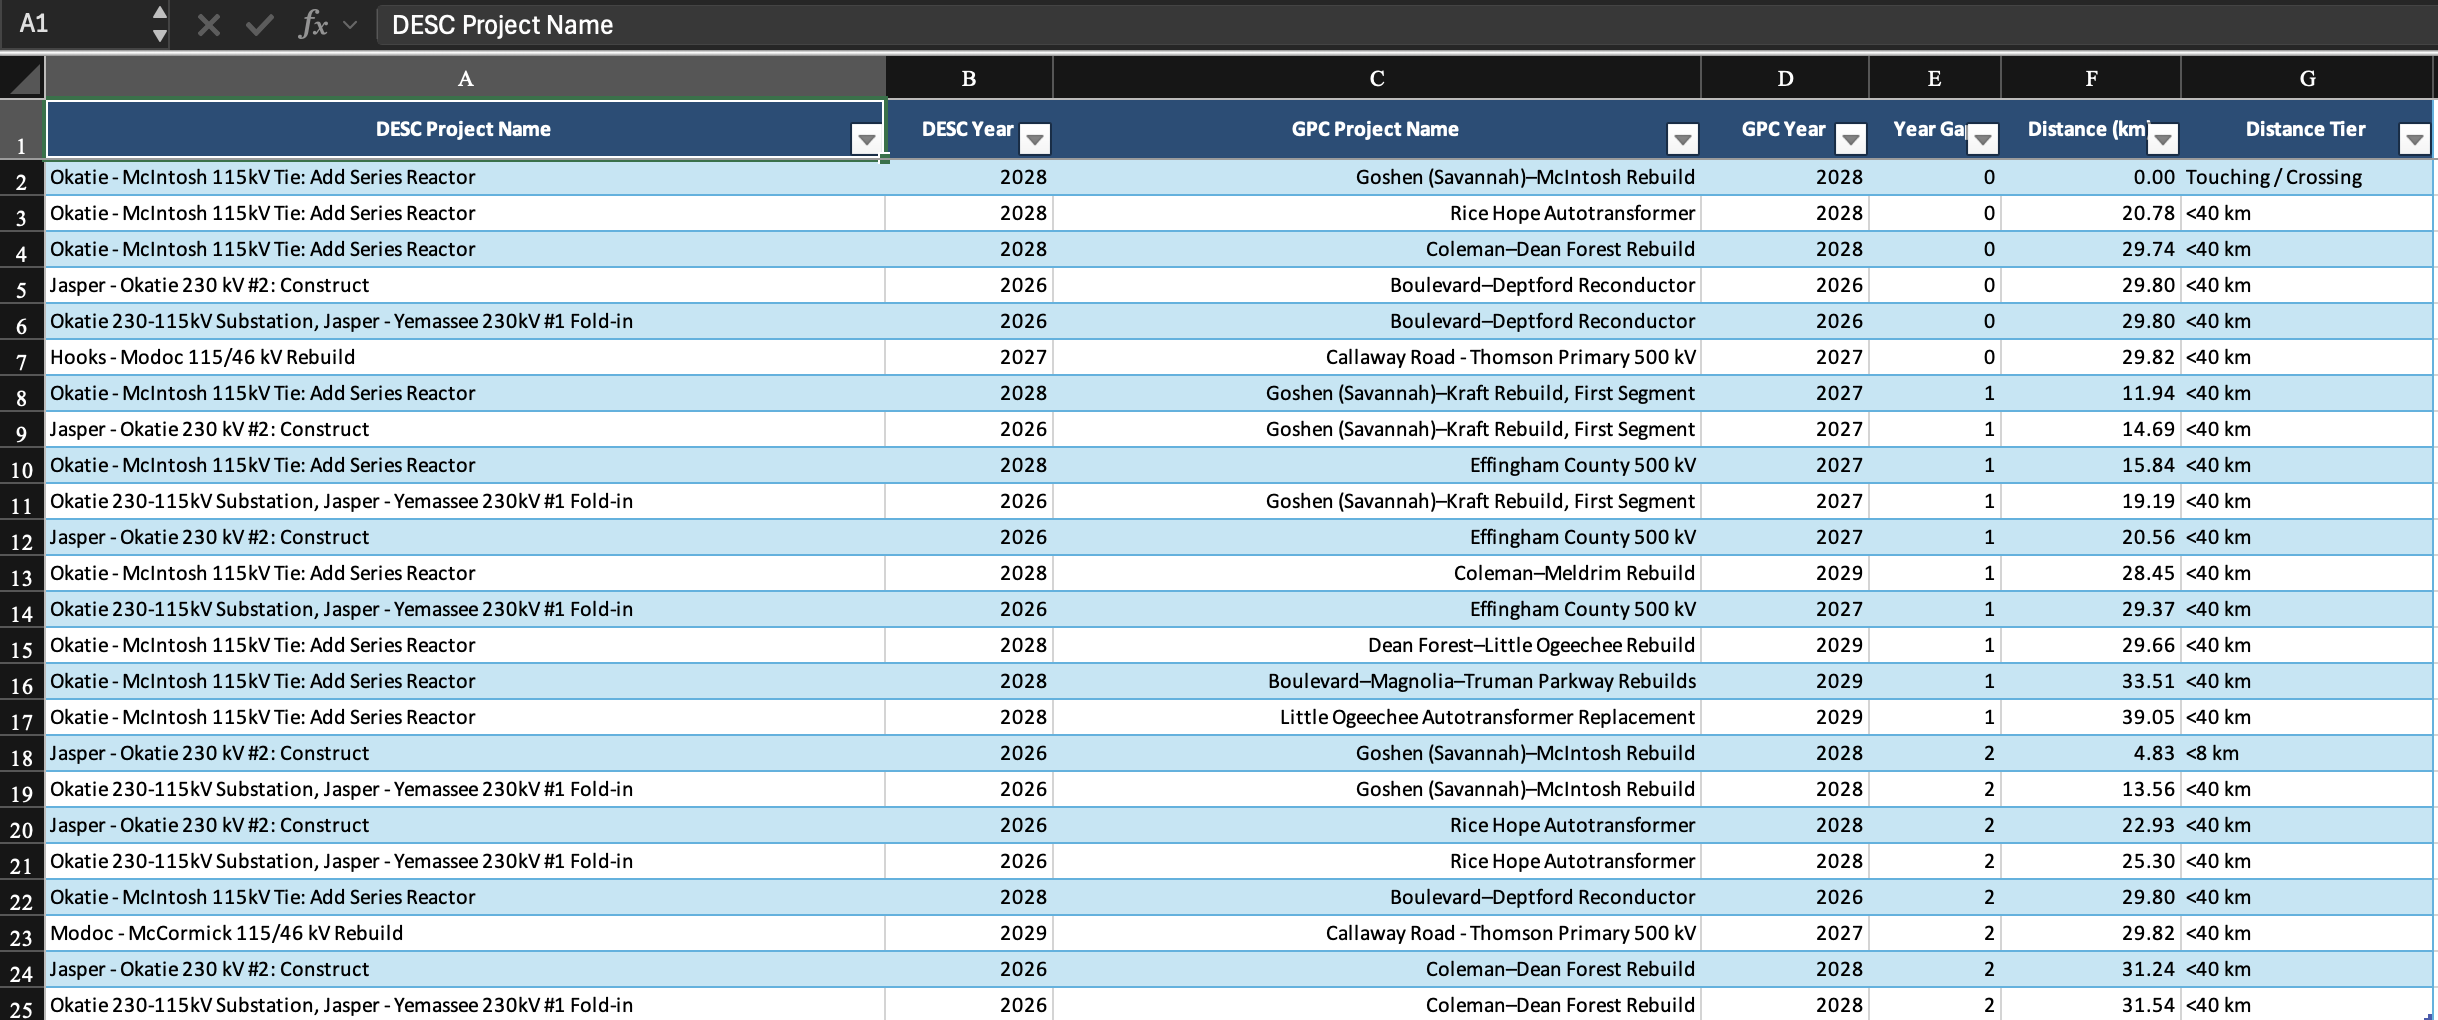
Best Matches projects extracted data(from official website)
-
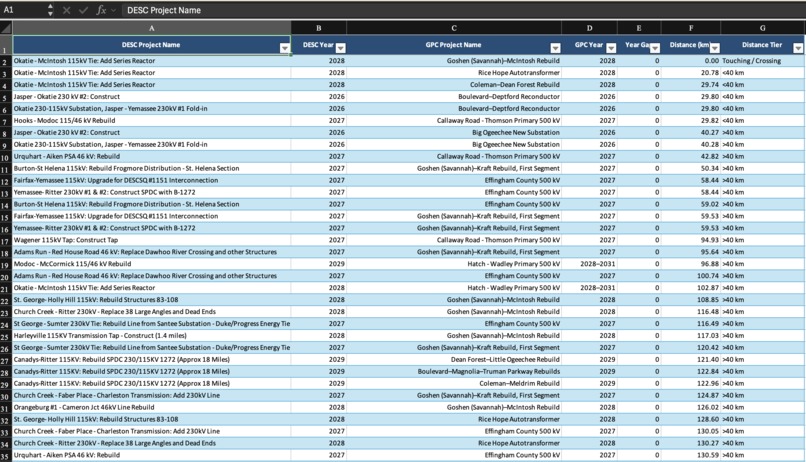
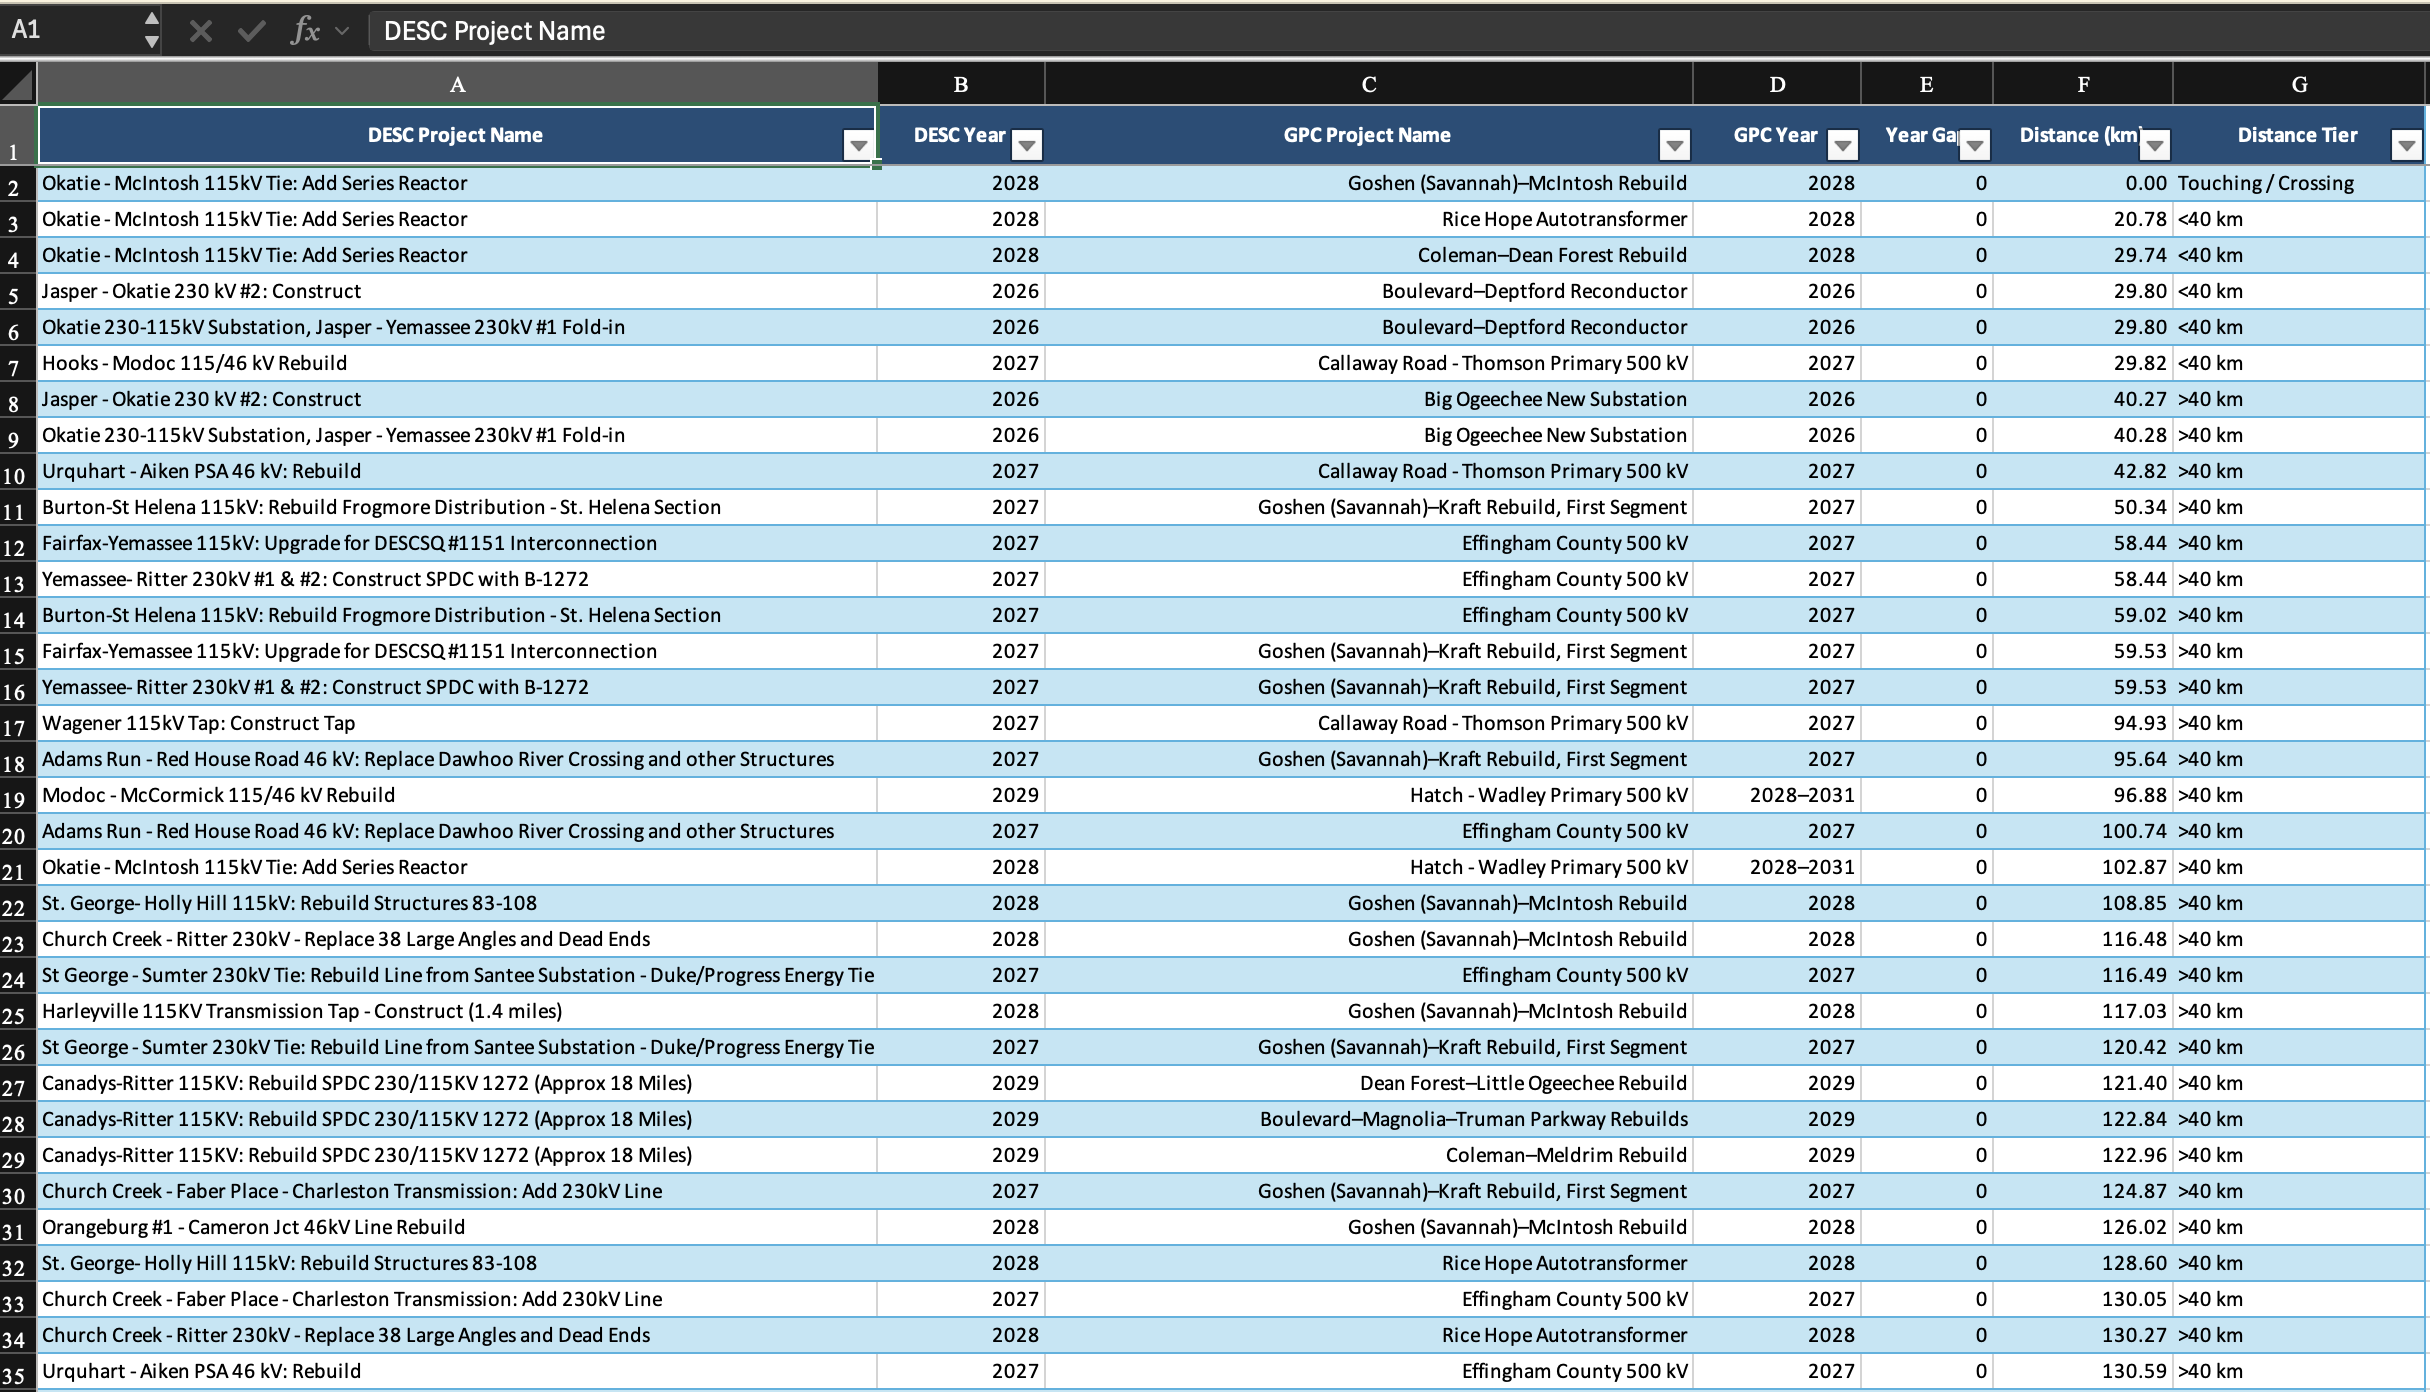
Extracted data(from official website)
Inspiration
Every year, utility companies plan infrastructure projects worth millions of dollars. Yet those plans often happen in isolation. A transmission line might be rebuilt by one utility, only for another utility or infrastructure provider to perform similar work nearby shortly afterward. The result is duplicated mobilization costs, repeated road closures, additional permitting effort, contractor inefficiencies, and wasted resources.
The same problem exists beyond power transmission. A road can be resurfaced and then reopened weeks later for underground utility work. Fiber providers, water utilities, and energy companies often operate with limited visibility into one another's plans.
We asked a simple question:
What if infrastructure organizations could discover opportunities to coordinate before construction begins?
That idea became GridLock, a platform that turns fragmented public infrastructure plans into a shared coordination radar.
What It Does
GridLock identifies potential coordination opportunities between planned transmission projects.
Using publicly available utility planning documents from multiple companies, GridLock:
- Collects and standardizes project information
- Maps available geographic data
- Analyzes project proximity using GIS calculations
- Identifies projects that may benefit from coordination
- Surfaces supporting evidence and source documentation
- Provides a visual dashboard for investigation
Rather than replacing human judgment, GridLock helps decision makers quickly identify projects that deserve a closer look.
Our current implementation uses 100% real project data from multiple utilities and provides transparent evidence for every opportunity shown.
How We Built It
We built GridLock with Python data pipelines, Shapely for geometry and GIS analysis, Leaflet and JavaScript for the interactive map, and Google Gemini for plain-language explanations. All of it runs on 100% real utility planning data.
The plans told us what was being built, but not always where. So we became part detective, pulling locations out of the documents and marking each one as verified or estimated. Then we measured how close each pair gets, checked whether their schedules line up, and ranked the best opportunities.
For the top matches, we asked the question a project manager would ask: how much could this actually save?
$$\text{Savings} \approx \text{Shared work} \times \text{Setup cost \%} \times \text{Portion you can avoid}$$
For our #1 pair, that's roughly $60k–$450k for every $10M of shared work. The savings would come from things like one crane trip instead of two, or one staging yard instead of two.
Our workflow consisted of:
- Collecting public project planning data
- Normalizing inconsistent formats across utilities
- Extracting and enriching geographic information
- Creating verified and estimated geometry datasets
- Calculating project to project proximity using GIS analysis
- Ranking potential coordination opportunities
- Building an interactive dashboard to explore results
- Integrating AI assisted explanations to help users understand findings
A core design principle guided the project:
AI explains. GIS verifies. Humans decide.
Challenges We Ran Into
One of the biggest challenges was working with real world infrastructure data.
Unlike clean academic datasets, public utility planning documents are inconsistent, incomplete, and spread across many sources. Simply extracting the information and building a reliable data pipeline required significant effort.
Other challenges included:
- Reconciling data from multiple utilities
- Recovering usable geographic information from planning documents
- Distinguishing verified geography from estimated geography
- Building accurate opportunity scoring without introducing false positives
- Ensuring that timing and geographic proximity both aligned
- Creating meaningful cost saving estimates that were realistic for the industry
- Presenting complex GIS analysis in a way that nontechnical users could immediately understand
Making the platform trustworthy was just as important as making it functional.
Accomplishments That We're Proud Of
We're especially proud that:
- The platform uses real utility planning data rather than synthetic examples
- Every opportunity is backed by evidence and source documentation
- Our GIS analysis is transparent and explainable
- We successfully created a working end to end data pipeline
- We built an interactive coordination radar and project explorer
- We integrated AI without allowing it to fabricate results
- We created a system that helps users investigate opportunities rather than blindly trust recommendations
Most importantly, we're proud that GridLock demonstrates how real world infrastructure planning can become more coordinated, efficient, and transparent.
What We Learned
This project taught us that the hardest problems are often not the algorithms themselves, but the data.
We learned:
- How difficult it is to standardize infrastructure planning datasets
- The importance of provenance and traceability
- Practical GIS analysis techniques
- How to build explainable systems instead of black box systems
- How to incorporate AI responsibly into decision support tools
- How much value can be unlocked when disconnected datasets are brought together
We also learned that effective visualization is just as important as accurate analysis. Even the best insights are only useful if people can quickly understand and act on them.
What's Next for GridLock
This is only the beginning.
Future versions of GridLock could:
- Expand to additional utilities and infrastructure sectors
- Incorporate historical project outcomes
- Predict potential delays and coordination risks
- Analyze contractor and resource utilization patterns
- Identify regions with recurring infrastructure bottlenecks
- Use weather, flooding, hurricane, wildfire, and other environmental data to anticipate future infrastructure activity
- Provide regional preparedness insights for utilities, government agencies, contractors, and emergency planners
- Deliver AI generated executive briefings and planning recommendations
Our vision is a future where infrastructure organizations can coordinate proactively instead of reactively, reducing costs, minimizing disruption, and building more resilient communities.
GridLock transforms fragmented infrastructure plans into actionable coordination intelligence before construction even begins.
Built With
- css
- dataengineering
- datapipeline
- geojson
- geospatial
- gis
- git
- github
- html
- javascript
- json
- leaflet.js
- maps
- pdfparsing
- python
- vscode
- web

Log in or sign up for Devpost to join the conversation.