Inspiration
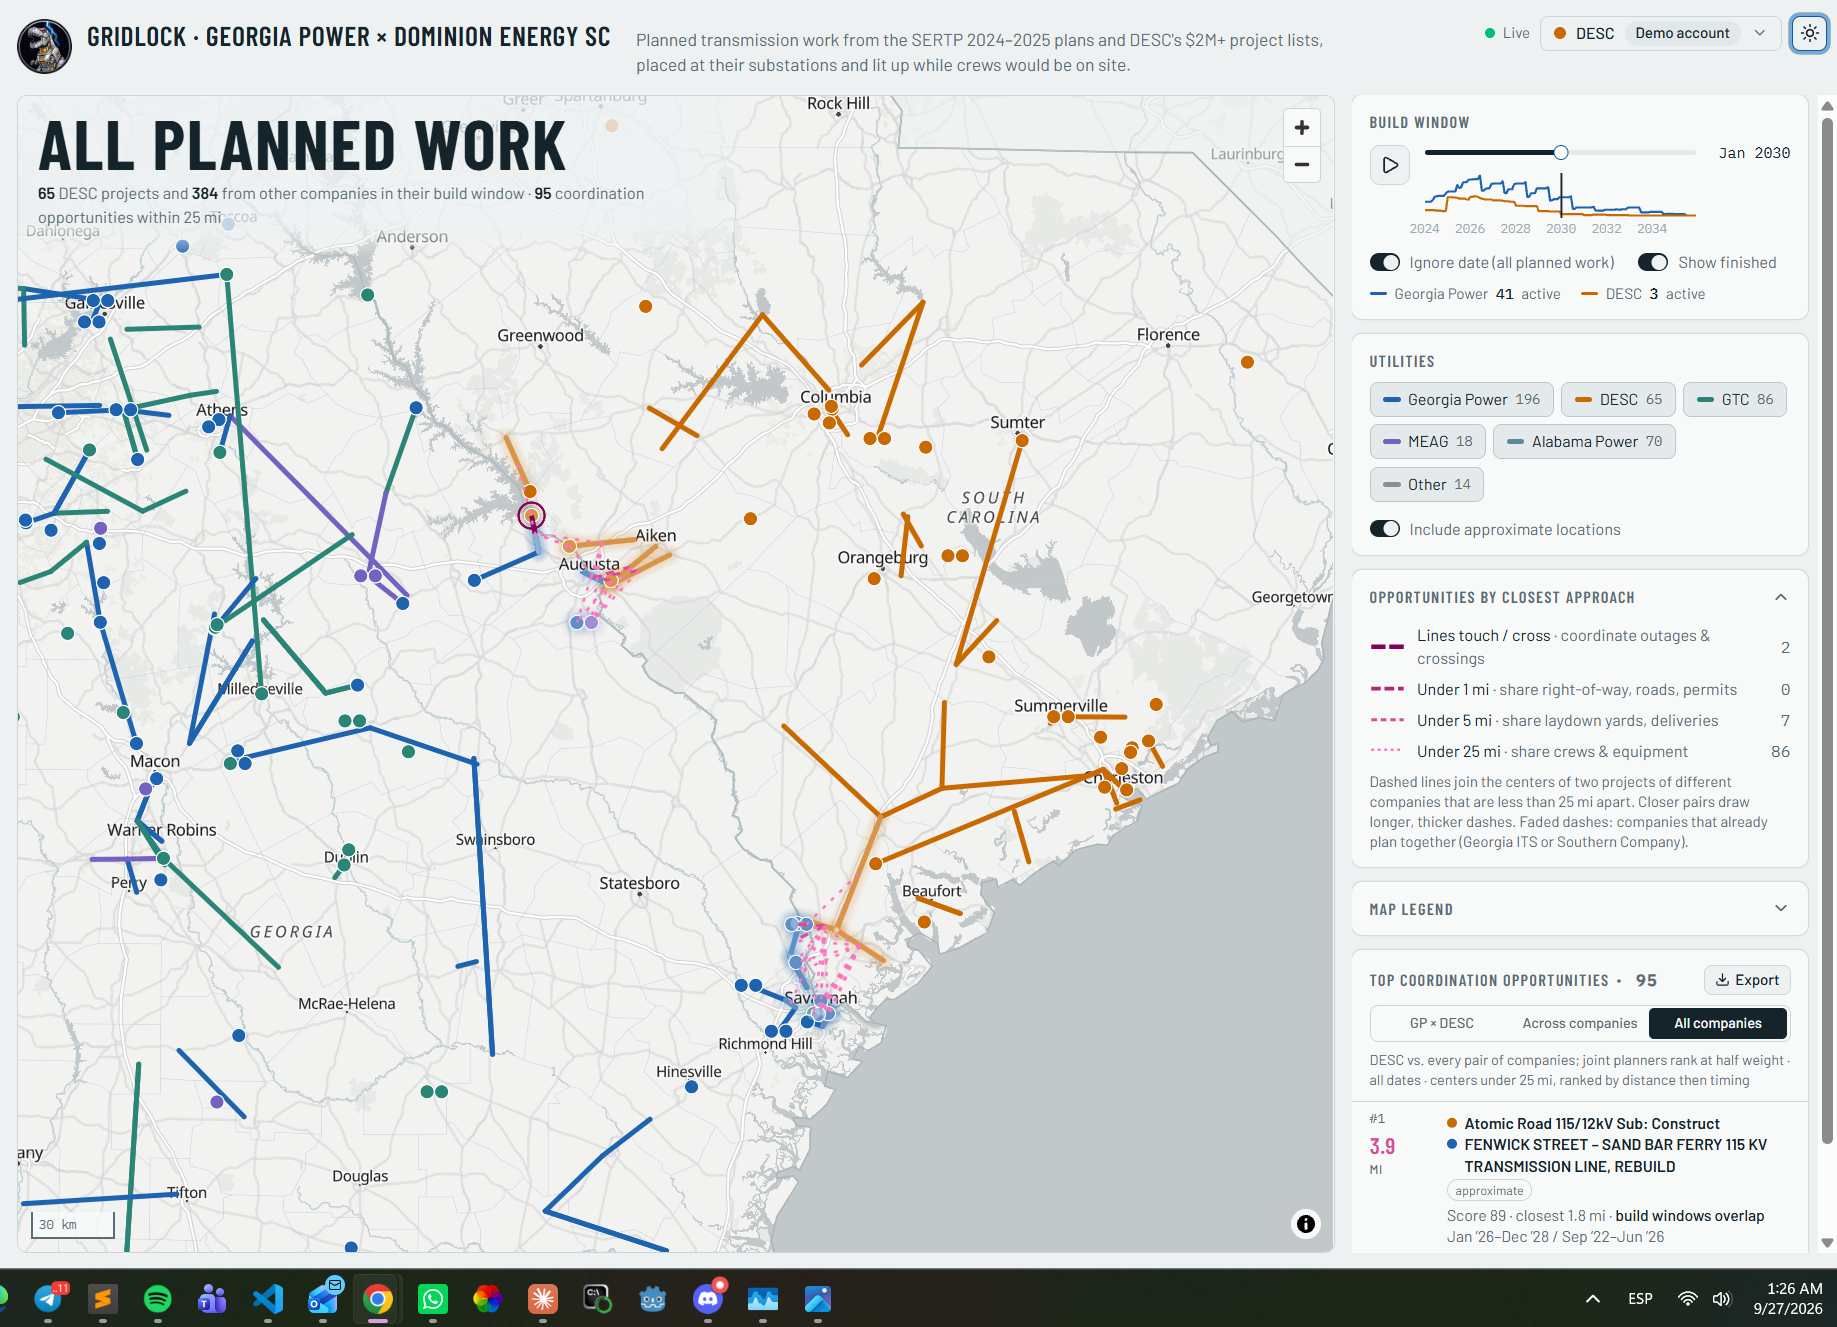
Neighboring utilities plan transmission work years ahead, each on its own. Georgia Power and Dominion Energy South Carolina face each other across the Savannah River, but their plans live in separate PDFs with no coordinates and no shared calendar. When two crews end up working a few miles apart in the same months, nobody finds out in time. Sperry Tech's Gridlock challenge asked us to make those coincidences visible.
What it does
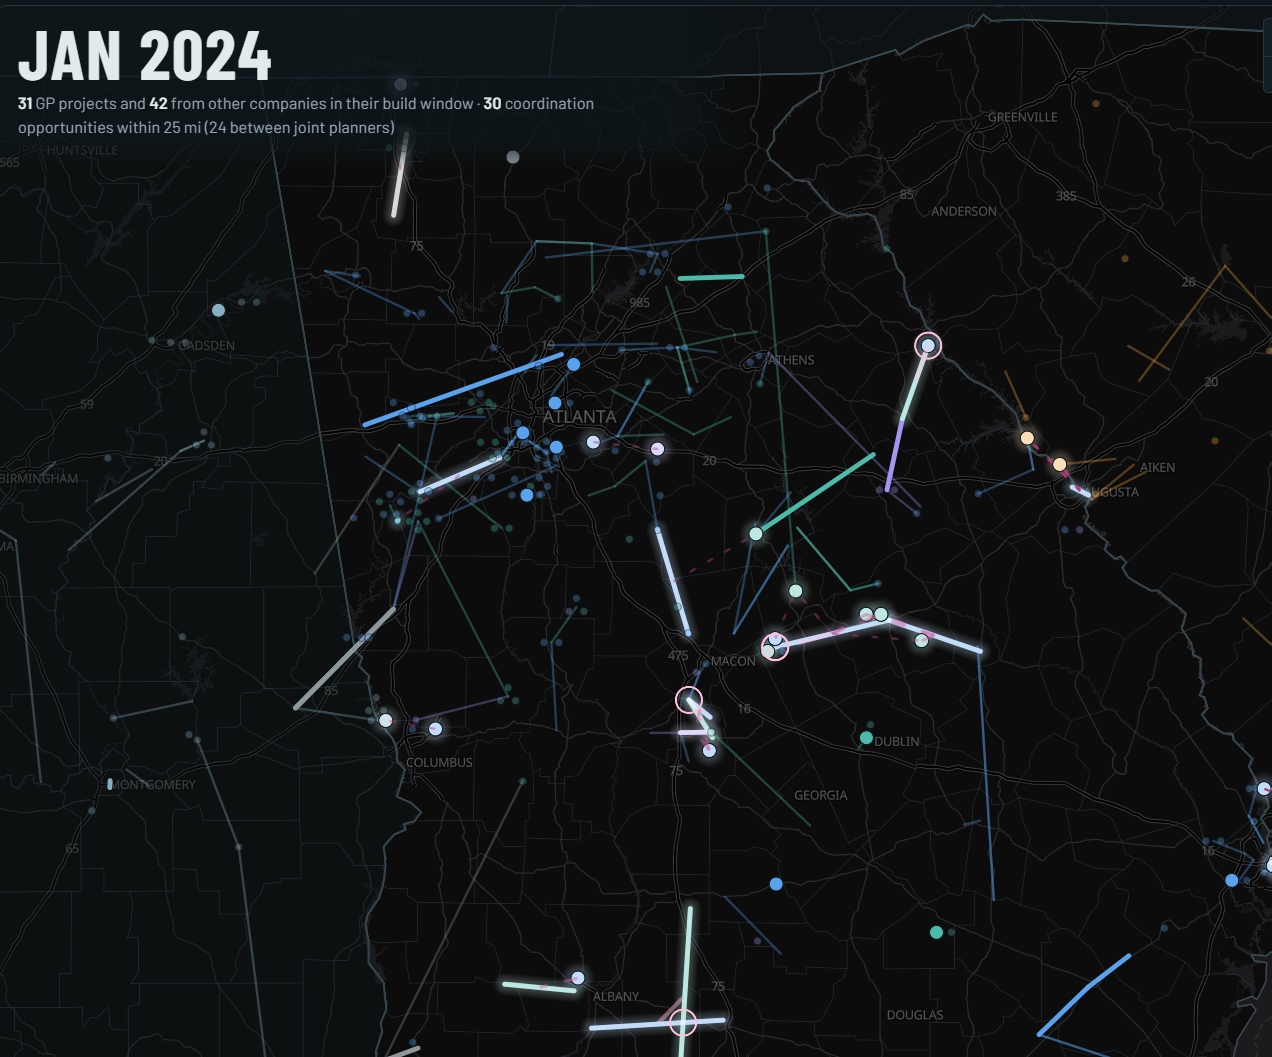
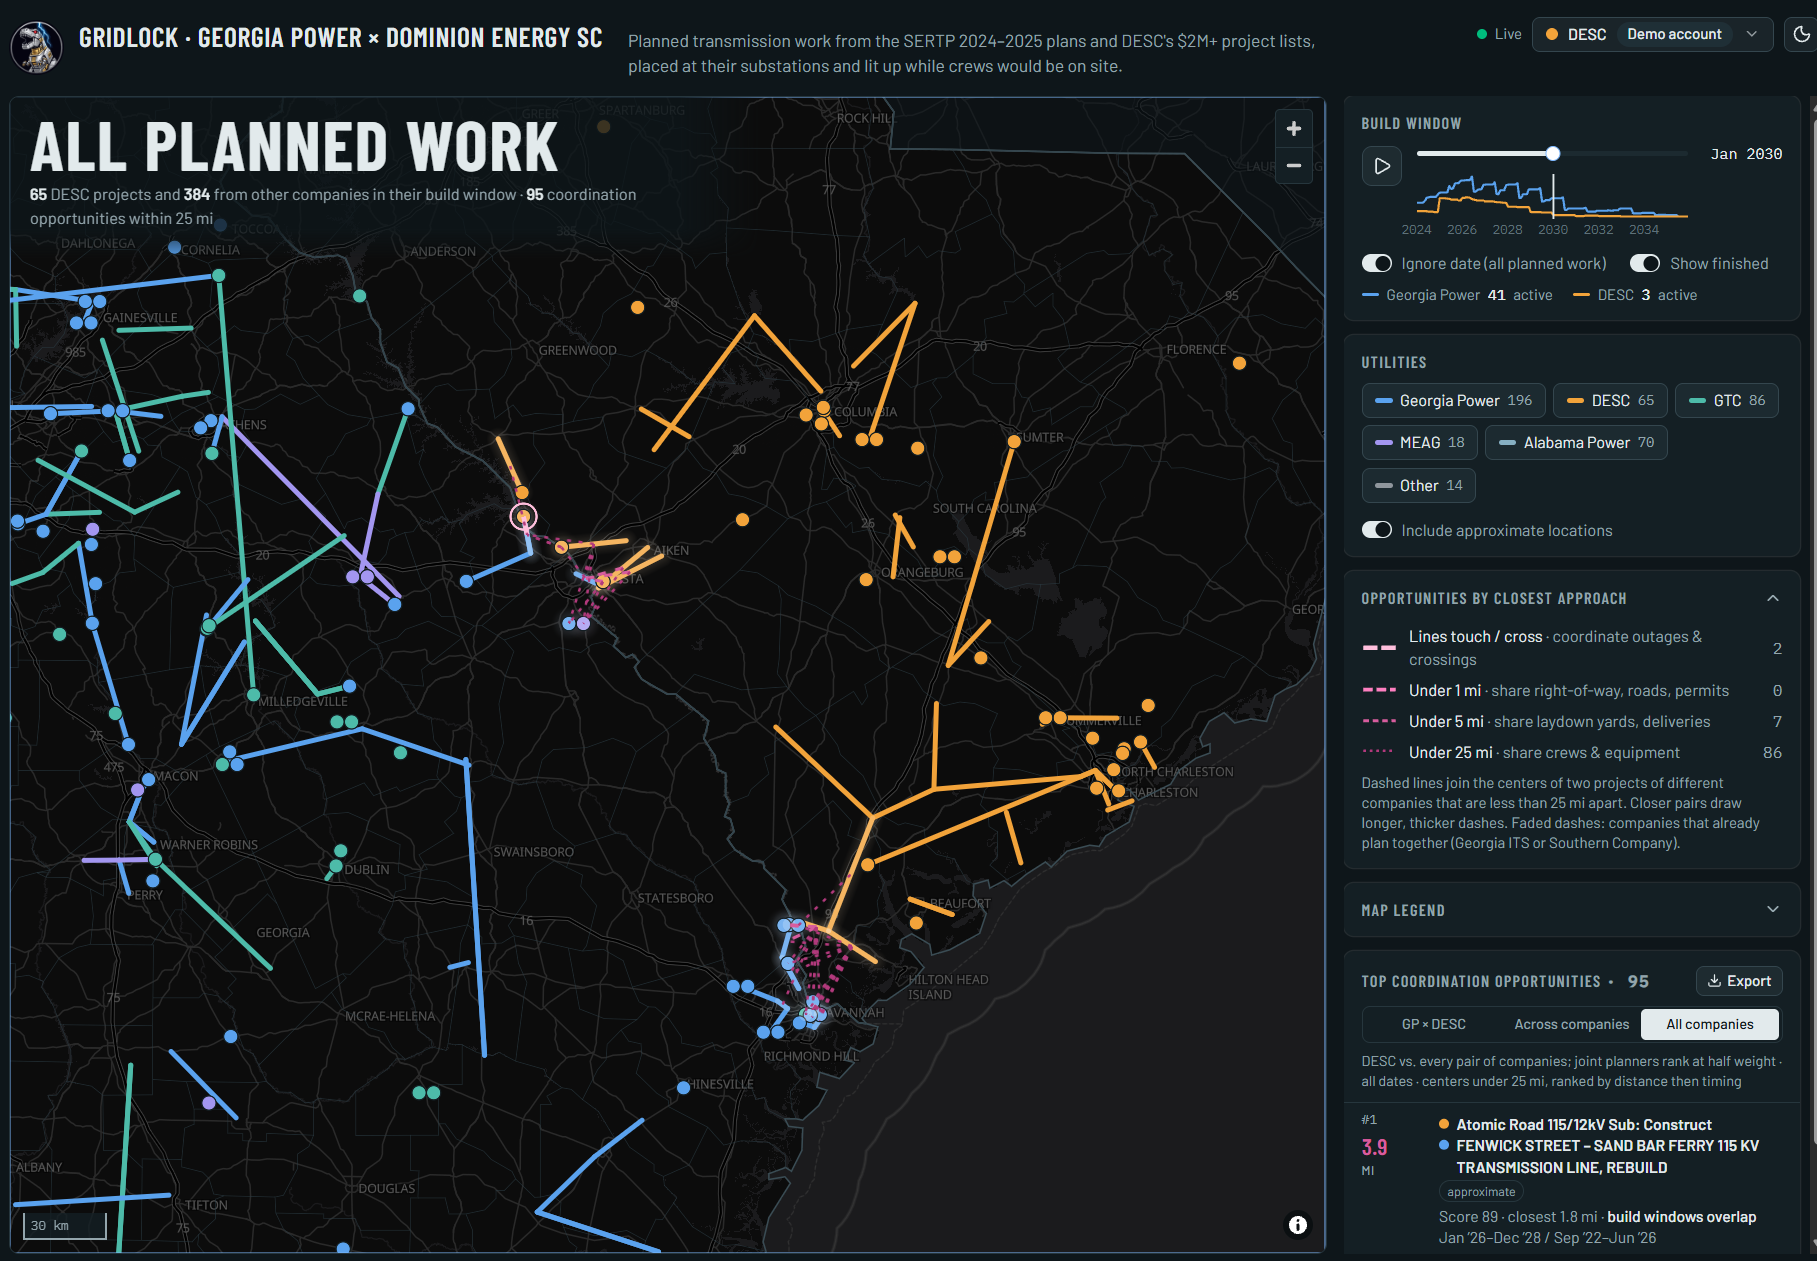
- Places every planned project on an interactive map: Georgia Power and its SERTP neighbors (SERTP 2024 and 2025, plus the GA ITS 10-Year Plan) and DESC's $2M+ project lists (2024–28, 2025–29, 2026–30).
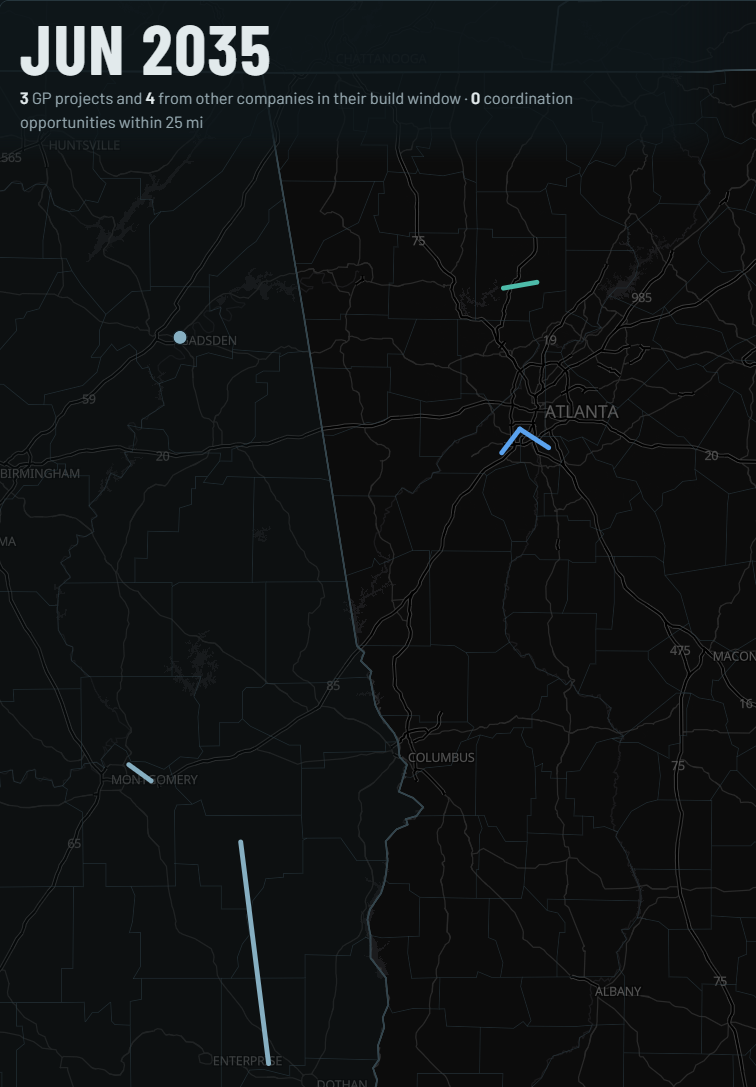
- A timeline lights up the projects under construction in each month.
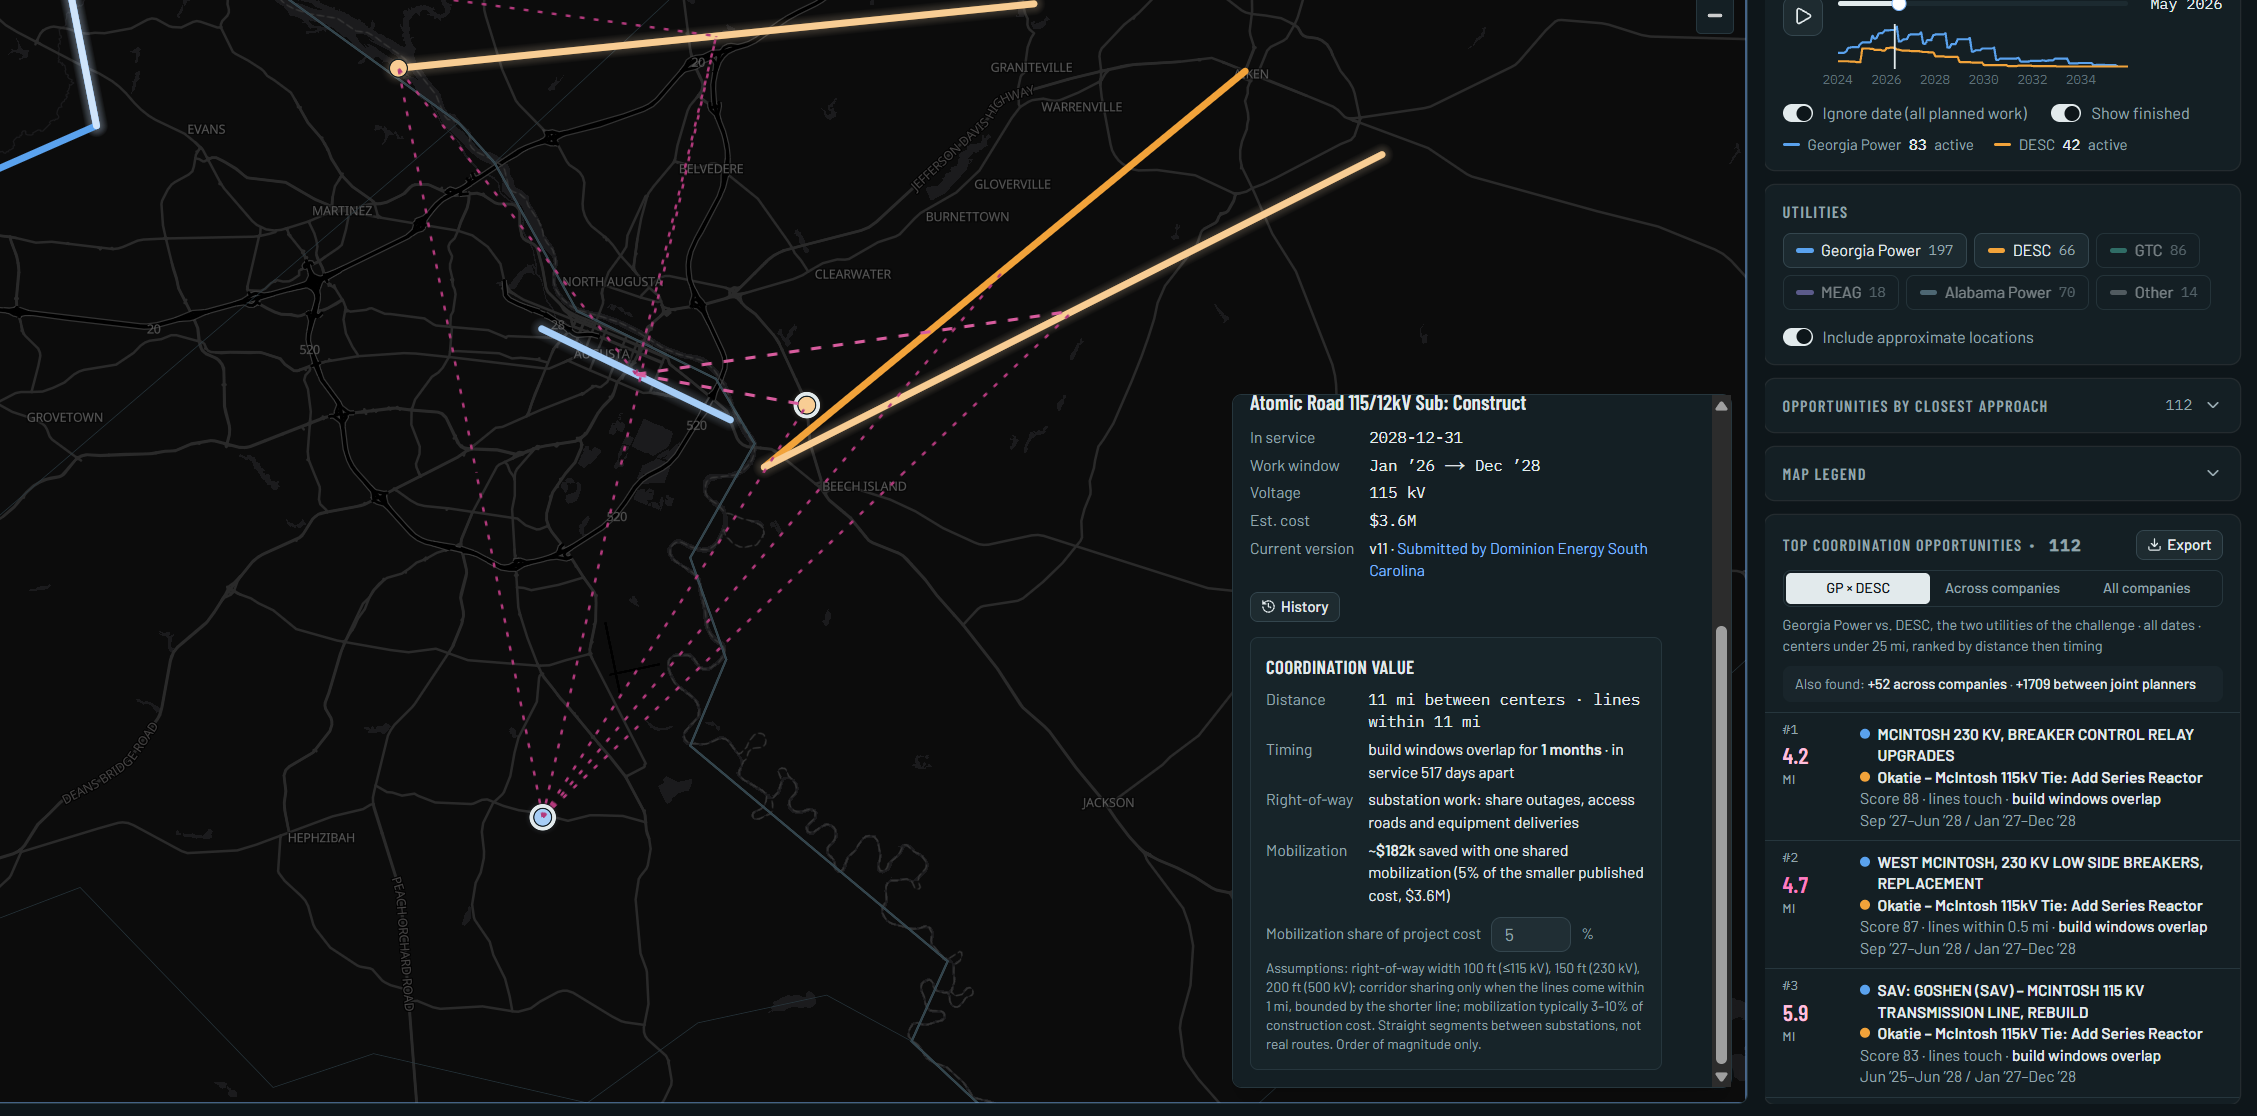
- Flags pairs from different companies whose centers are under 25 miles apart (the organizers' rule) and ranks them: 70% distance, 30% timing. Companies that already plan together, likely duplicates and pairs where a project is already in service rank at half score. Compare Georgia Power × DESC, all independent companies, or everyone.
- Shows how close the lines themselves pass, in tiers: touching, under 1 mi, under 5 mi, under 25 mi. Each tier says what the two utilities could share: outages and crossings, right-of-way, laydown yards, or crews and equipment.
- Estimates the coordination value of each pair: right-of-way acres that could be shared and the savings from one shared mobilization, as an editable share of the published budget, with every assumption shown.
- Exports the ranking in the organizers' two-sheet format.
- Lets utilities sign in and publish projects, with a form or a spreadsheet. Accounts are issued after an in-person check. Nothing is overwritten: every change is a new version with its author, time, source and reason, a whole upload can be reverted, and every open map refreshes in real time.
How we built it
A Python pipeline extracts the projects from the public PDFs, splits each one into its named substations and places them with OpenStreetMap data, checking each line's implied length against the miles the utility reported. Node scripts load every filing into the database as versions in publication order, apply the organizers' verified coordinates as corrections, and run our own location audit.
The web app is Next.js 16 (App Router, static export) with React 19, TypeScript, Tailwind v4 and shadcn/ui (Radix). The map is MapLibre GL via react-map-gl over an OpenFreeMap basemap, with zustand for state. Data lives in Supabase (Postgres 17 + PostGIS, Auth, Realtime): row-level security on every table, no write policies, and every write through security-definer functions into an append-only, hash-chained ledger. Imports are parsed with SheetJS and validated with zod; tests run on Vitest. Hosted on Netlify, with a static fallback so the public map keeps working if the database is unreachable.
Challenges we ran into
- The plans publish no coordinates or routes (they are restricted as CEII), so every location had to be rebuilt from substation names.
- The same substation name can exist in two states. Our geocoder placed several Georgia substations in Alabama; we audited them against the Georgia plan and removed the wrong points as correction versions.
- Project names change between plan years, so we had to match projects across filings and keep each filing as a version.
- The overlap rule was refined as the sponsor's documents arrived, so we qualify pairs by center distance and grade them by closest-approach distance, and show both.
Accomplishments that we're proud of
- It is live on its own domain, running on real public data.
- Our test reproduces the organizers' six example overlaps exactly (distance and days apart), and flags nothing else.
- It surfaces the clearest real opportunity: around Plant McIntosh, DESC's Okatie – McIntosh 115 kV tie touches Georgia Power's McIntosh 230 kV relay upgrades and Goshen – McIntosh rebuild, in the same 2027–2028 window.
- Instead of hand-checking more PDFs, we built the door for new data: an import any utility can use, with a full history behind every project.
What we learned
The hard part of cross-utility coordination is not the math, it is getting comparable data. Distance and dates are easy once the projects share a format.
What's next for Gridlock
- Real line routes instead of straight segments between substations.
- An export mode in Sperry Tech's RFP review tool that produces our import format, so a project's conflicts are known from the moment its RFP is created.
- More utilities through the same import.
Built With
- maplibre
- netlify
- next.js
- node.js
- openfreemap
- openstreetmap
- postgis
- postgresql
- python
- radix-ui
- react
- react-map-gl
- shadcn/ui
- sheetjs
- supabase
- tailwindcss
- typescript
- vitest
- zod
- zustand

Log in or sign up for Devpost to join the conversation.