Inspiration
Cities and utilities already coordinate street work on shared platforms such as PaverOps, so one trench is not dug twice. We found no public equivalent for transmission, let alone across a state line. Dominion Energy South Carolina plans in SCRTP and the Georgia utilities plan in SERTP, and each publishes a long PDF. FERC Order 1920 now asks neighboring regions to share long-term needs and possible solutions. We wanted a first, honest look at where these two public plans meet.
What it does
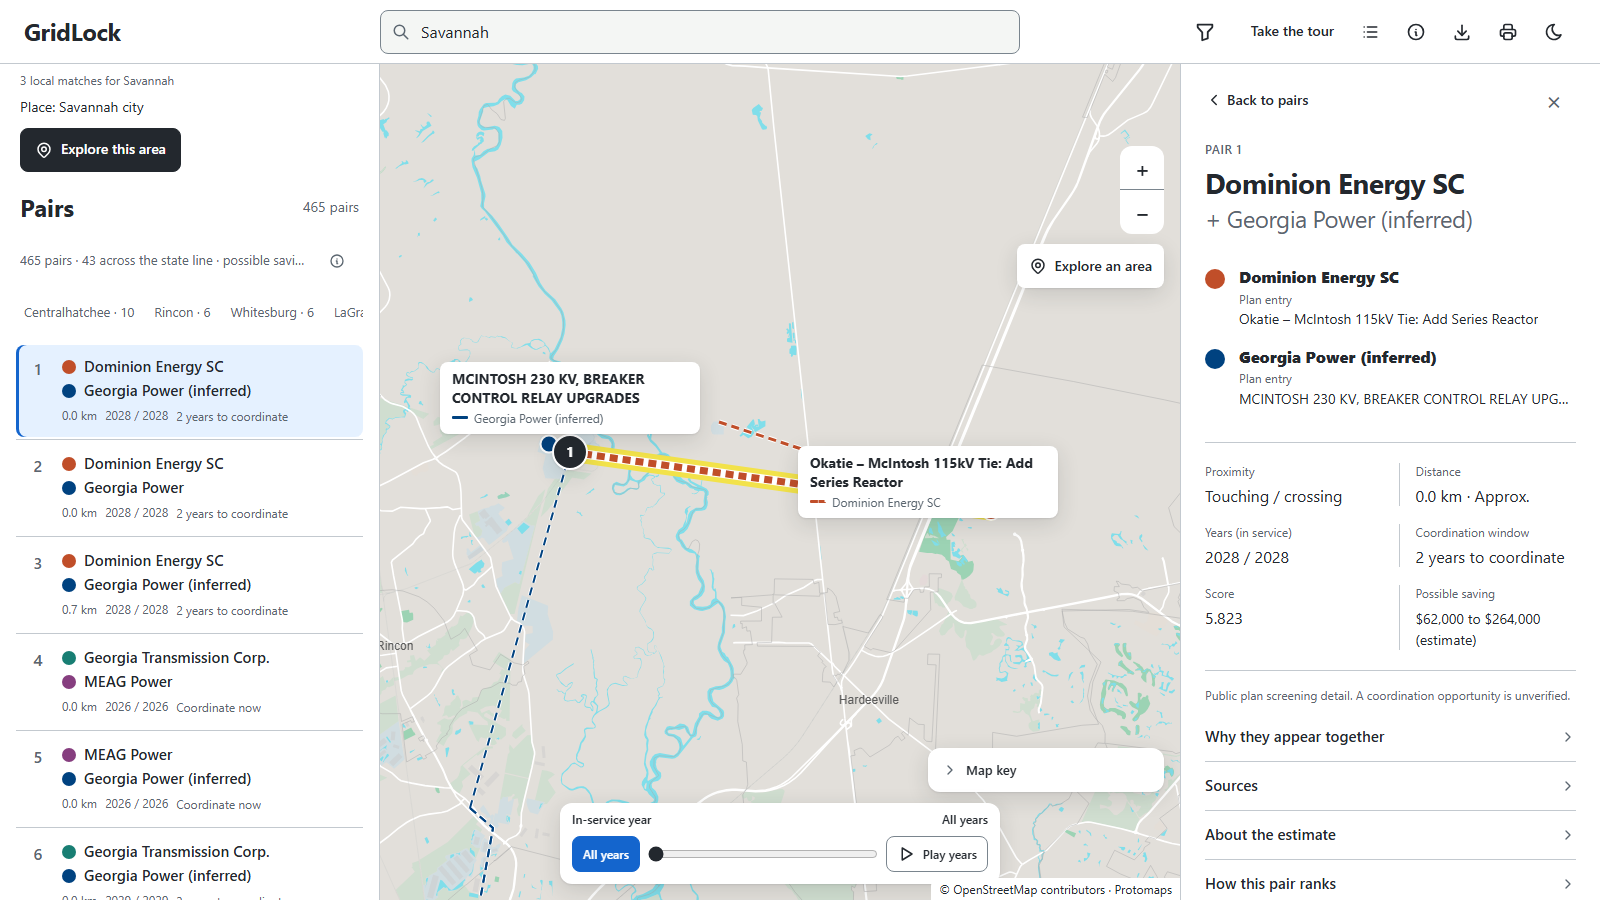
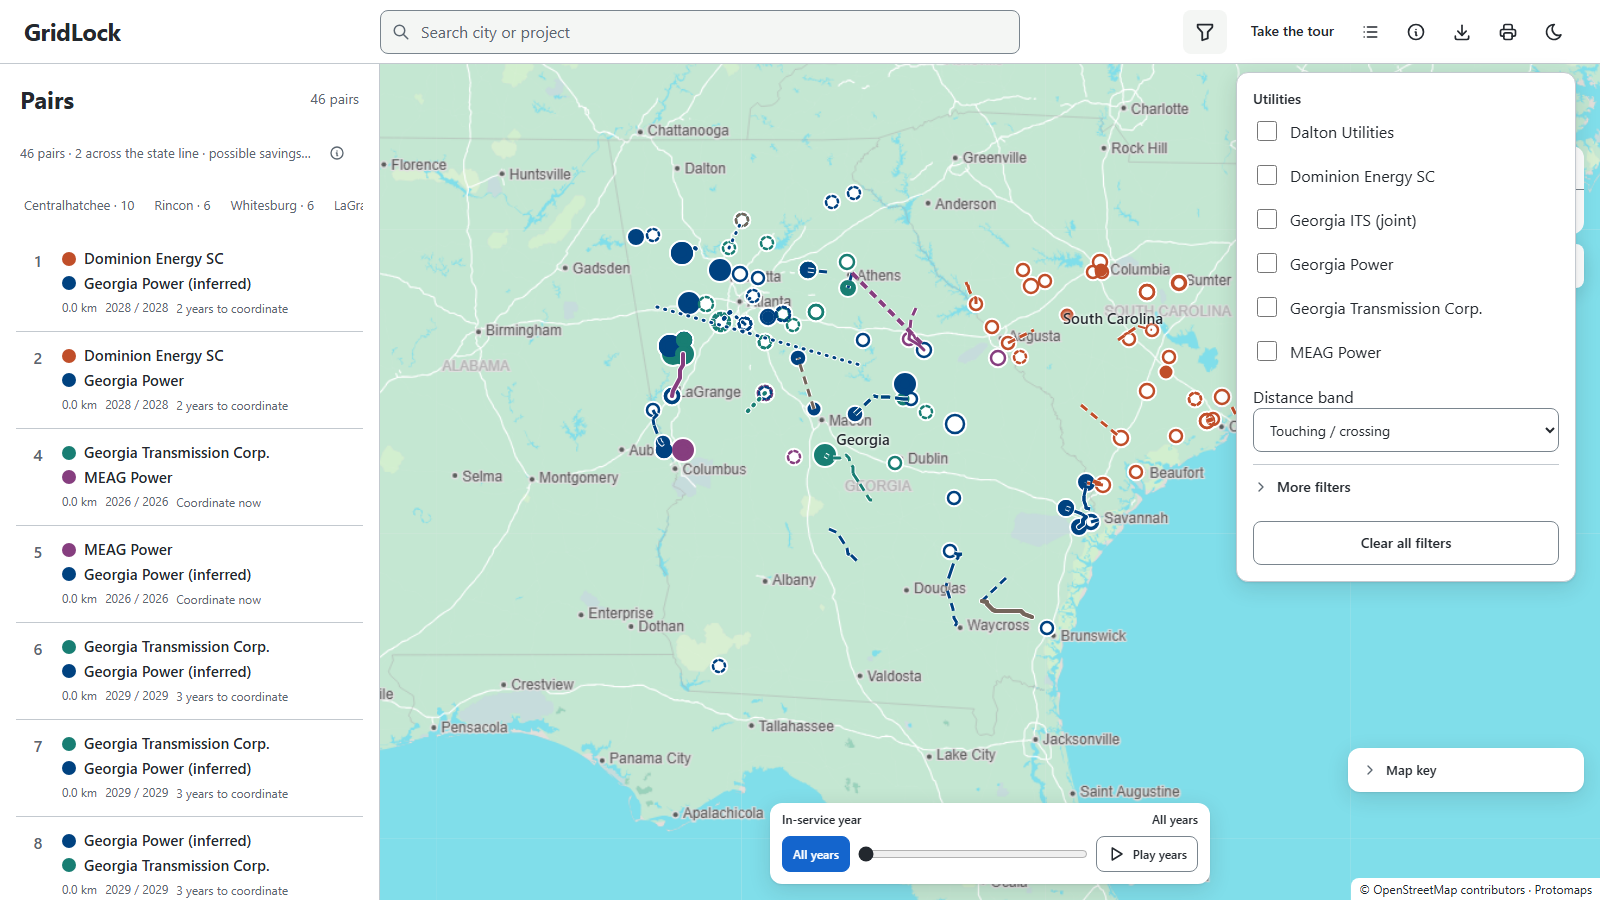
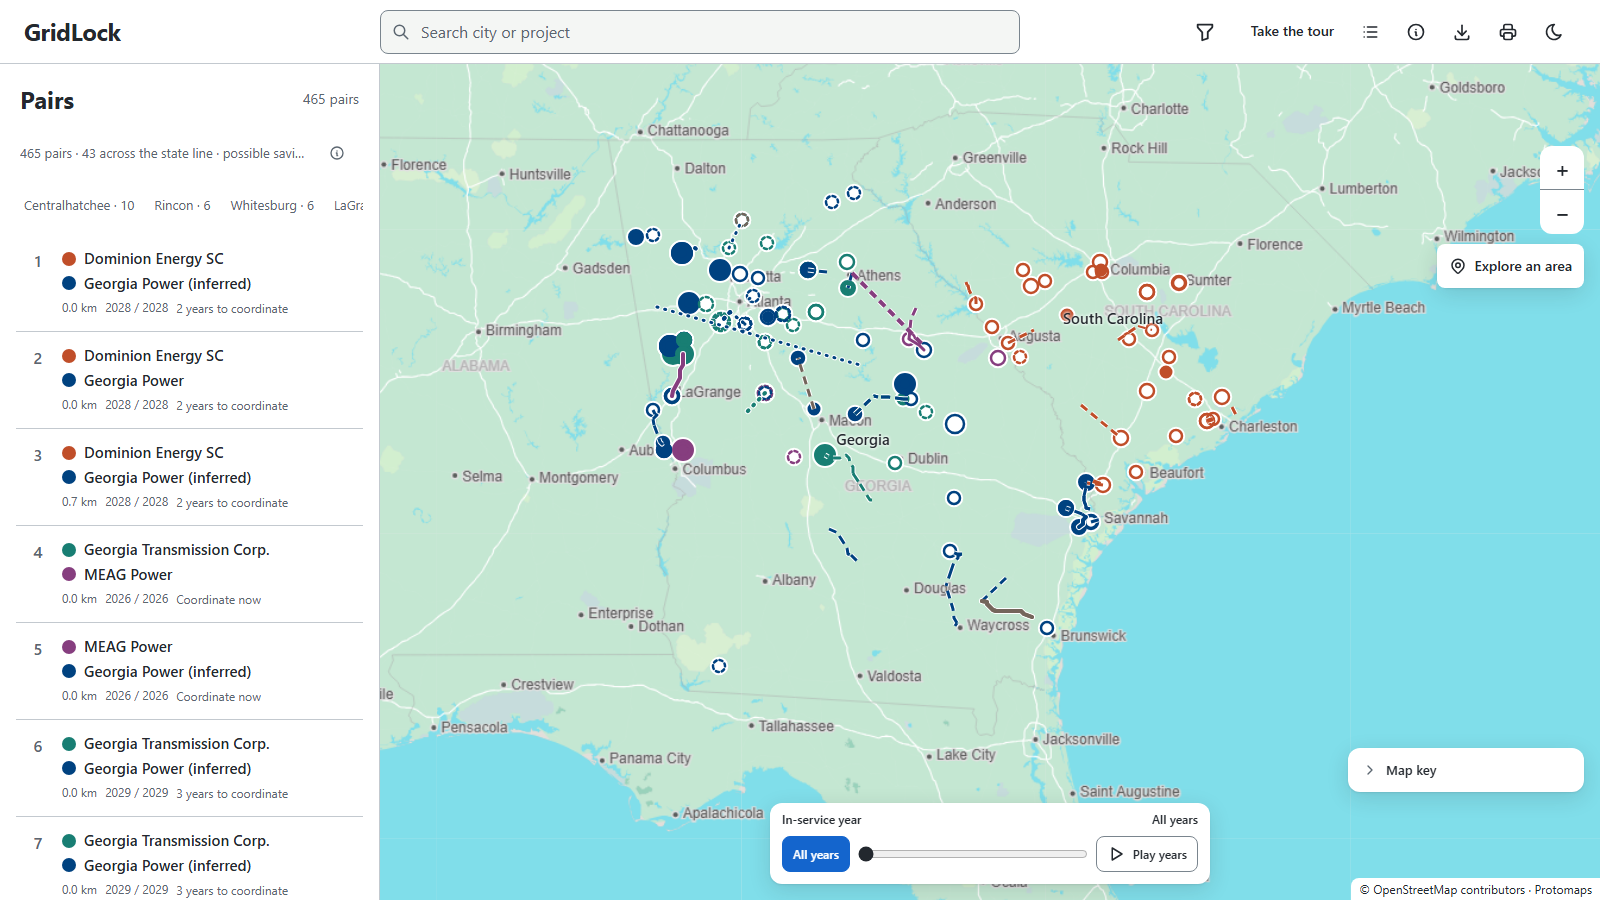
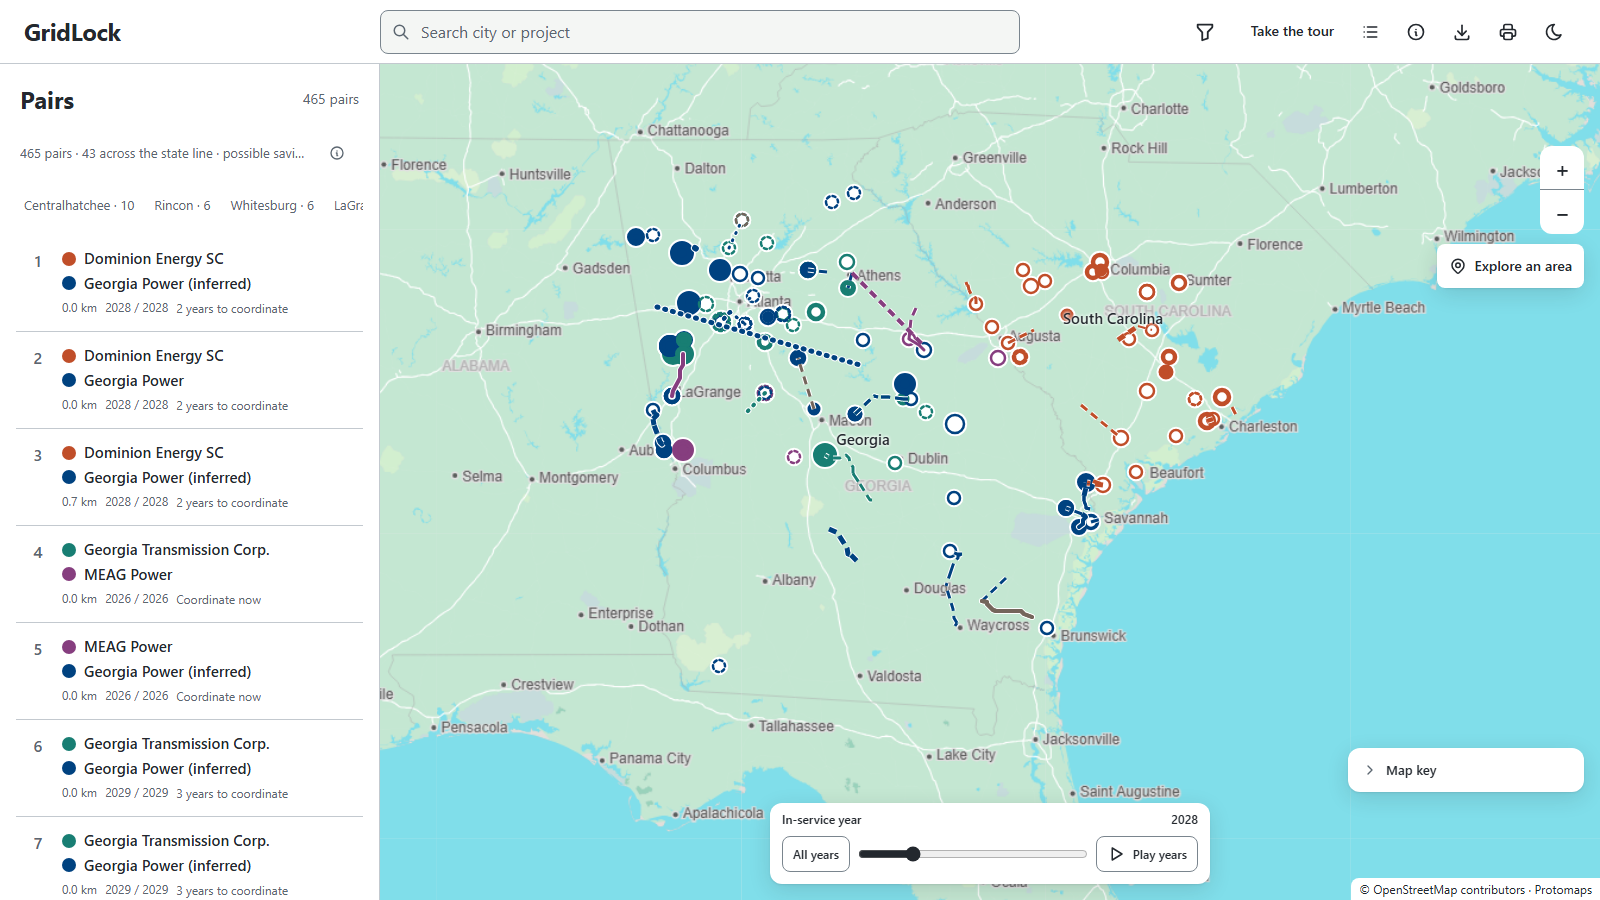
GridLock reads Dominion Energy SC's 2026-2030 plan and the SERTP 2025 regional plan, puts 181 of their 230 projects on a map, and ranks the 465 pairs of projects from different utilities that are within 40 km of each other.
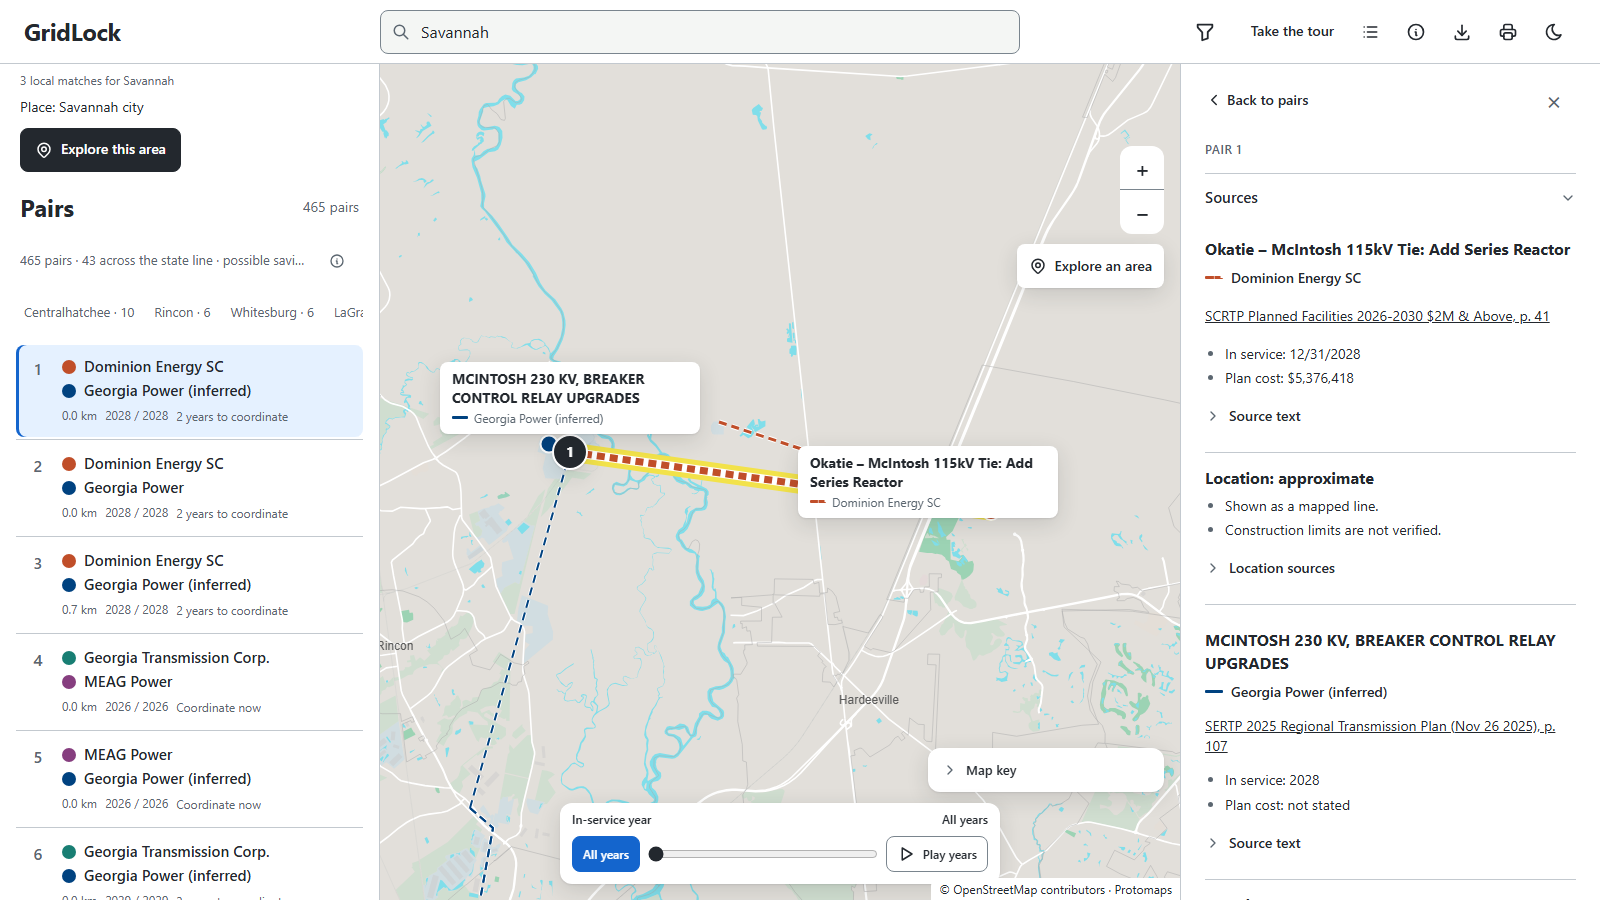
Why they appear together: Each pair says whether the projects touch, share a named substation or are simply nearby, with the plan document and PDF page for every fact.
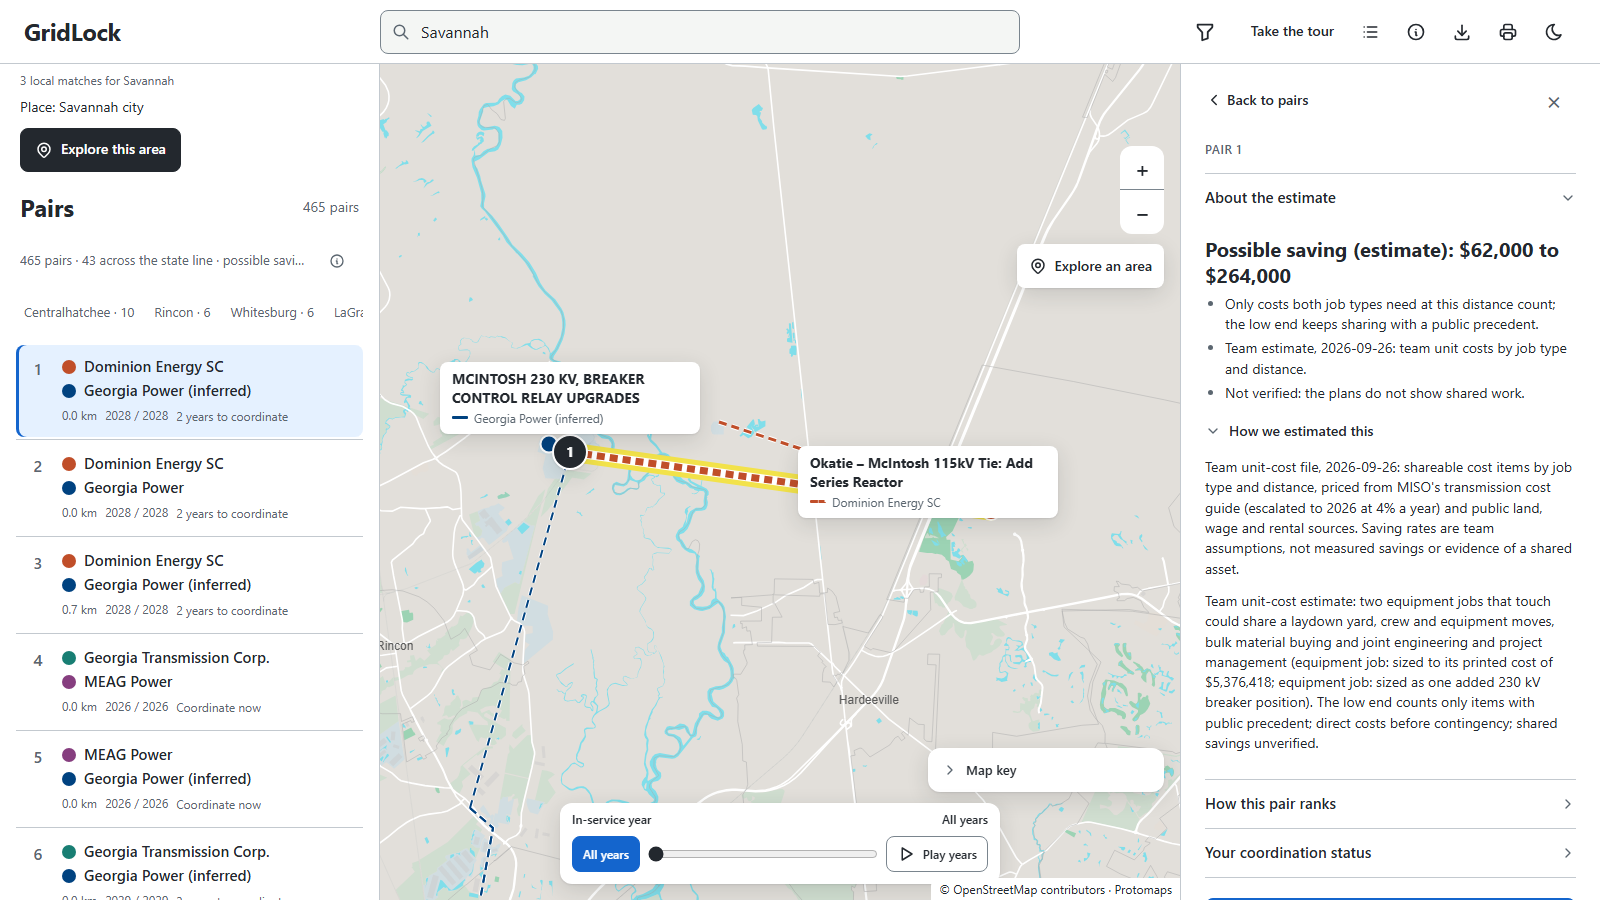
Possible savings: Closer projects can share more: crews and equipment within 40 km, laydown yards within 8 km, land and access roads within 1.6 km, outages and crossings when touching. GridLock counts only the costs both kinds of work need and shows a range from 2026 unit costs, labelled as an estimate.
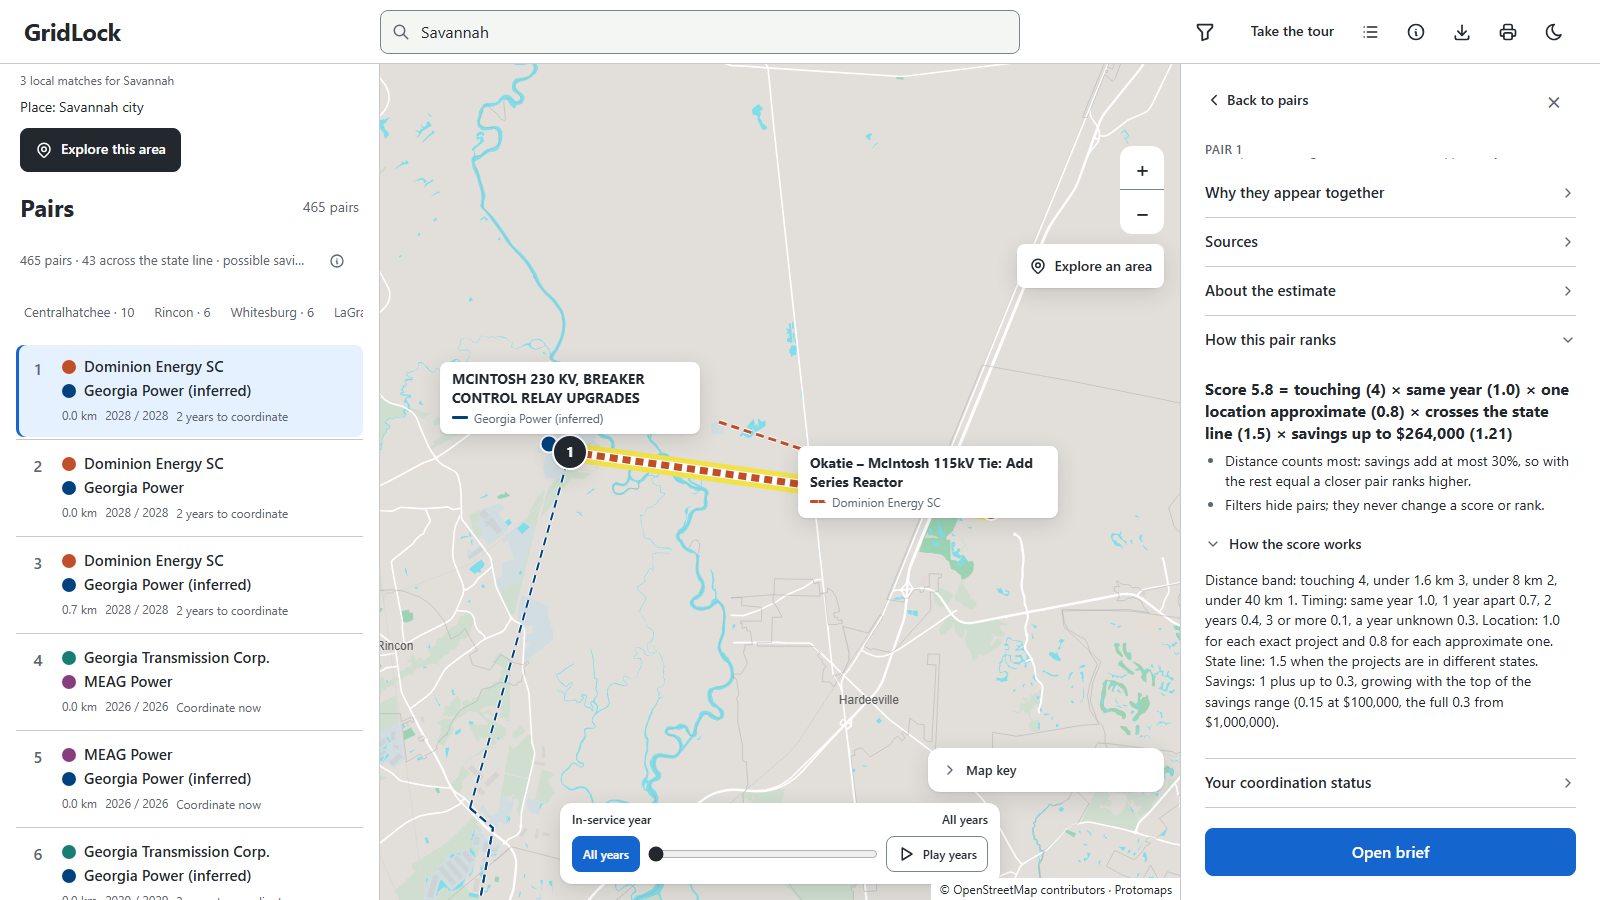
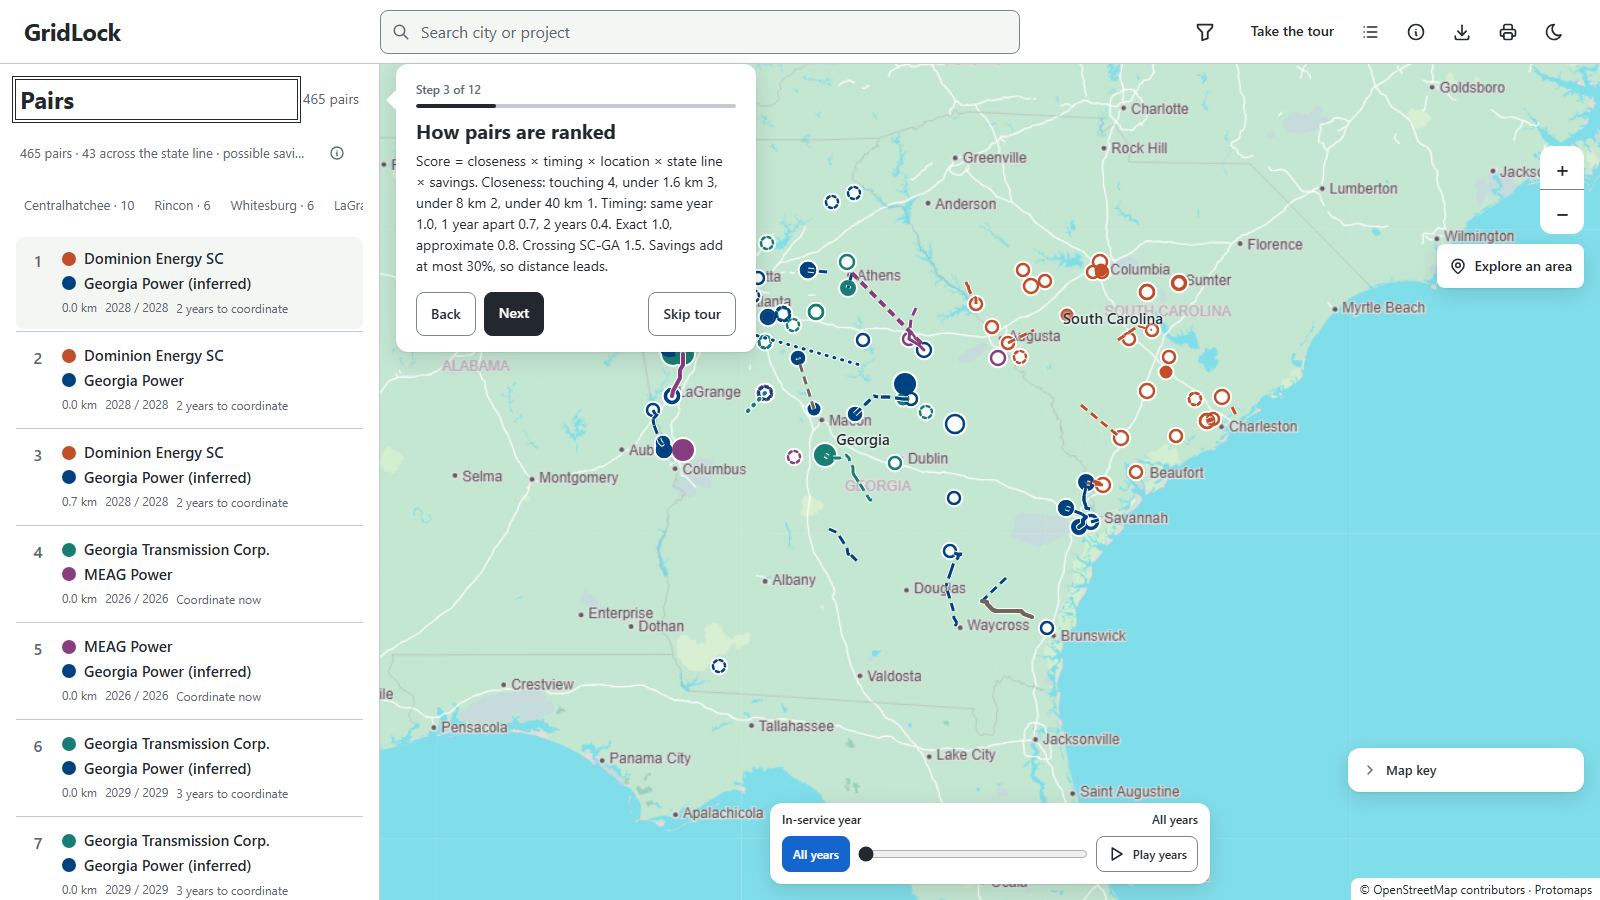
A ranking you can check: score = distance band × timing × location × state line × savings. Every pair shows its score factor by factor; distance always counts most.
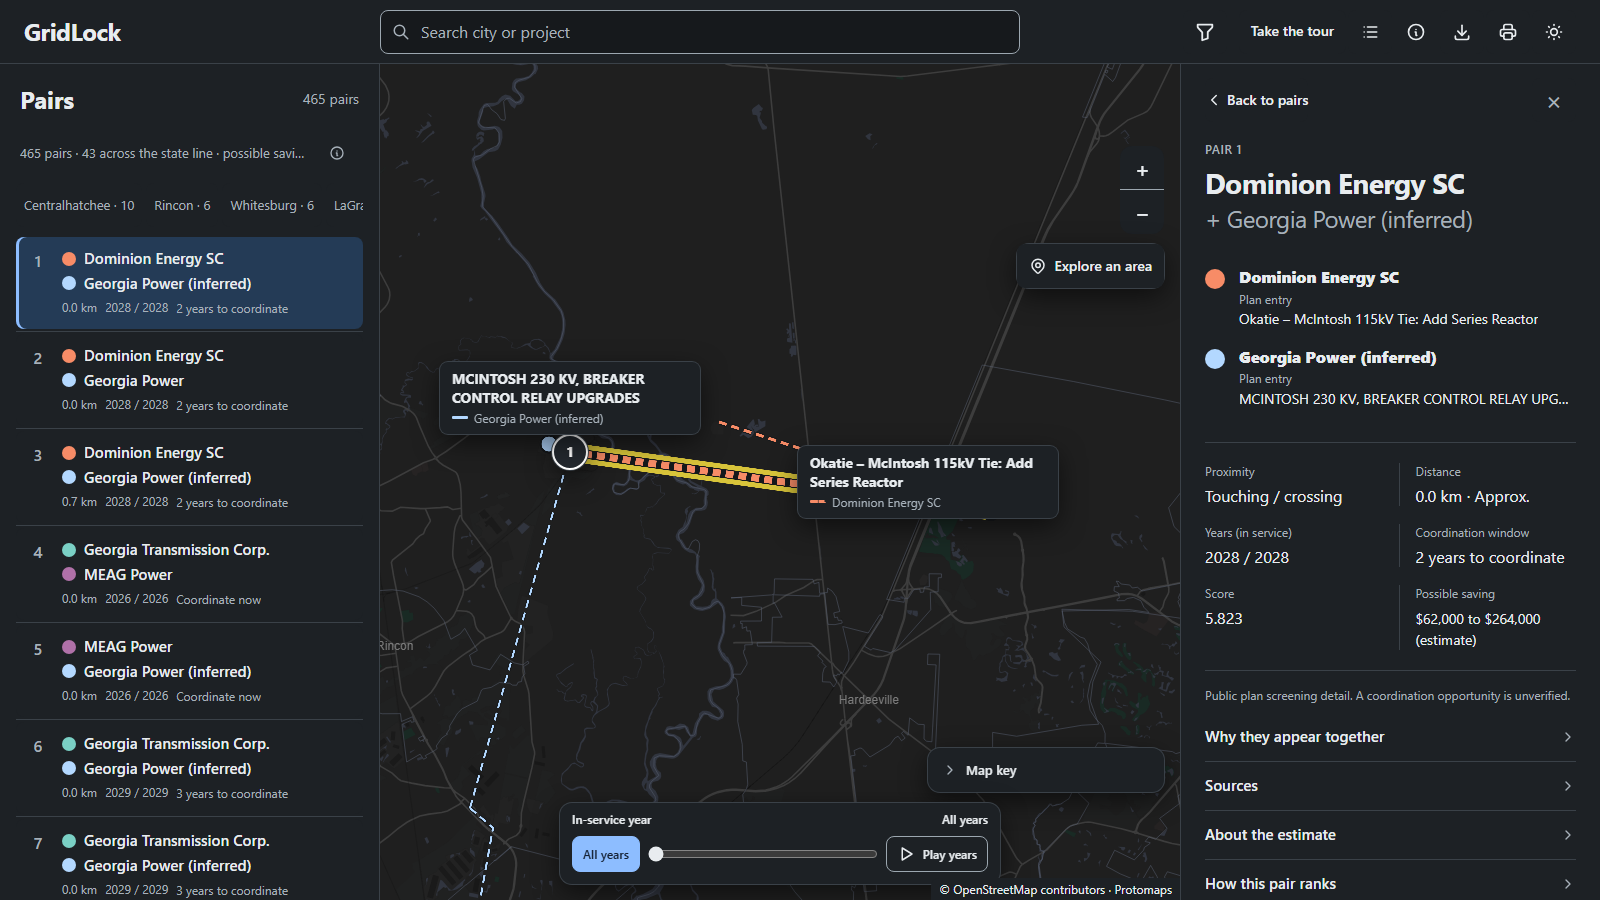
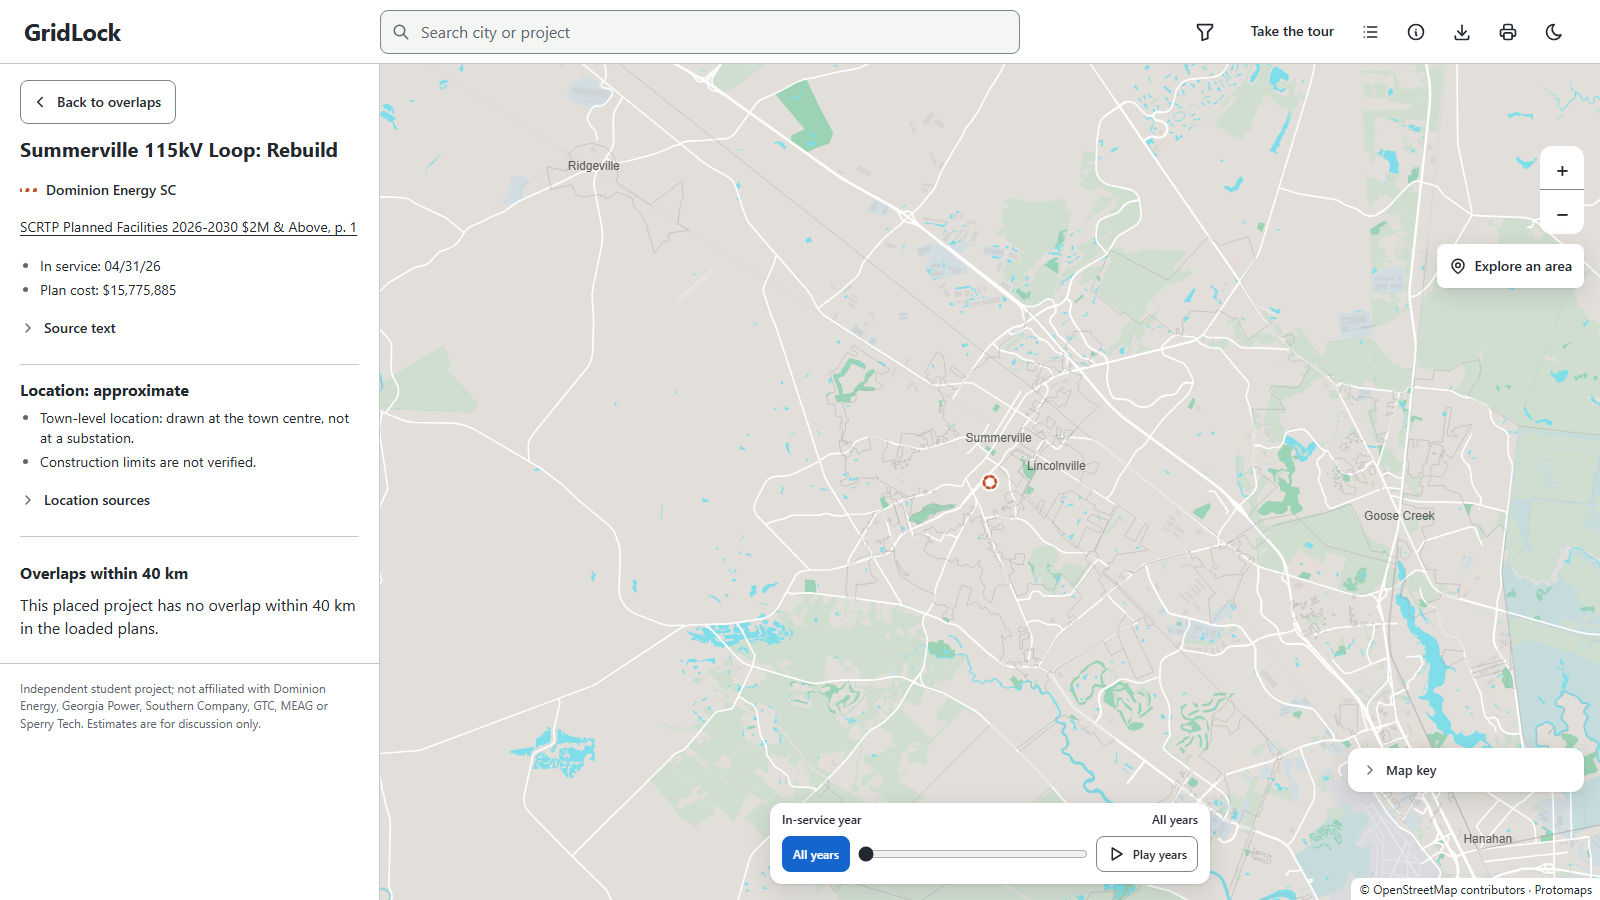
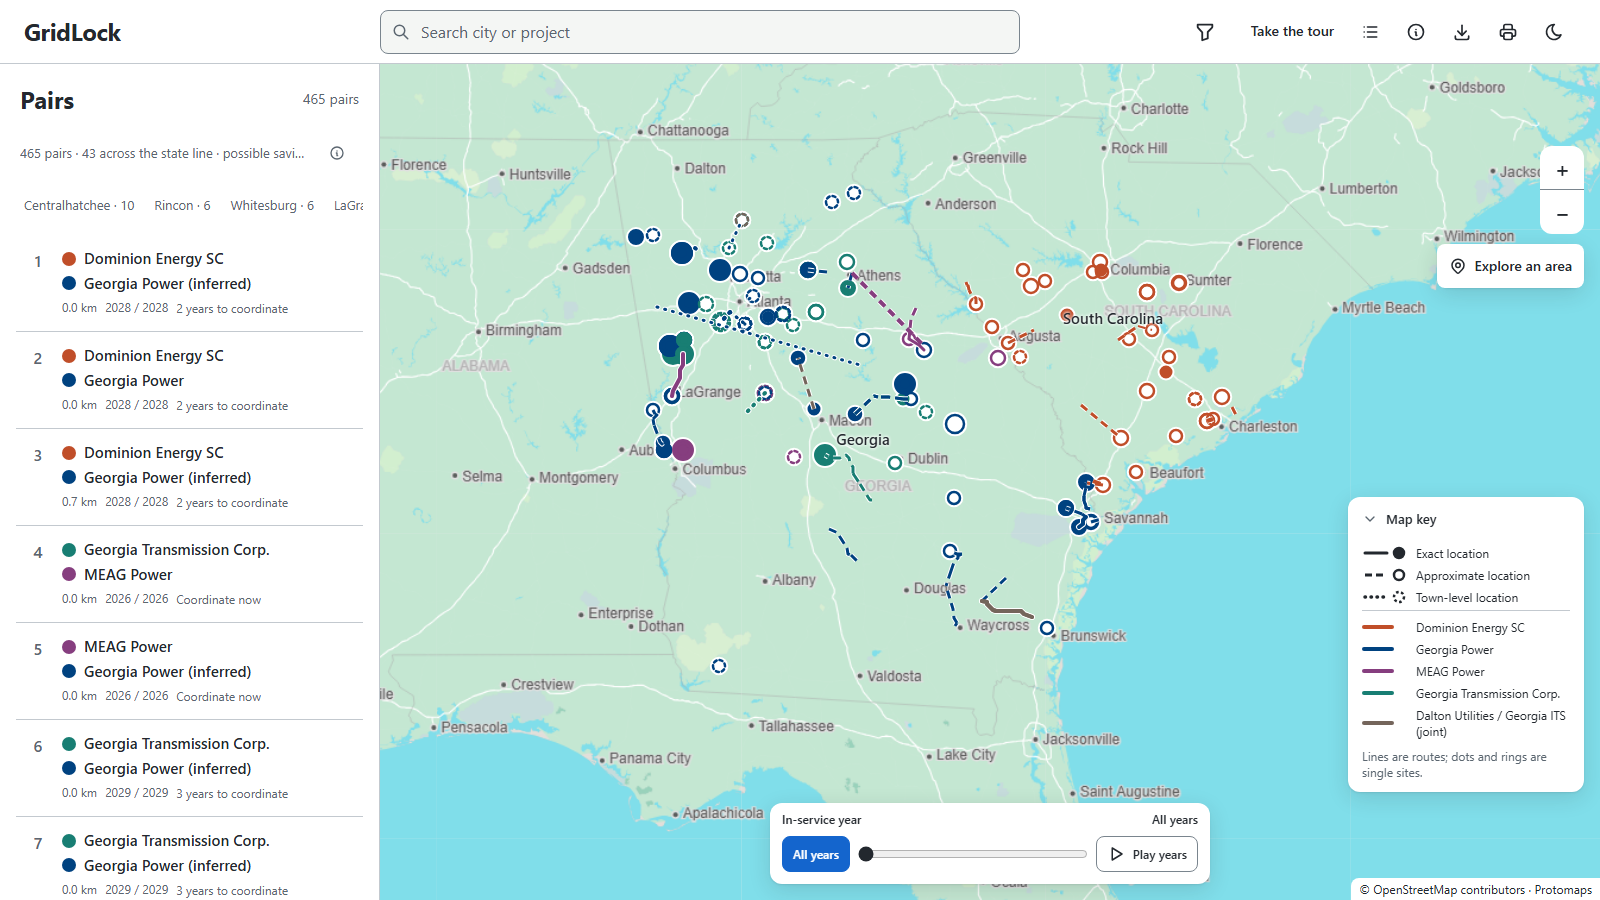
A map-first workspace. Pick a pair and the map zooms to it, thickens its two lines on a halo and marks its rank, while the facts open in the right pane.
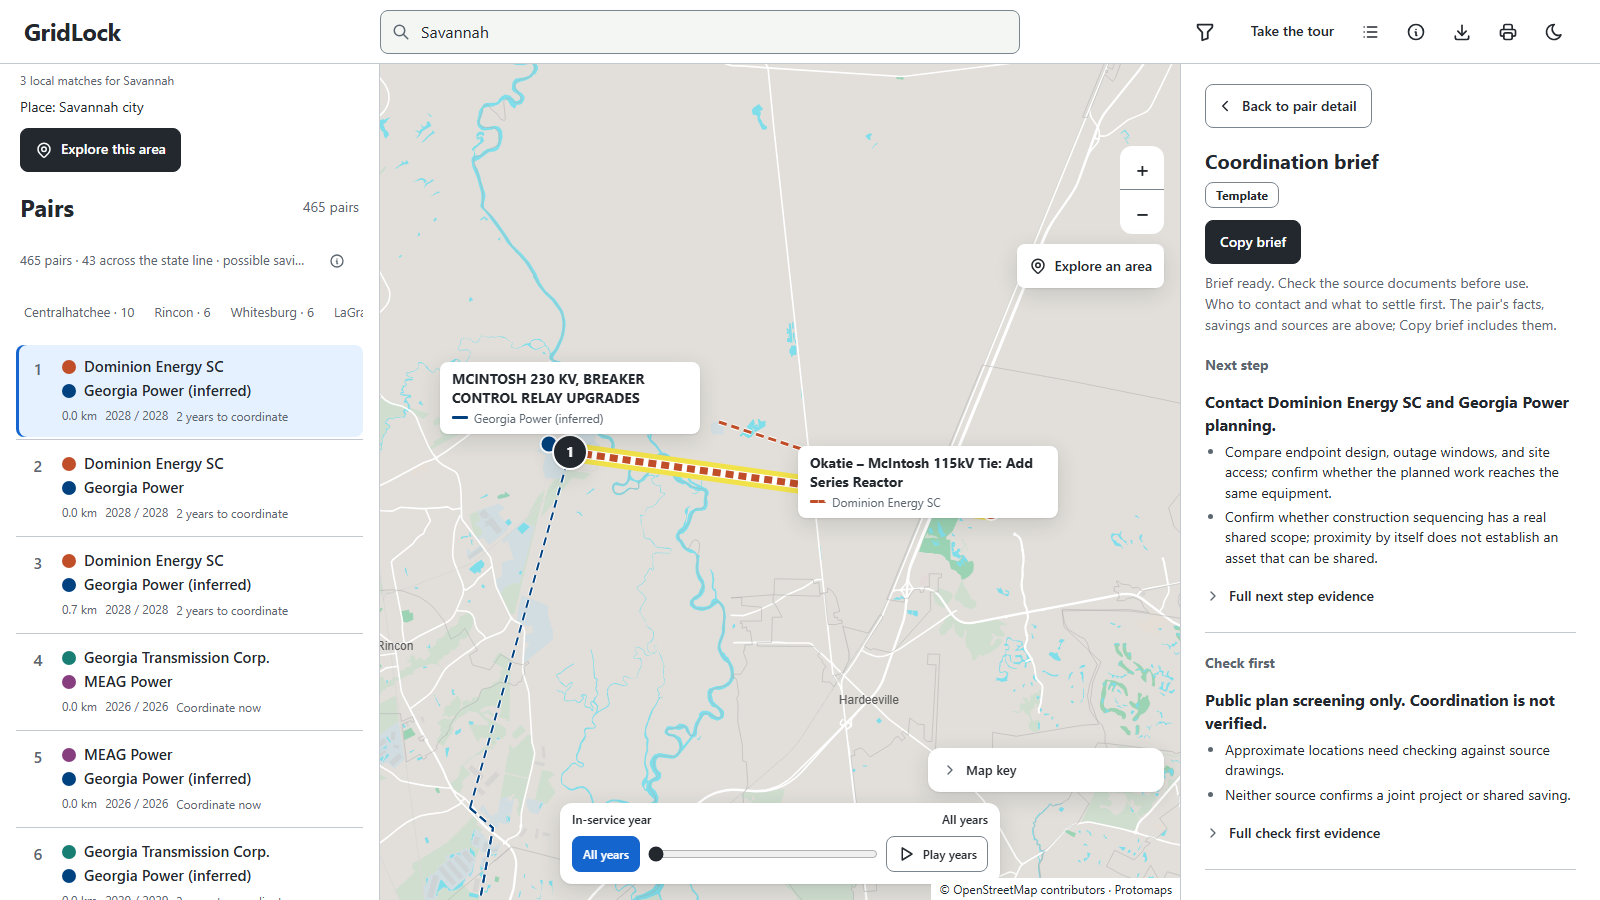
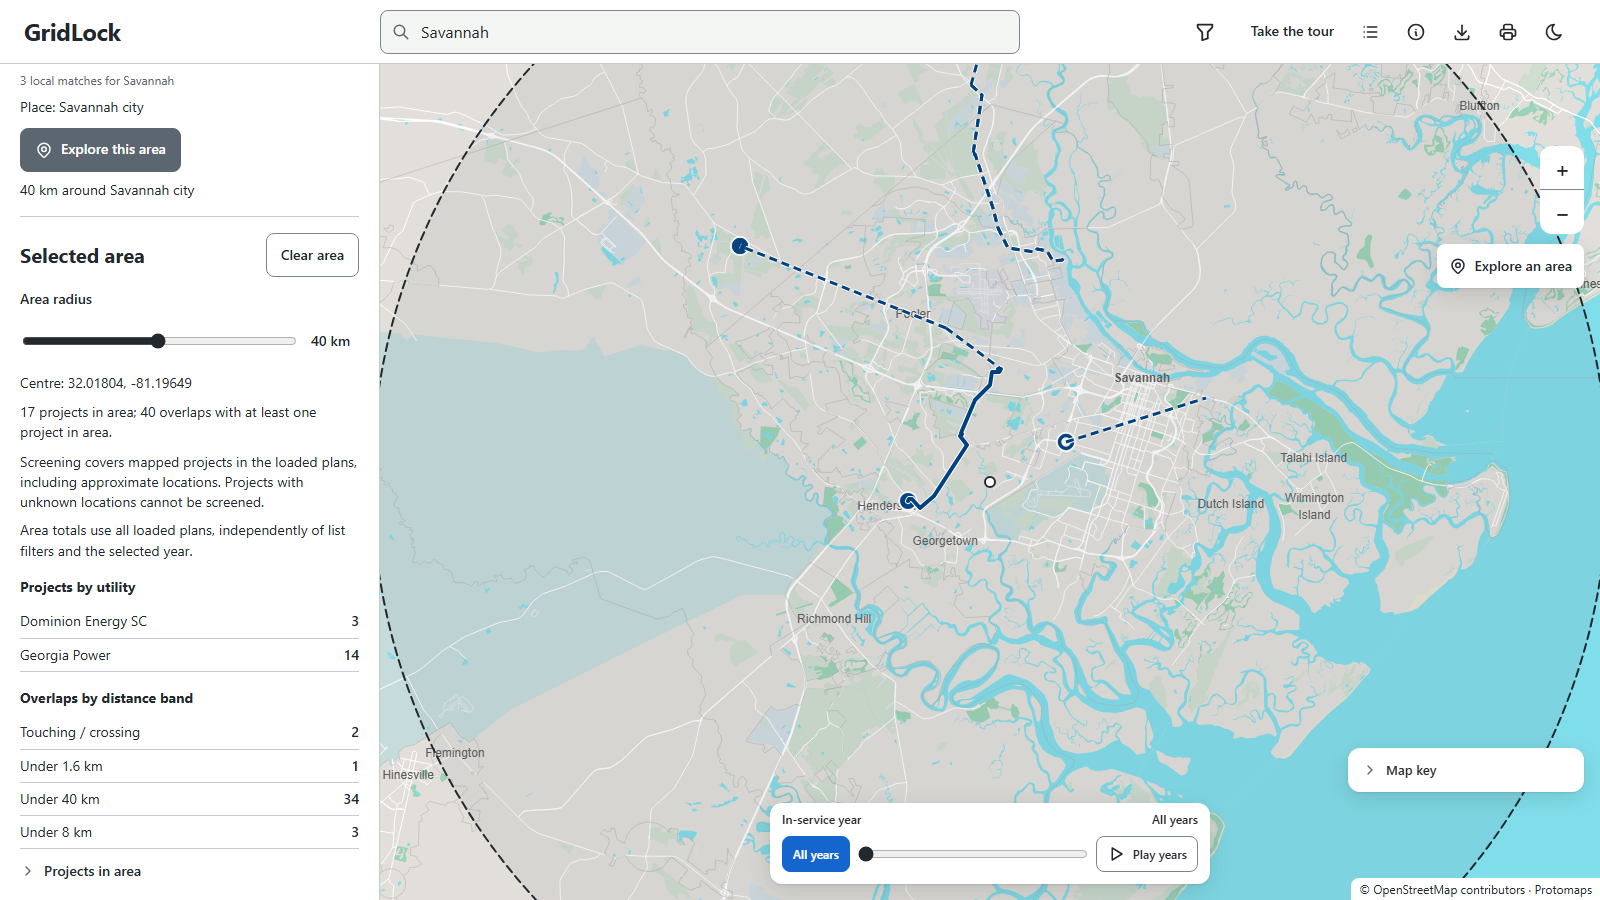
Tools for a planner. "Start here" places, search, filters, an in-service year slider, a 1-80 km area tool, a coordination brief (who to contact and what to settle first), a coordination tracker (status and notes per pair), a key-facts CSV for Excel, a clean Letter report and a guided tour.
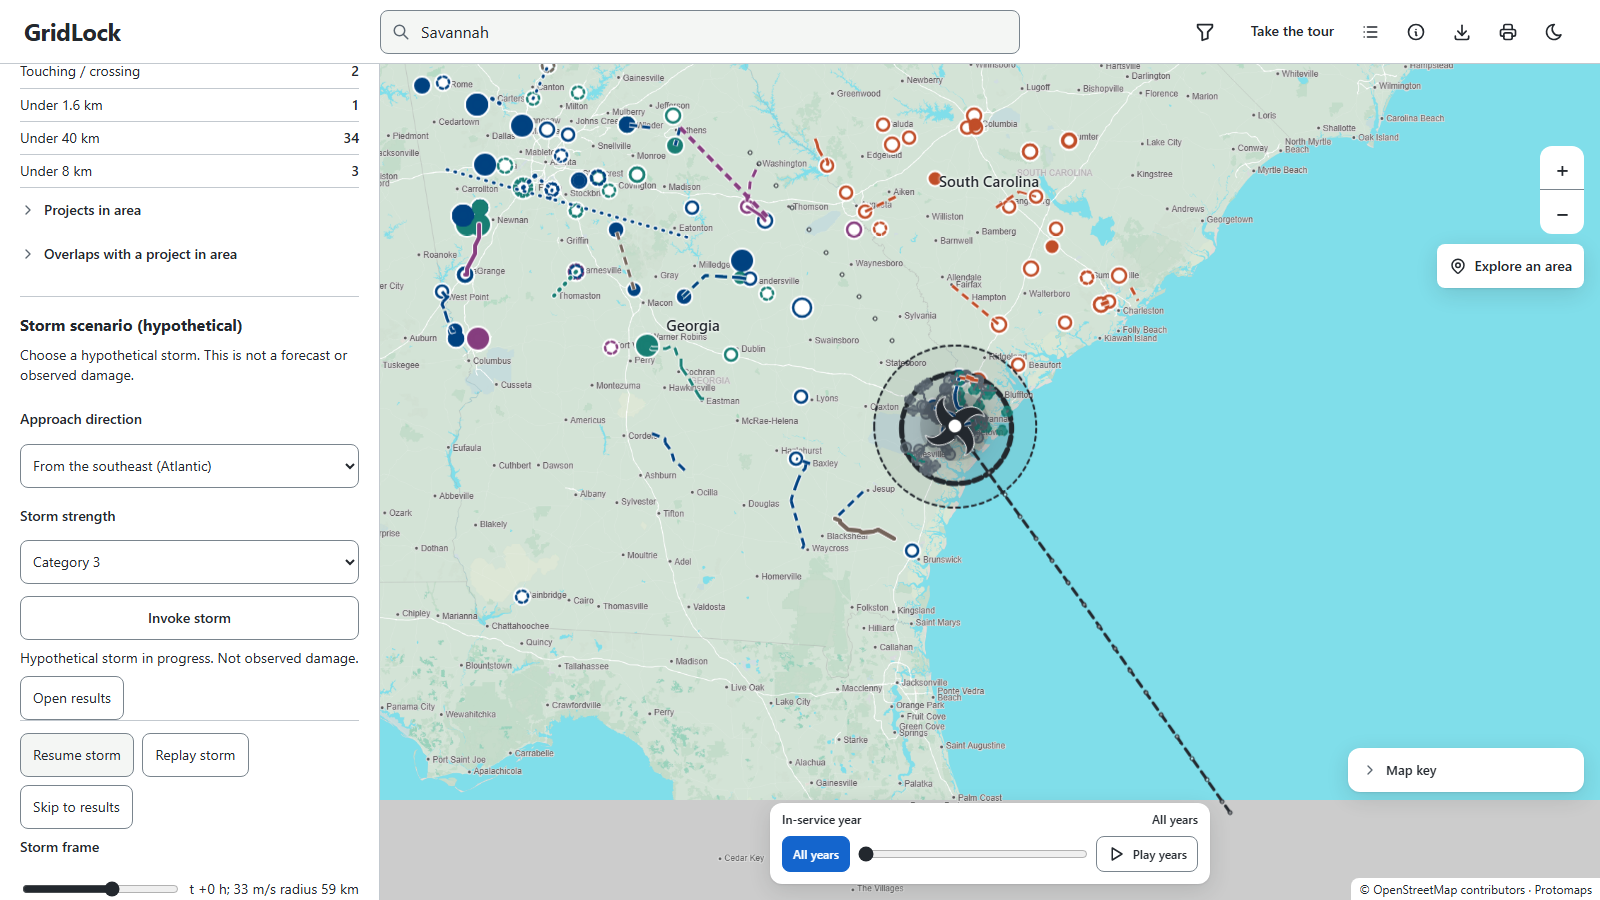
Resilience Lab preview. Pick an area, choose where a hurricane comes from and how strong it is, and watch a hypothetical storm form, cross the area and light up the transmission lines and substations it would damage. The right pane then shows a P10 to P90 repair-cost range (1,000 seeded draws), coverage, the most exposed assets with sources and a recommended next step, or "Requires human review". It is clearly labelled hypothetical: not a forecast, not observed damage.
Ready for AI, safely. An AI-drafted brief path to Claude is built and guarded: fixed rules, a contract check and an evidence grader on every draft. It is off in this build; the app shows an example for the top pair that passes the same grader.
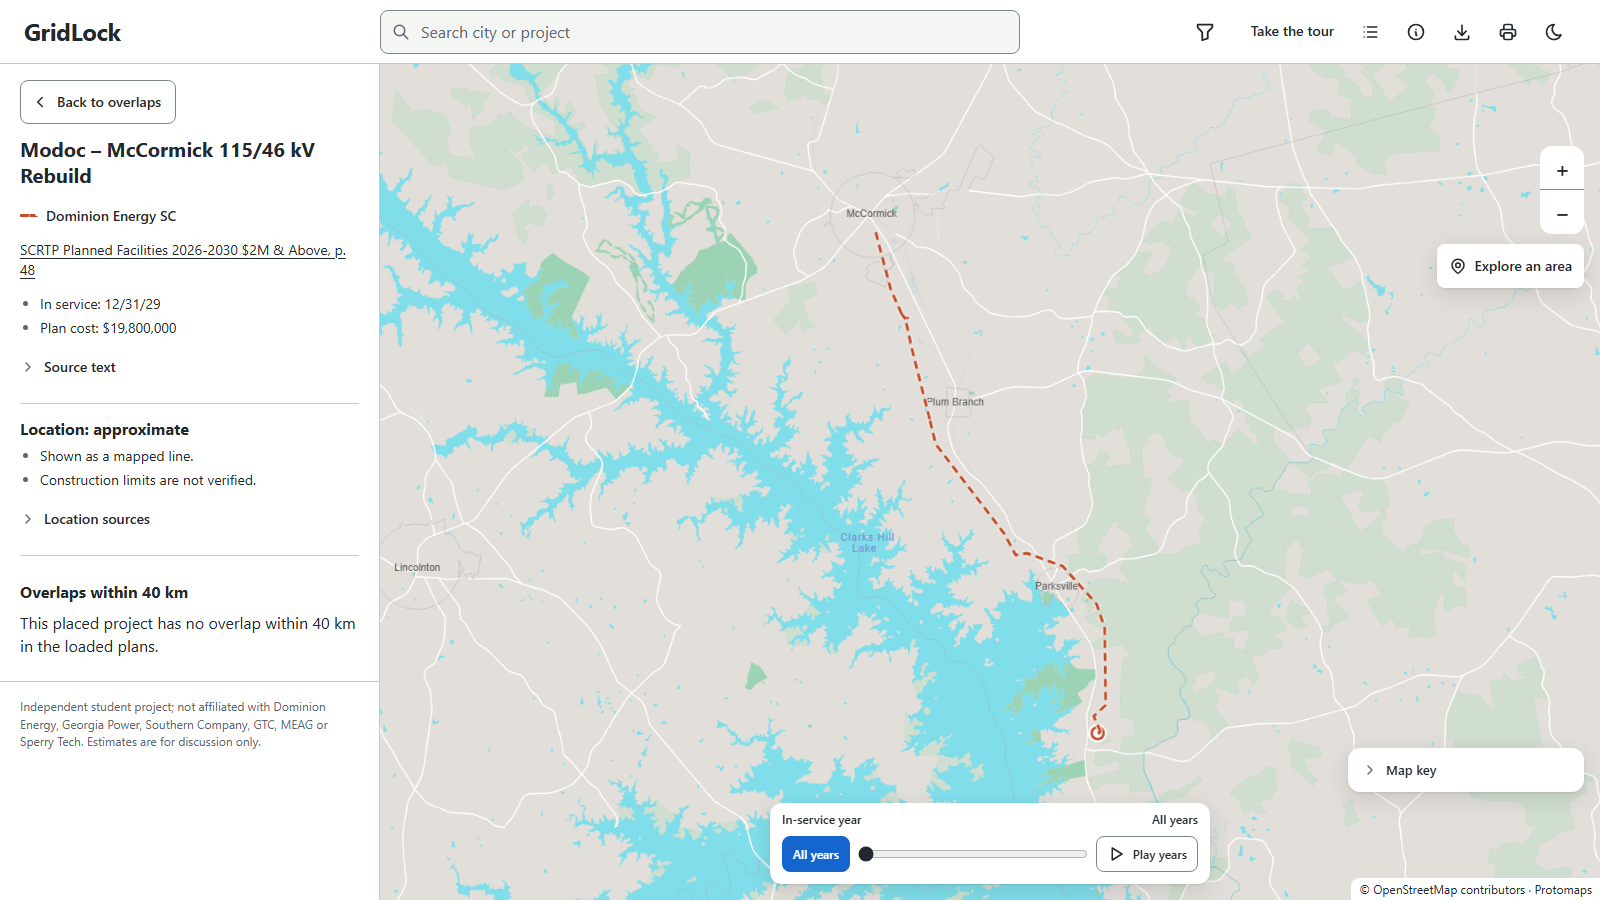
Honest about what it does not know. Approximate locations are dashed, town-level placements are flagged "town only", 49 projects with no known location stay in the list unmapped, and shared work is always "unverified".
It runs on a laptop, offline, from public documents only: python run.py sets it up and starts it on Windows, macOS or Linux.
How we built it
Pipeline (Python): pypdf extracts 481 plan rows with their real PDF pages. Shapely and pyproj match substation names to OpenStreetMap substations and HIFLD transmission line ends, route lines along the existing network, and measure nearest-point geodesic distances. The team's unit-cost file prices what two jobs could share. Every output is checked against Pydantic data contracts, and rebuilds are byte-identical.
Server (FastAPI): loopback only, with a Content Security Policy, short JSON errors and read-only routes for projects, pairs, search, areas, briefs, CSV, the source PDFs and the storm preview. The storm engine runs a Holland wind field along a synthetic track through the chosen area, illustrative fragility curves, repair ratios on the team's unit costs and a seeded Monte Carlo.
Web app: plain JavaScript modules with Leaflet and an offline OpenStreetMap street map (Protomaps), plus an optional Google Maps and Satellite view. A map-first layout, an animated hurricane, light and dark themes, keyboard use and a phone layout.
Tests: 852 automated tests: pipeline, API, brief grading and Playwright browser tests, including axe-core accessibility audits.
AI tools: we built GridLock with two AI coding agents. OpenAI Codex (
gpt-6-sol, andgpt-6-astrafor the map-first redesign) built the app as a lead agent with parallel sub-agents, each behind a test gate. Anthropic's Claude (Opus) wrote the spec, data contracts and design direction with us, then reviewed and improved the delivered build.
Challenges we ran into
The plans name substations, not coordinates. We matched names to public map data, drew real routes only where a line joins both ends, followed the existing network only when the route is plausible, and flagged town-centre fallbacks. 49 projects stay unknown rather than guessed.
Costs. Only Dominion's plan prints costs; SERTP's cost figures are use-restricted, so Georgia jobs are sized by stated miles or a reference job from the team's unit-cost file.
Data access. The free federal line layer (HIFLD Open) was retired in 2025, so we use an archived copy. Some SERTP page headers read "(CEII)" although SERTP posts the plan publicly; we use only that public document.
Staying honest. Every number had to trace to a page or a stated assumption, and every estimate had to say so.
Accomplishments that we're proud of
465 ranked pairs, each with page citations, from two public PDFs.
The top pair is real and checkable: Dominion's Okatie-McIntosh tie and Georgia Power's McIntosh relay upgrades both name McIntosh, both enter service in 2028, and they cross the state line (score 5.8, possible saving $62,000 to $264,000).
Every rank can be checked by hand, and the data contracts reject a score that does not match its parts.
It works fully offline and is tested end to end, including accessibility audits.
What we learned
Public infrastructure plans are published as documents, not data, and location is the hard part. Clear labels (exact, approximate, town only, estimate, unverified) matter as much as the ranking.
What's next for GridLock
- More utilities along the boundary, such as Duke Energy's South Carolina territory.
- SERTP's 2026 preliminary plan, and what changed from 2025.
- Construction windows: the actual construction schedules behind each in-service date.
- Cost and route data shared with permission, to replace the town-level and reference-job fallbacks.
- The full Resilience Lab: historical storm replays, flood and surge layers, published fragility curves, and an AI decision assistant behind a human-review gate.
Built With
- axe-core
- claude
- css3
- fastapi
- hifld
- html5
- javascript
- leaflet.js
- numpy
- openai-codex
- openstreetmap
- playwright
- protomaps
- pydantic
- pypdf
- pyproj
- pytest
- python
- shapely

Log in or sign up for Devpost to join the conversation.