-
-
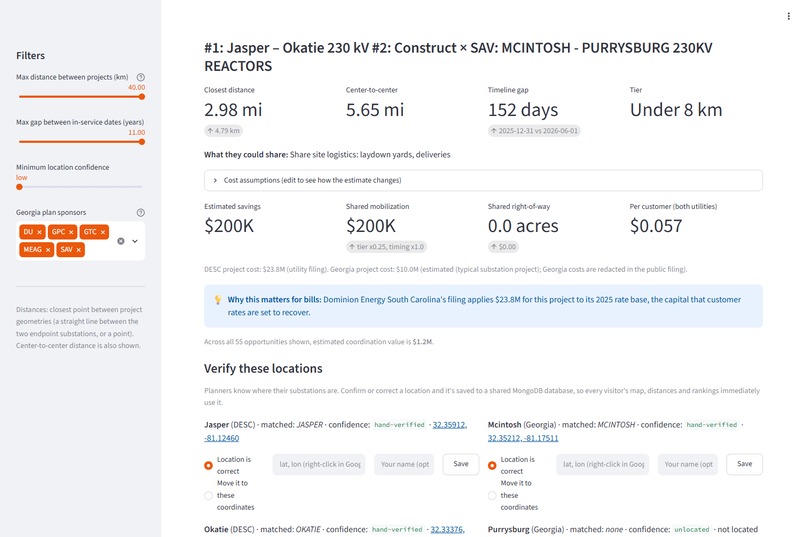
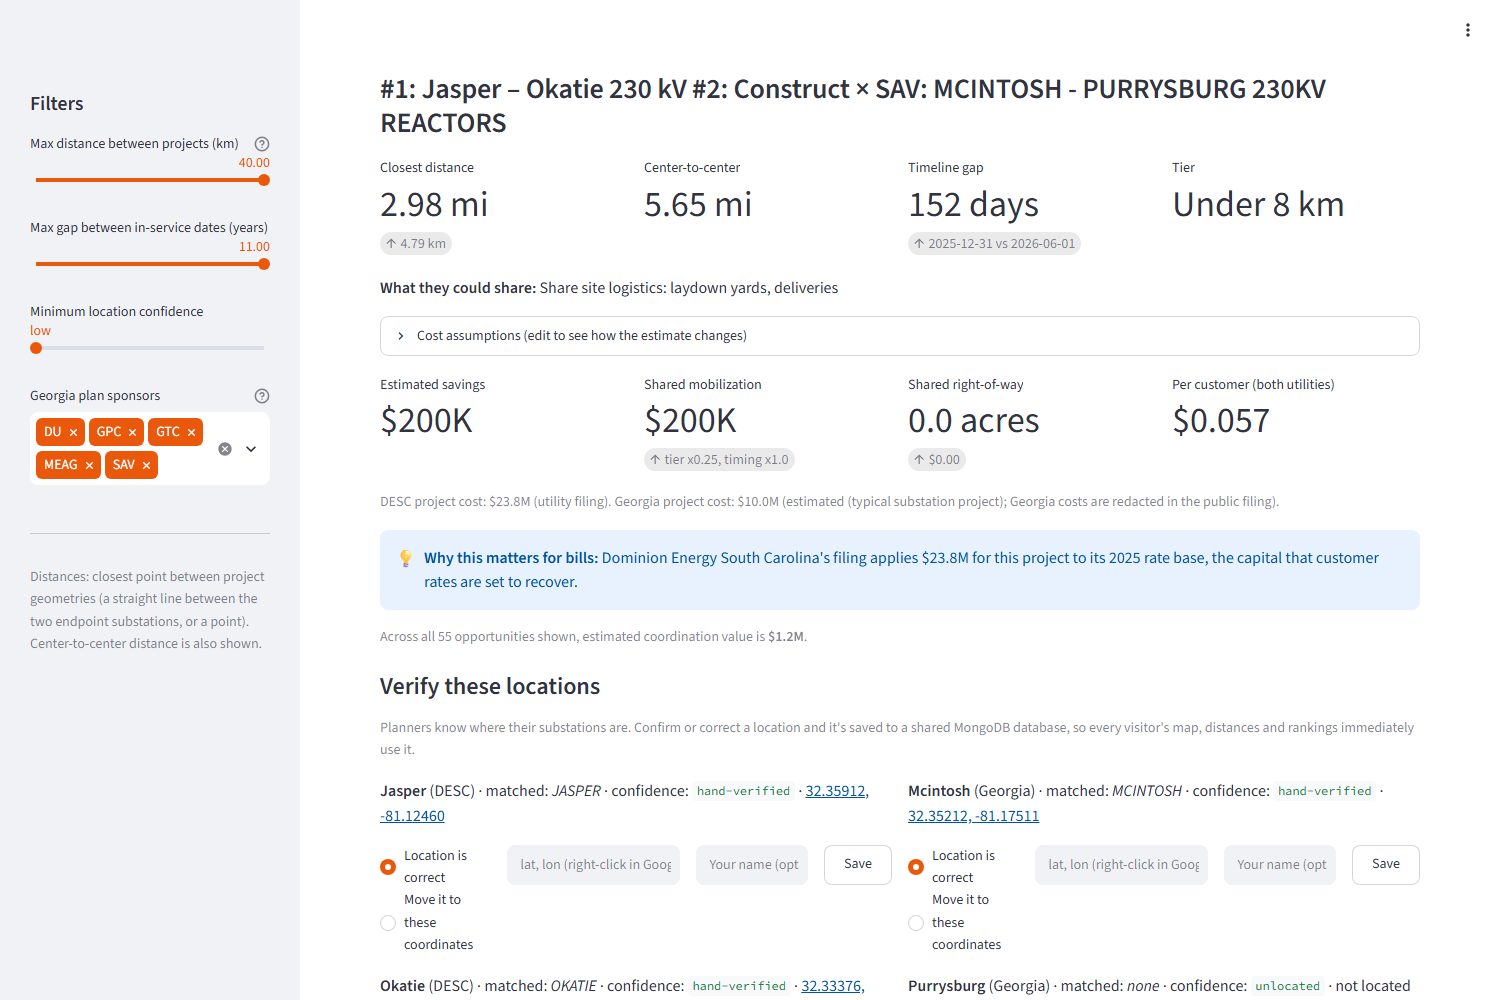
Top opportunity: distances; cost estimate, rate-base note
-
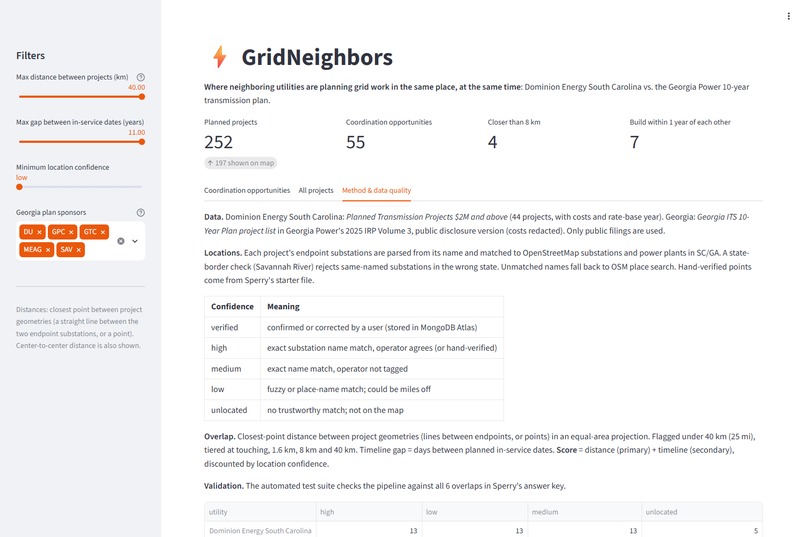
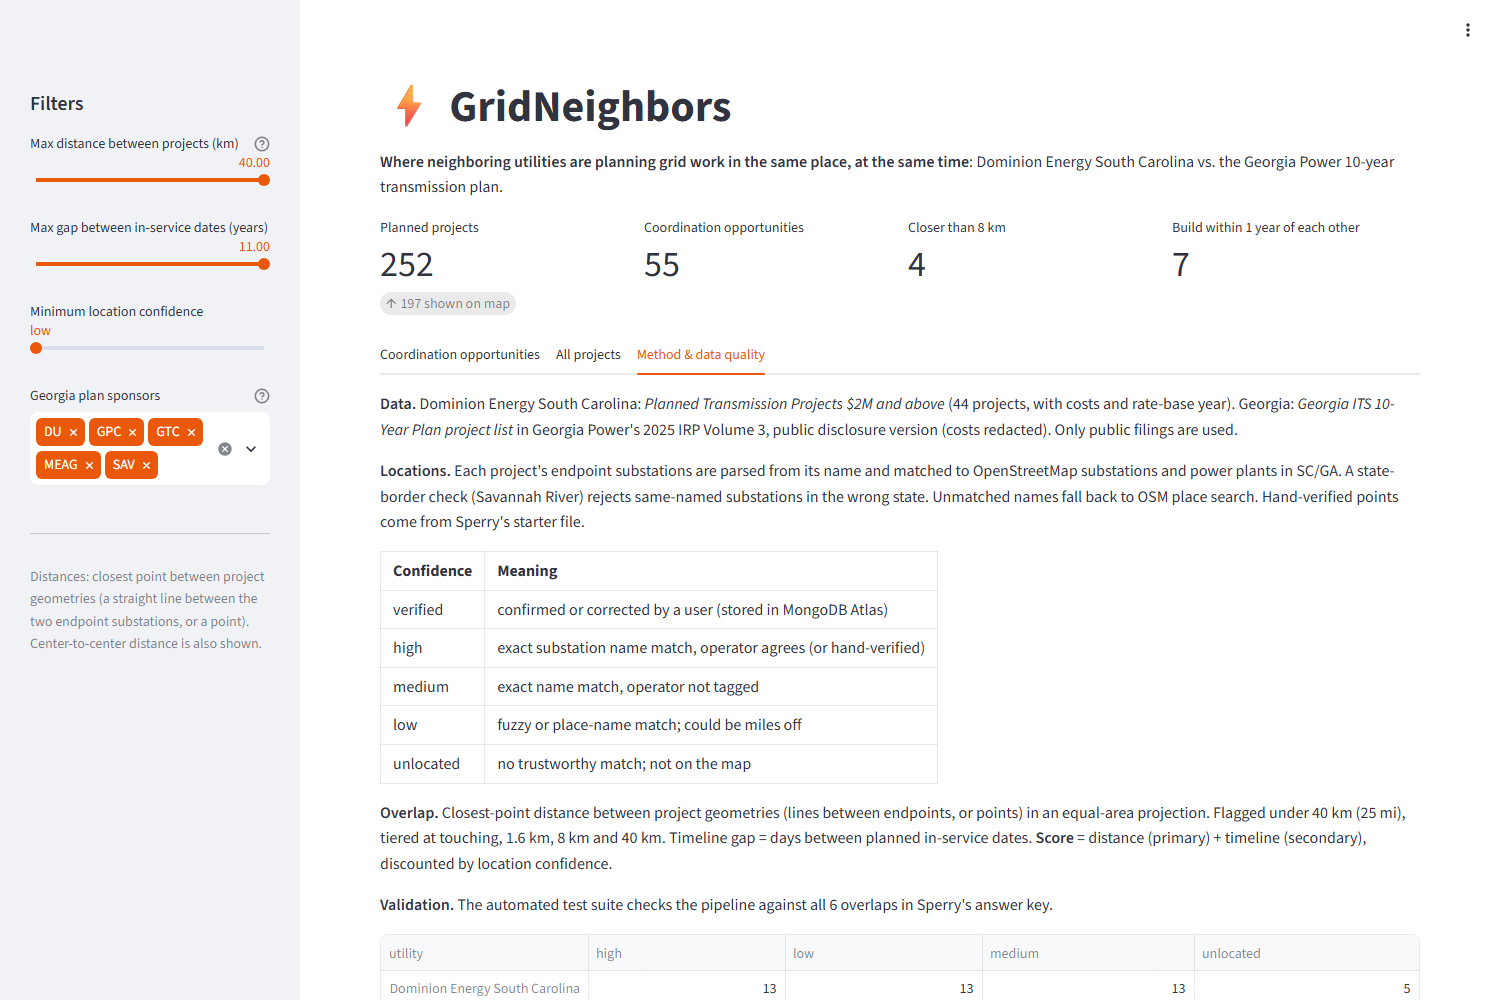
Method and the data quality tab
-
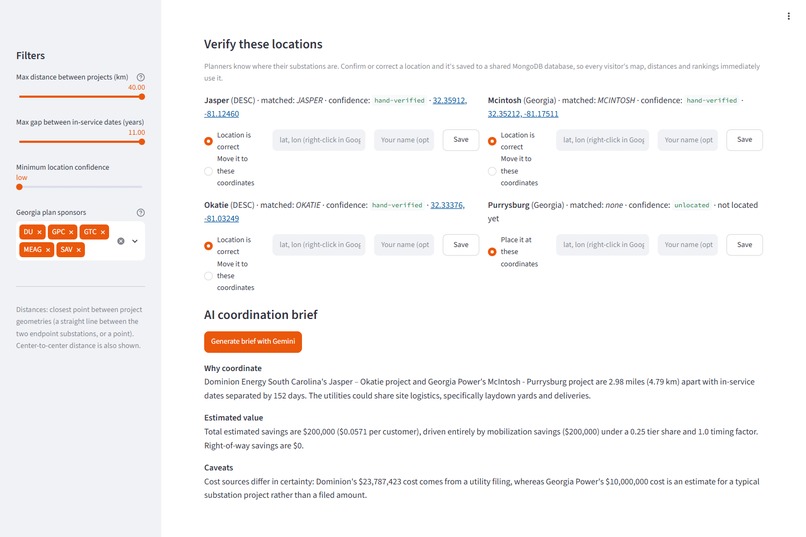
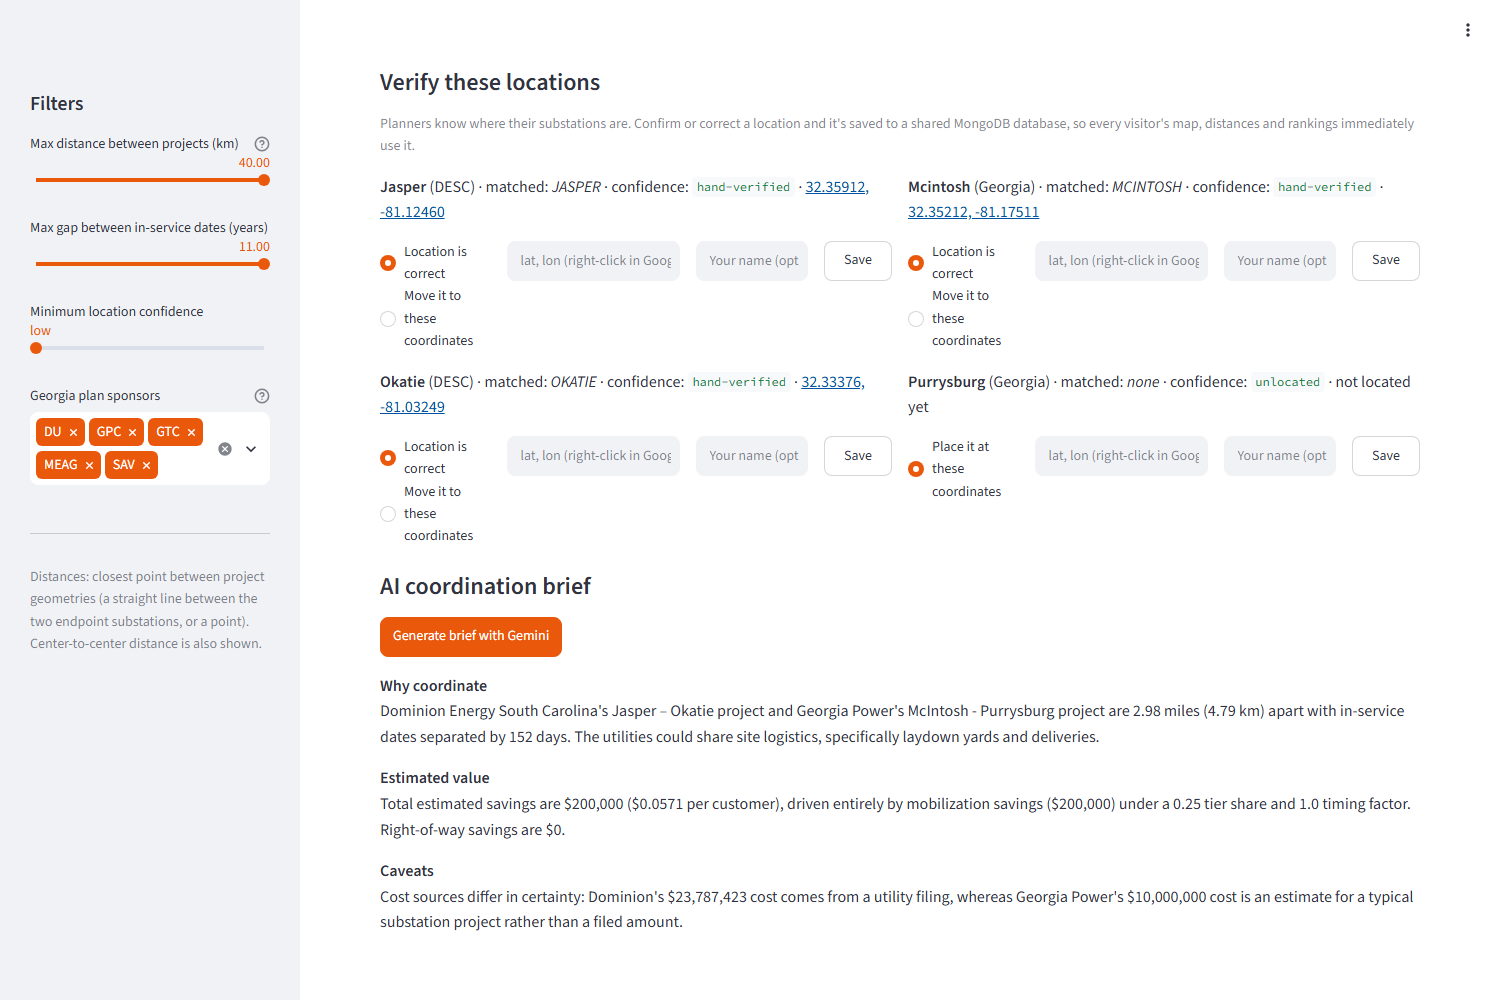
Location verification (MongoDB) and the Gemini brief
-
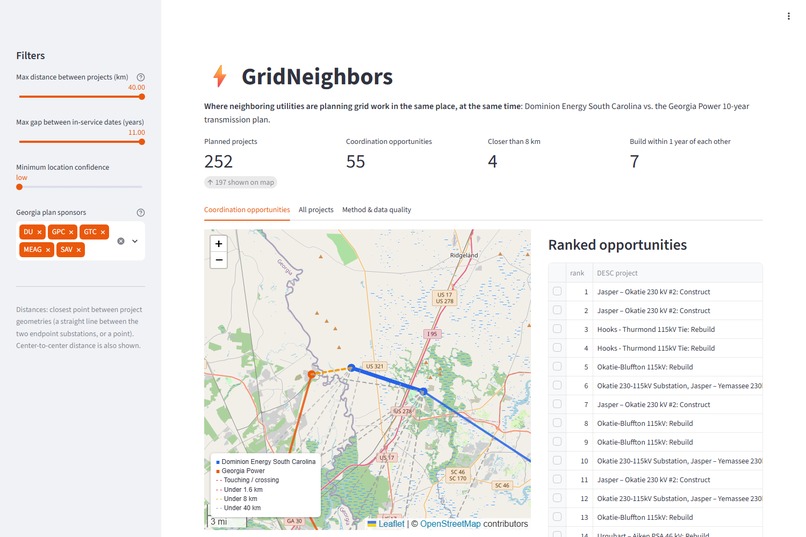
Map with both utilities, the overlaps, and the ranked table
-
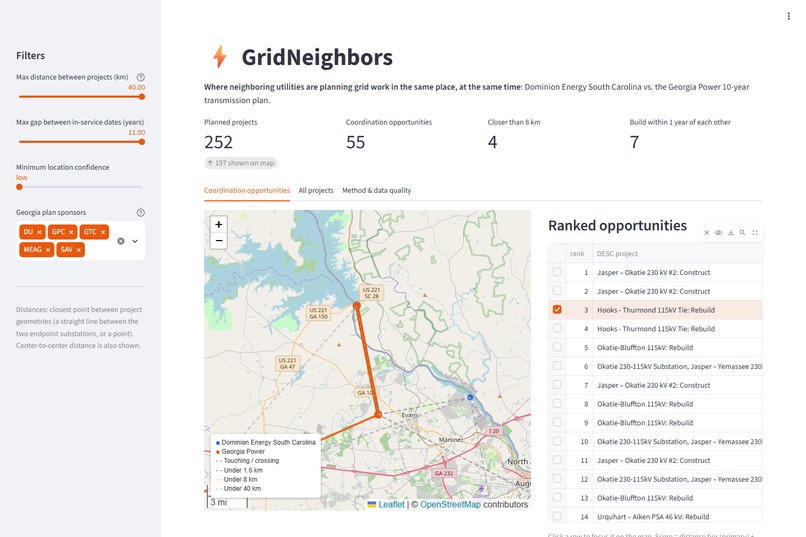
The Thurmond Dam pair, where both utilities build into the same substation
Inspiration
Every power line a utility builds goes into its rate base, the capital that customers' electric bills are set to pay back. Data centers and new factories are driving record grid construction across the Southeast, yet neighboring utilities, often in different states, still plan that work separately. Two crews can rebuild lines a few miles and a few months apart, each paying for its own mobilization, equipment and land. FERC issued Order No. 1920 in 2024 because of exactly this kind of siloed planning. Sperry Tech's GridLock challenge asked for a tool that makes these overlaps visible, and I wanted to connect them back to what customers pay.
What it does
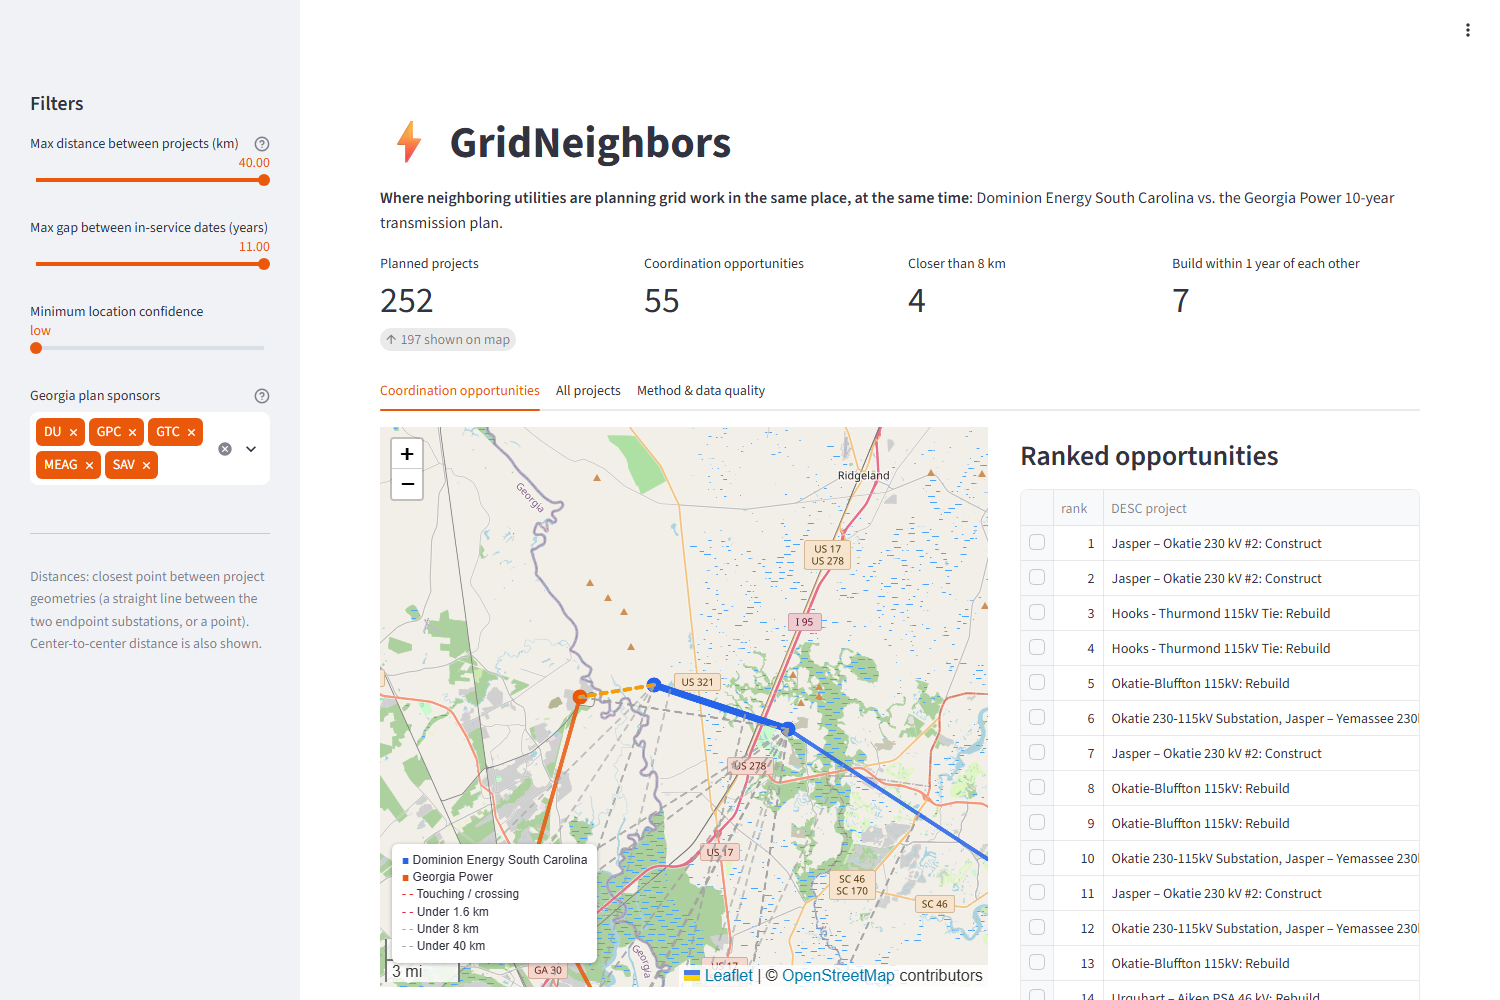
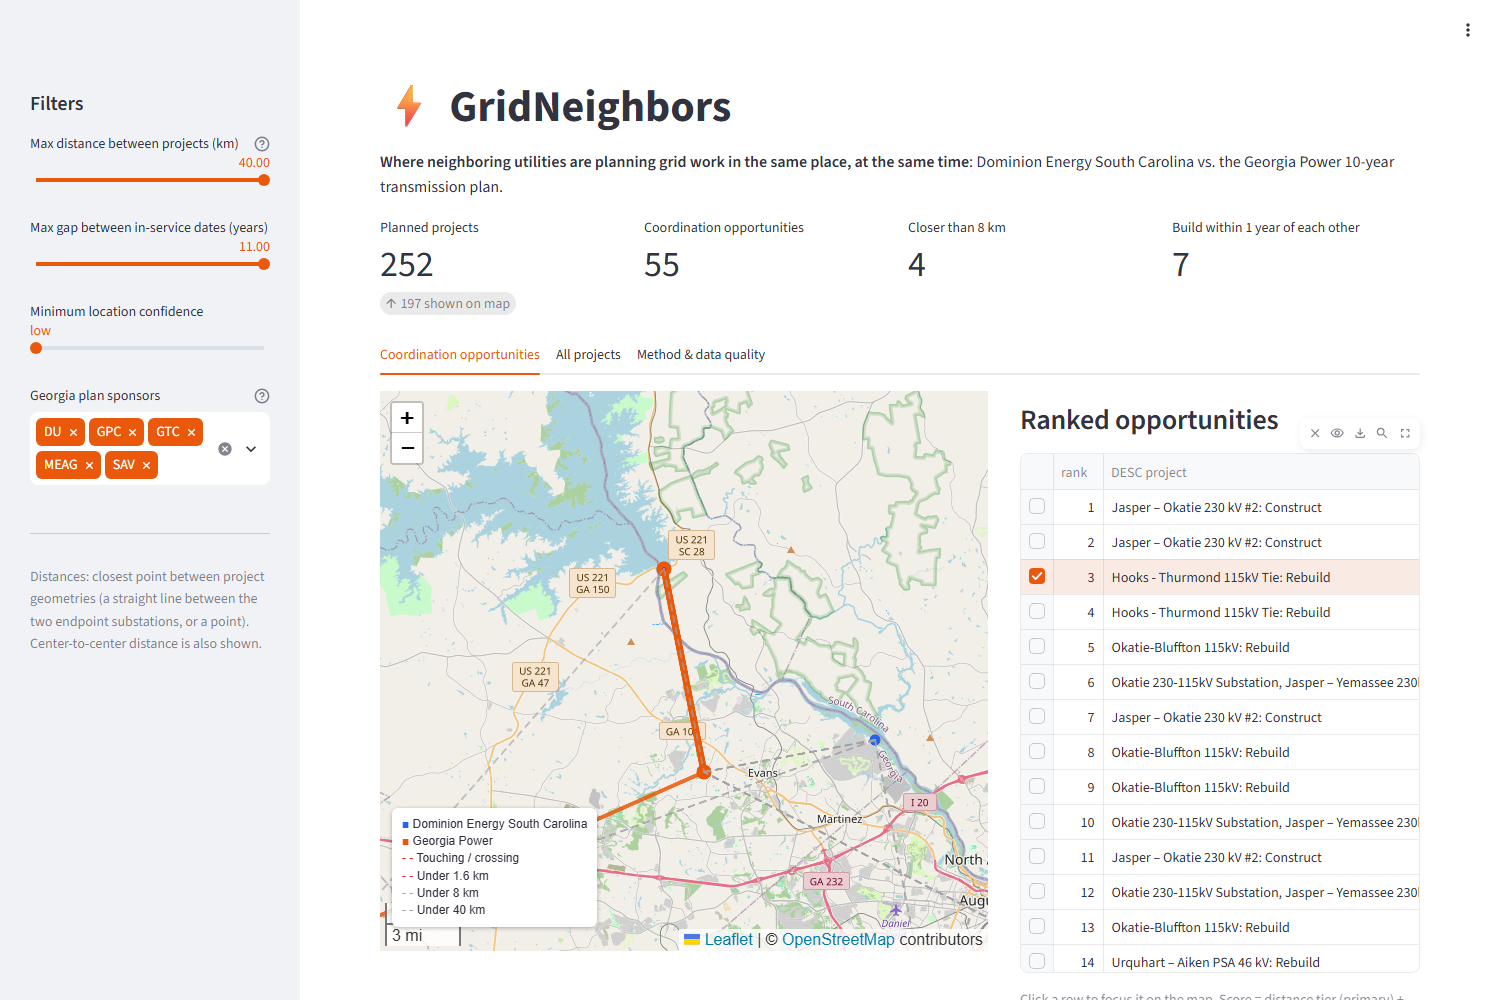
GridNeighbors compares the public construction plans of Dominion Energy South Carolina and Georgia's 10-Year Transmission Plan (Georgia Power and its planning partners), neighbors across the Savannah River.
- Reads the utilities' own filings: 252 planned projects parsed from their PDFs, with in-service dates and, for Dominion, costs and the rate-base year
- Maps every project by matching its endpoint substations to OpenStreetMap, with a confidence grade for each location
- Finds 55 cross-utility overlaps within 40 km (25 mi), measured between the two projects' closest points and grouped into Sperry's tiers: touching (must coordinate), under 1.6 km (share right-of-way), under 8 km (share laydown yards), under 40 km (share crews)
- Ranks the opportunities, with distance as the main signal and timing as the second
- Estimates what coordinating is worth (shared mobilization and shared land) with editable assumptions, down to the savings per customer
- Explains each opportunity with Gemini in a short, planner-ready brief built only from numbers the code computed
- Gets more accurate with use: anyone can confirm, correct or place a substation location. It's saved to MongoDB Atlas and immediately updates everyone's map and rankings.
Top finding: Dominion's new Jasper–Okatie 230 kV line and Georgia Power's McIntosh–Purrysburg 230 kV project near Savannah are 2.98 miles apart and finish 152 days apart, worth roughly USD 200K in shared logistics. Dominion's filing puts USD 23.8M of that project into its 2025 rate base.
How I built it
- Parsing:
pdfplumberandpypdfread Dominion's project sheets and the 10-year project table inside Georgia Power's 668-page IRP volume - Geocoding: about 6,500 substations and power plants from the OpenStreetMap Overpass API, exact-then-fuzzy name matching, a Nominatim fallback, and a hand-built state-border model (Savannah River, NC and FL lines) that rejects same-named substations in the wrong state
- Overlap engine:
Shapelyandpyprojmeasure closest-point distances in an equal-area projection - Cost model: plain Python with every assumption visible; the LLM never produces a number
- Google Gemini API: grounded briefs with fallback across models, plus cached briefs for the top 15 opportunities
- MongoDB Atlas (
pymongo): community location verifications, applied on top of the automated matches on every load - Streamlit and Folium for the linked map, ranked table and detail panel
- pytest: 19 tests, including checks that reproduce all 6 overlaps in Sperry's answer key
- Deployed on DigitalOcean App Platform (auto-deploys from GitHub) at gridneighbors.design, a GoDaddy Registry domain
Each pair gets a score out of 100:
$$\text{score} = w\left[45\left(1-\frac{d}{40\ \text{km}}\right) + \tfrac{1}{2}P + 35\max\left(0,\ 1-\frac{\Delta t}{1095\ \text{days}}\right)\right]$$
Here d is the closest distance, P is the tier bonus (40, 30, 15 or 0 points), Δt is the gap between in-service dates, and w is the location-confidence weight (1.0 for high or verified, 0.9 for medium, 0.7 for low).
Challenges I ran into
- The plans have no coordinates. A project is just a name like "SAV: GOSHEN (SAV) - MCINTOSH 115KV LINE REBUILD", which had to become two points on a map.
- Same names, wrong places. Early matches put a South Carolina substation in Summerville, Georgia, and a Georgia project in Jacksonville, Florida. Georgia even has two substations named Goshen. A border model, zone-aware overrides and distance checks fixed these.
- Redacted costs. Georgia's public filing blacks out every dollar figure, so those costs are estimated and labeled that way.
- A reliable AI in a live demo. Gemini demand spikes stalled some requests for over a minute, so I added fast-fail timeouts, model fallback and caching.
Accomplishments that I'm proud of
- It reproduces every overlap in the sponsor's answer key straight from the raw PDFs, and finds 55 opportunities across the full 10-year plan instead of the starter file's 10 sample projects.
- Every number is traceable: each project links to its filing page, each location has a confidence grade, and each cost assumption can be edited.
- It's live at a real domain, built solo at my first hackathon.
What I learned
How transmission planning and rate base actually work (IRPs, SERTP and SCRTP, FERC Order 1920); that geocoding messy infrastructure names is mostly about rejecting wrong matches; and to keep the LLM out of the math: code computes, AI explains.
What's next for GridNeighbors
More utility pairs (Duke, Santee Cooper), real line routes from OpenStreetMap instead of straight lines, alerts when a new filing lands near a neighbor's planned work, and a ZIP-code view that shows customers the grid projects near them and how those costs reach their electric bill.
Built With
- digitalocean
- folium
- gemini-api
- github
- godaddy-registry
- mongodb-atlas
- nominatim
- openstreetmap
- pandas
- pdfplumber
- pymongo
- pypdf
- pyproj
- pytest
- python
- shapely
- streamlit

Log in or sign up for Devpost to join the conversation.