-
-
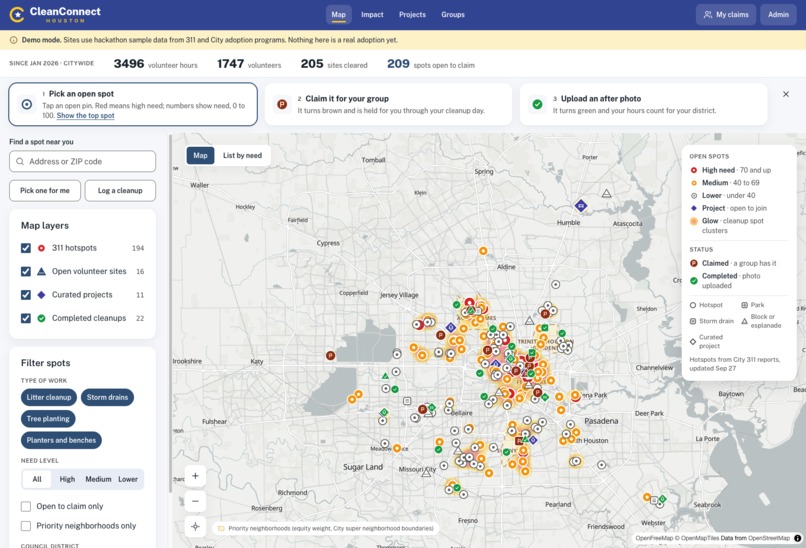
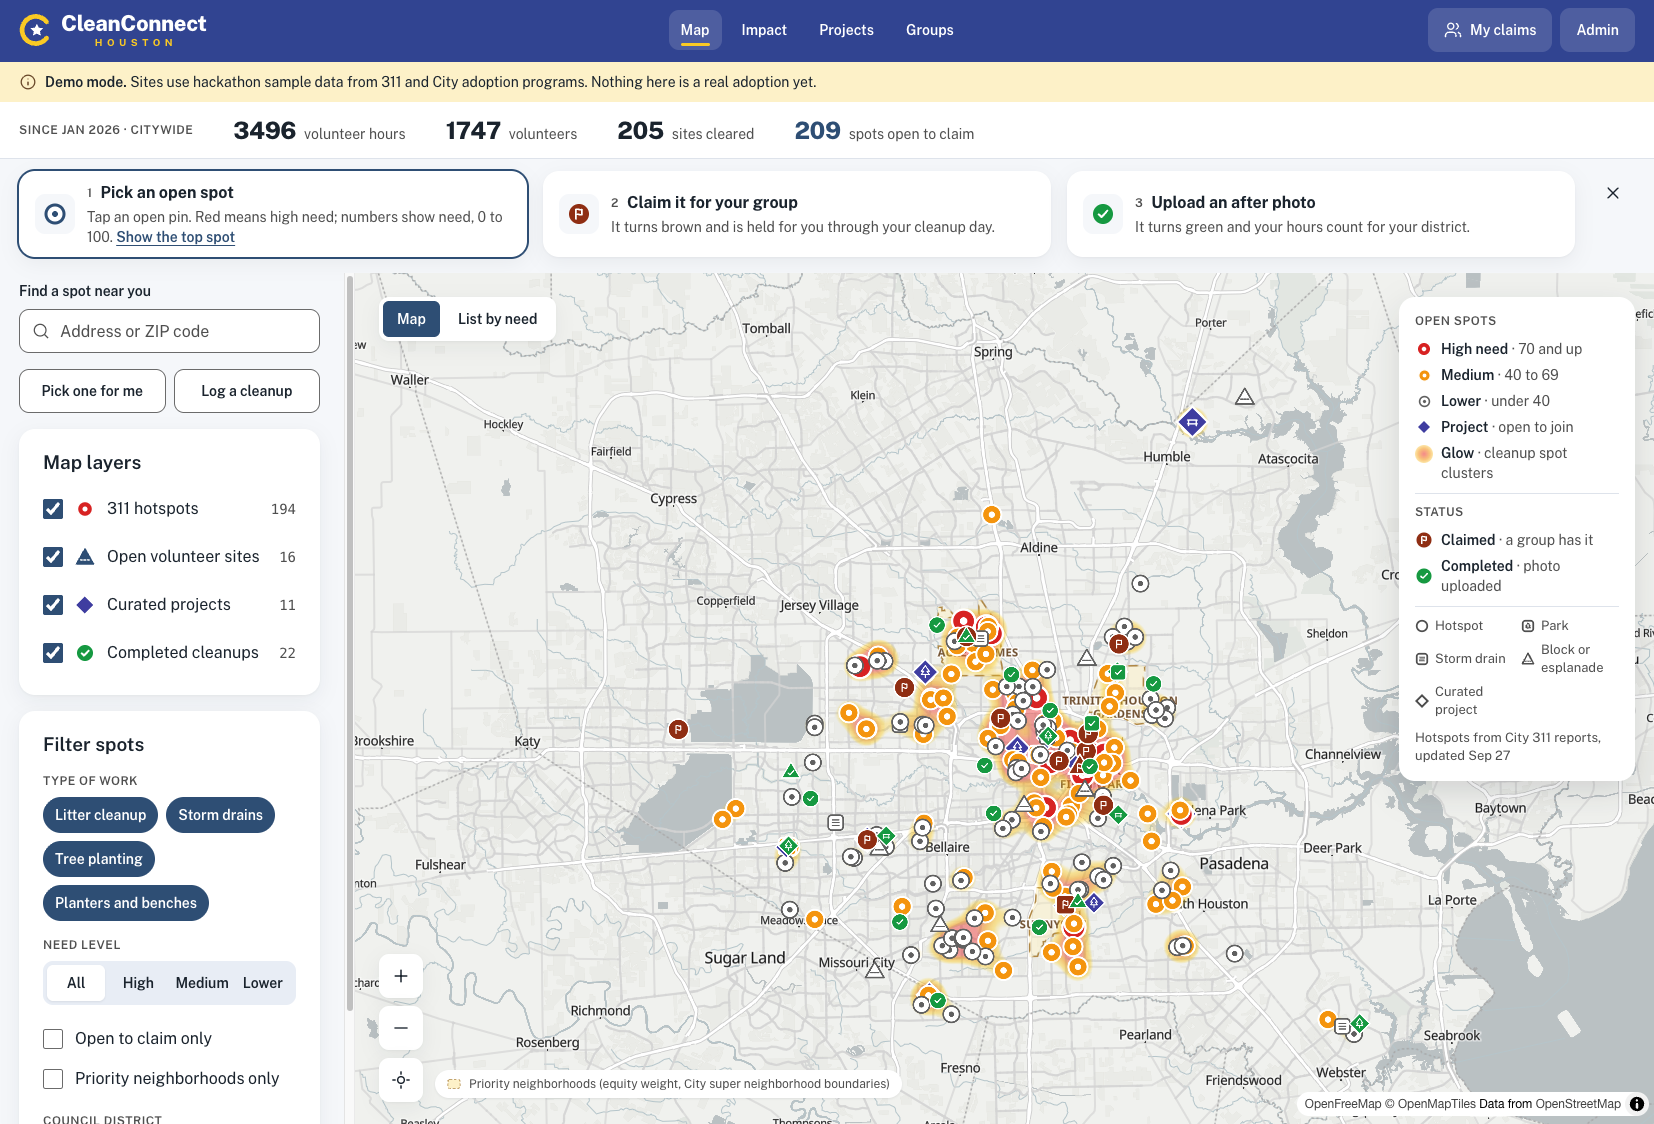
CleanConnect map tool - view and claim cleanup and beautification projects
-
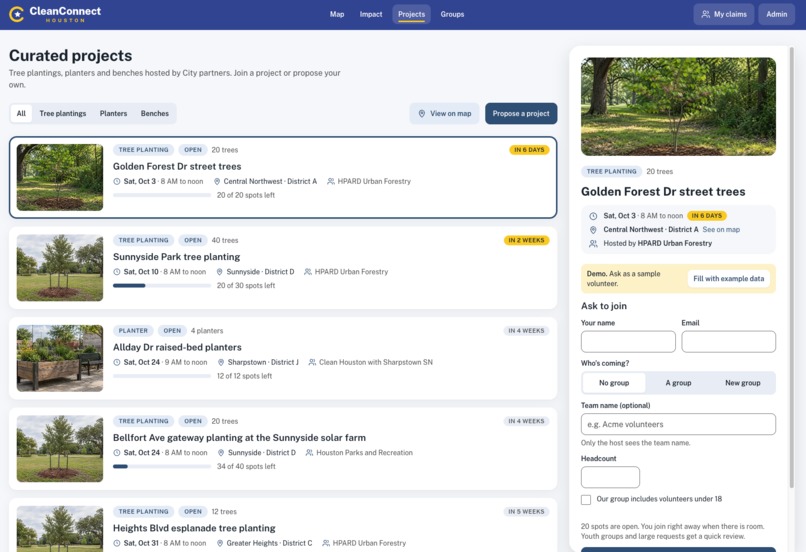
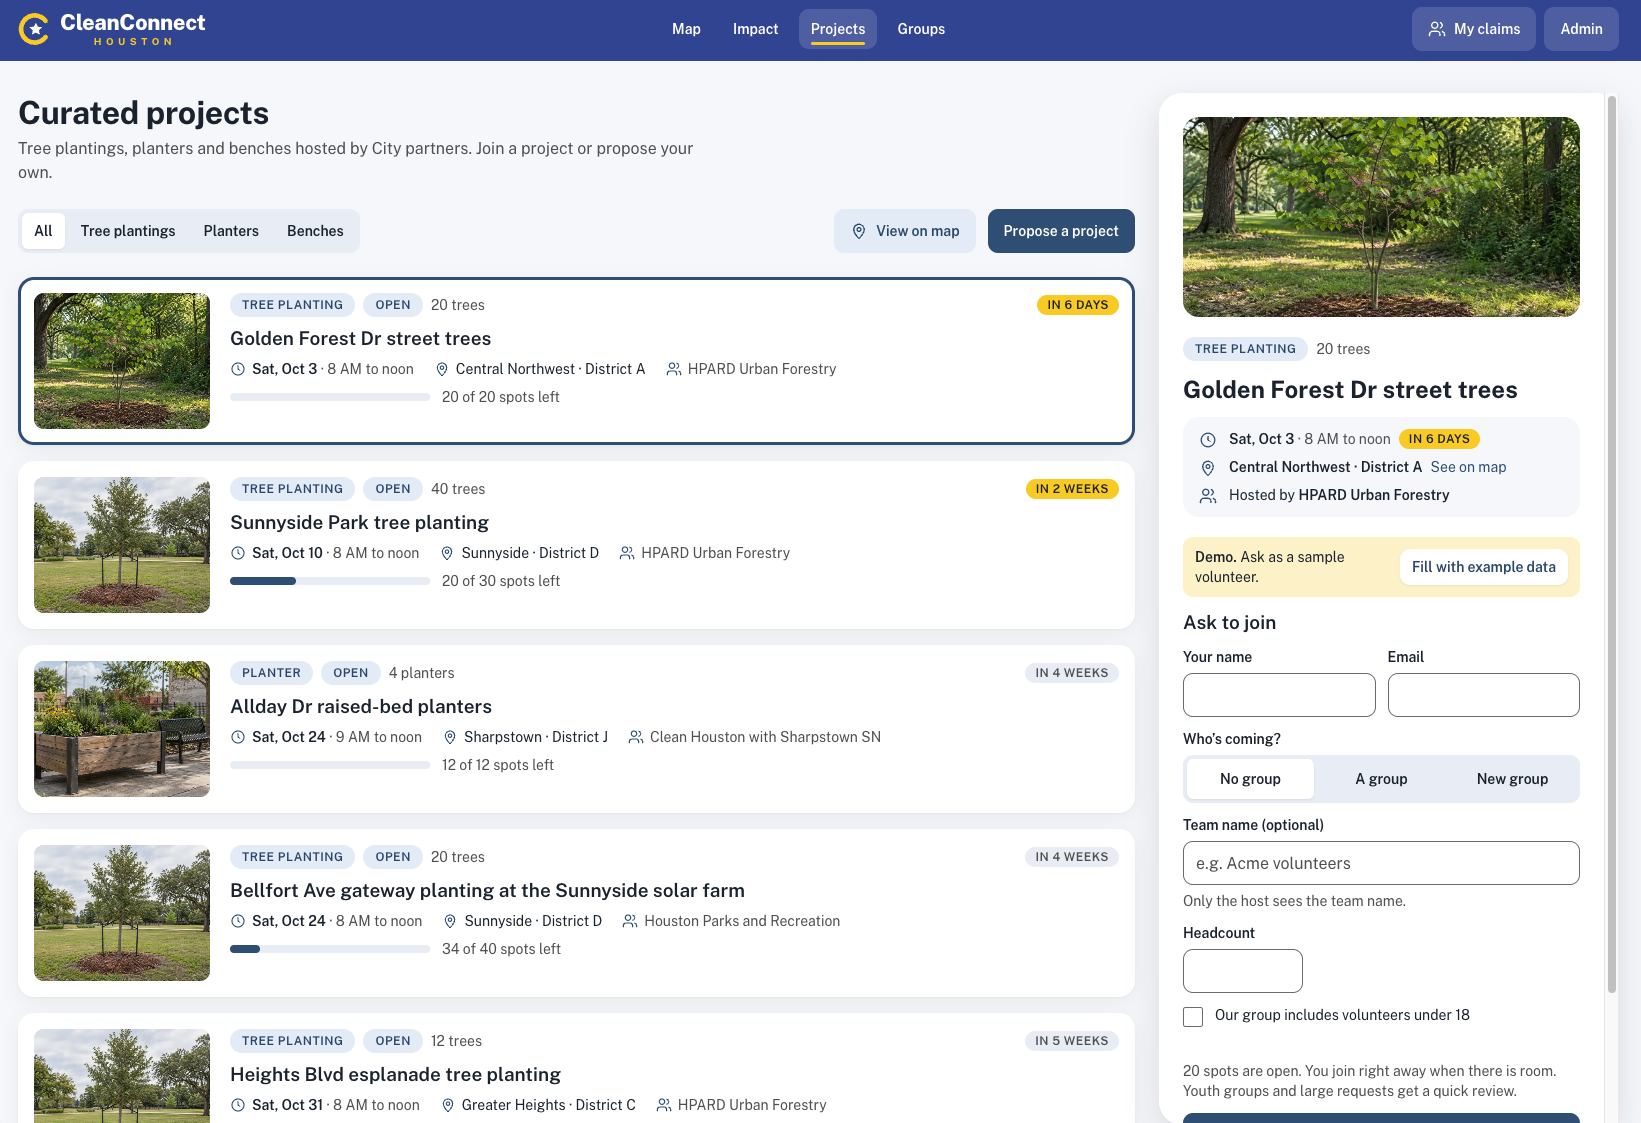
CleanConnect project listing - curated projects you can volunteer for to help improve Houston's public spaces
-
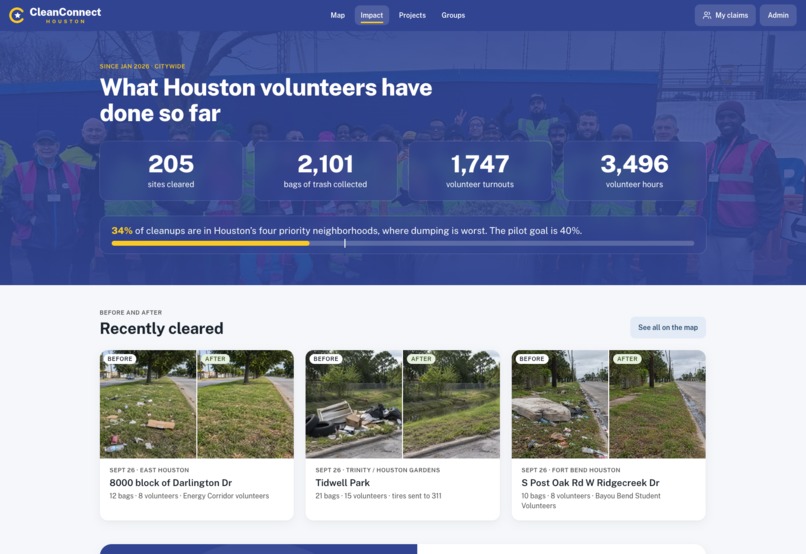
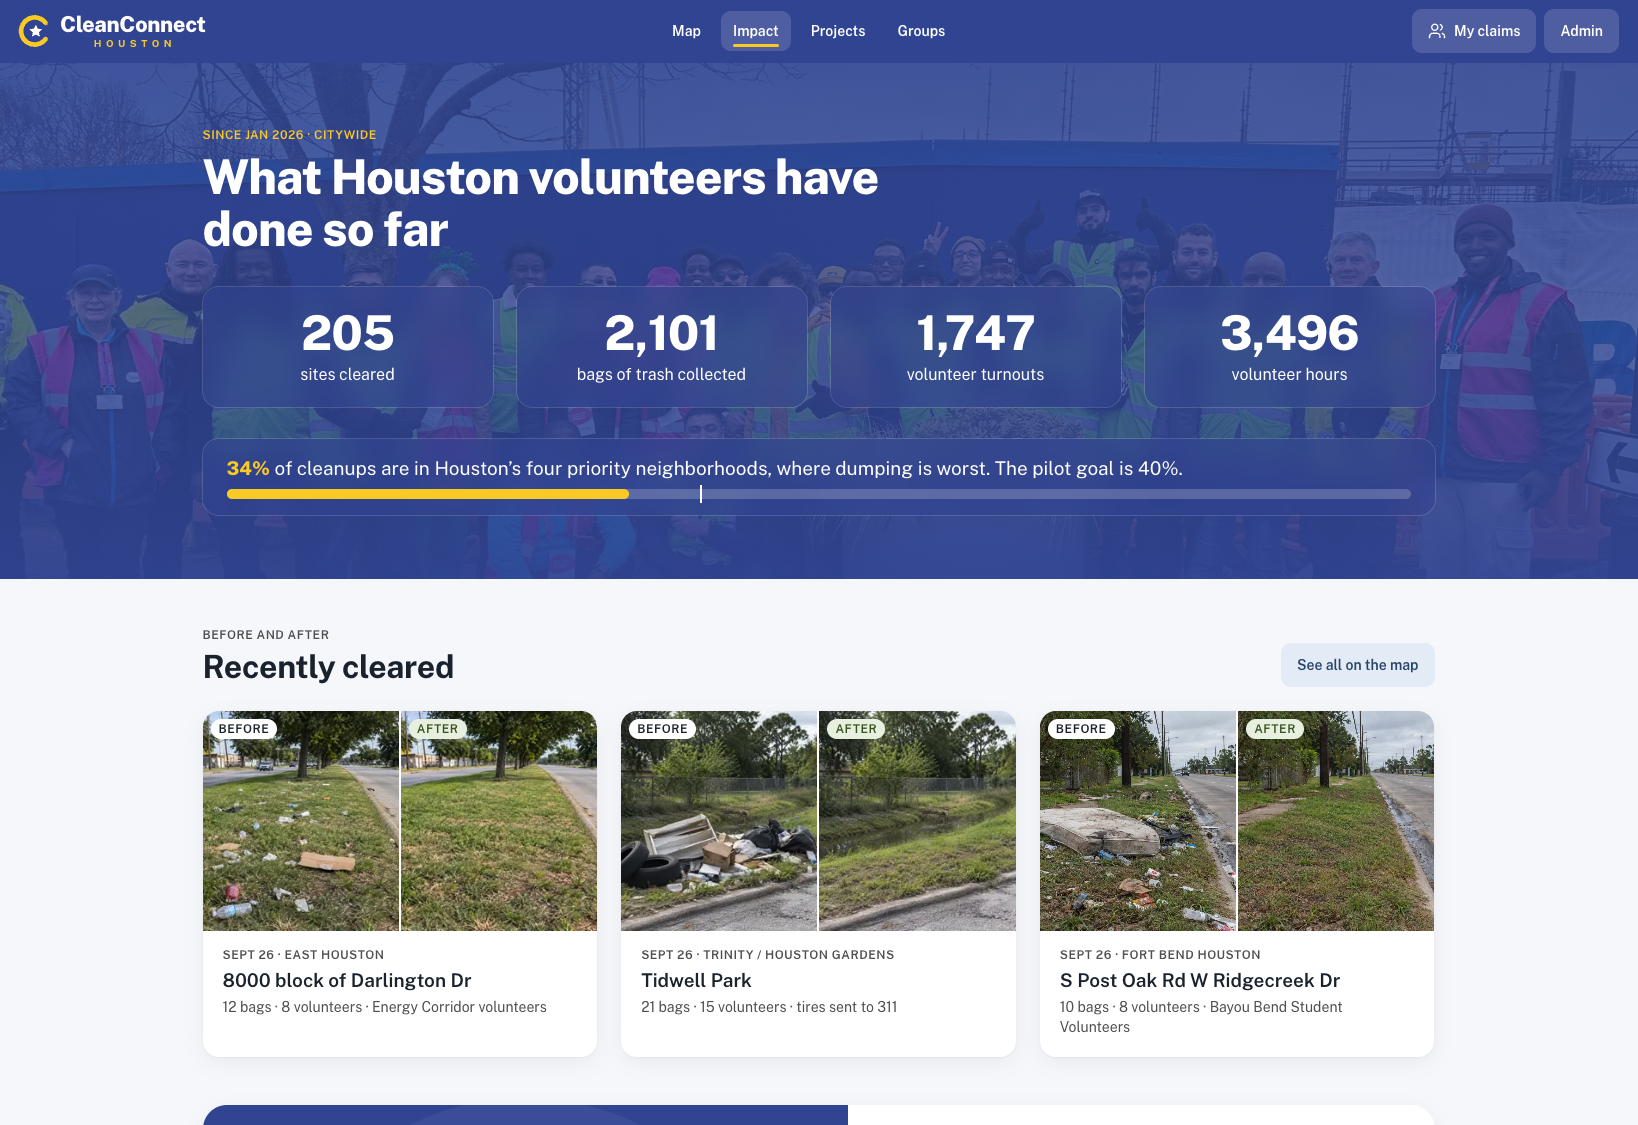
CleanConnect Impact Report - transparent platform & community metrics for volunteer groups and projects
-
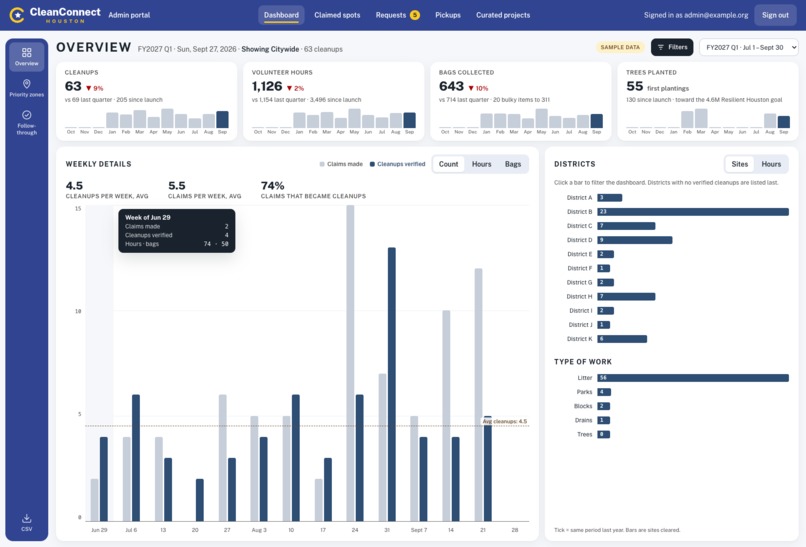
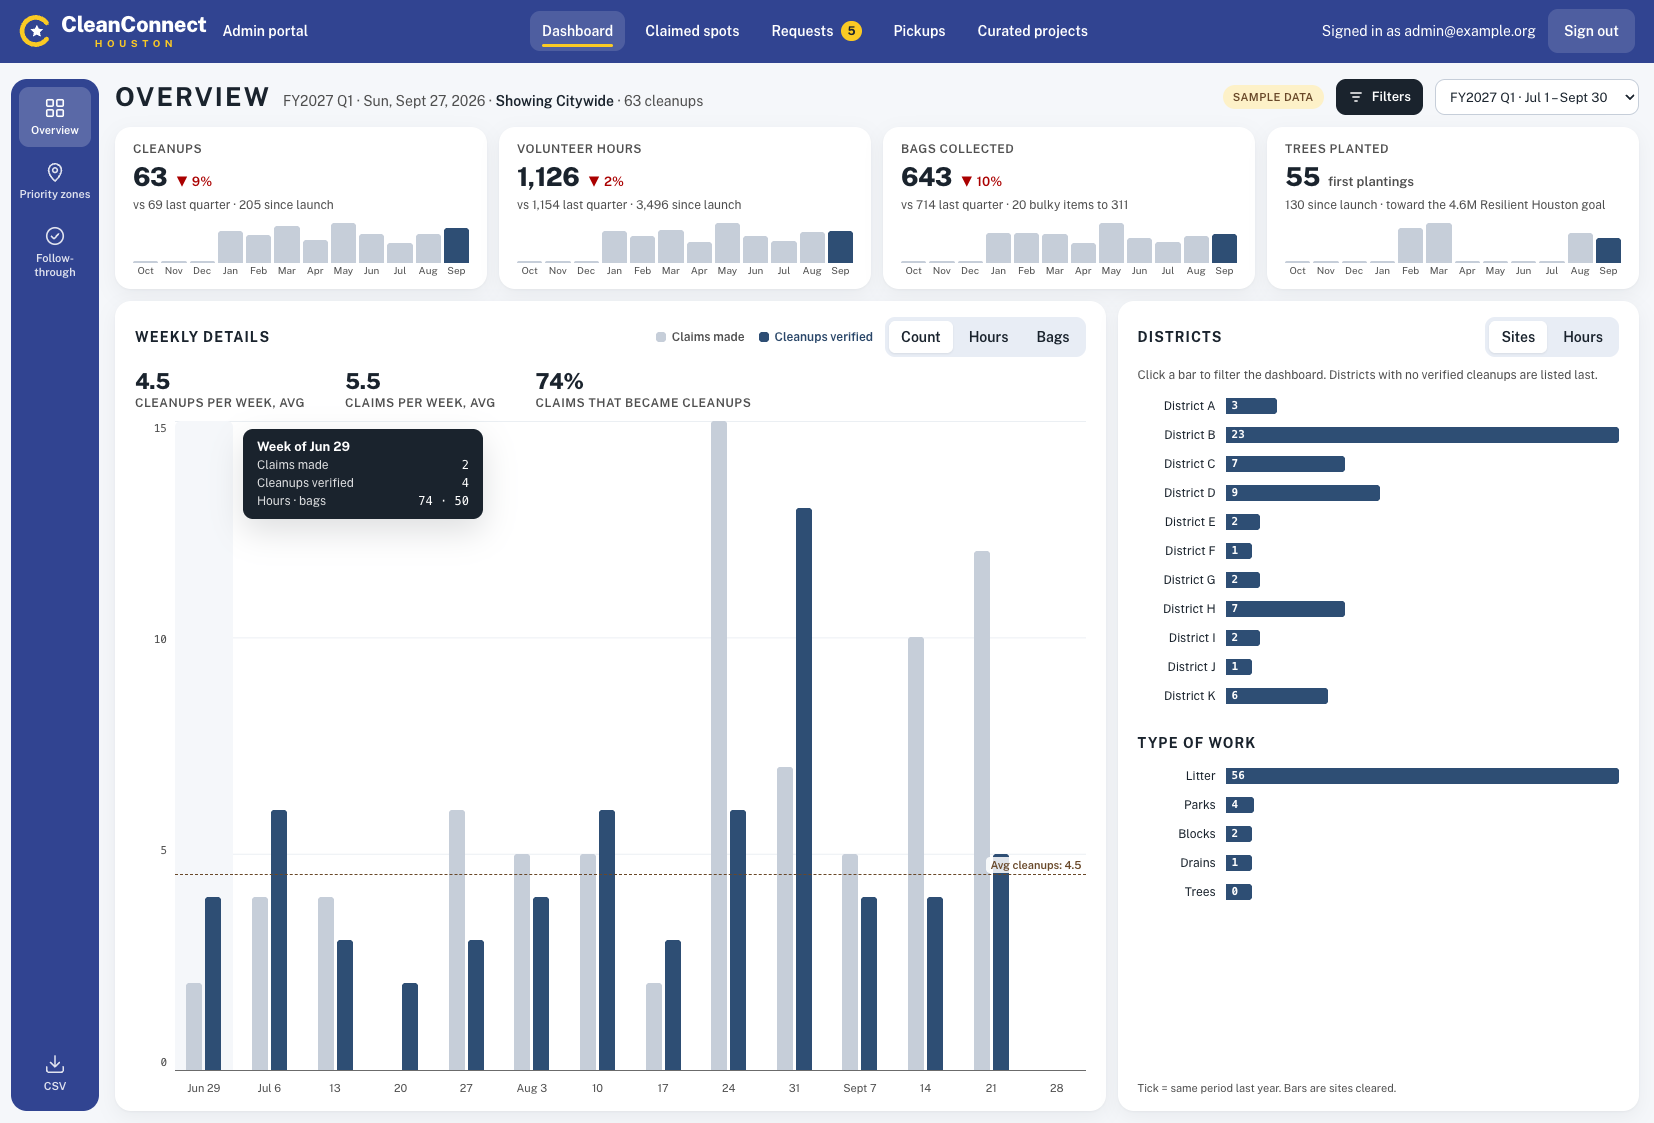
CleanConnect Admin Portal - Overview dashboard of volunteer activity
-
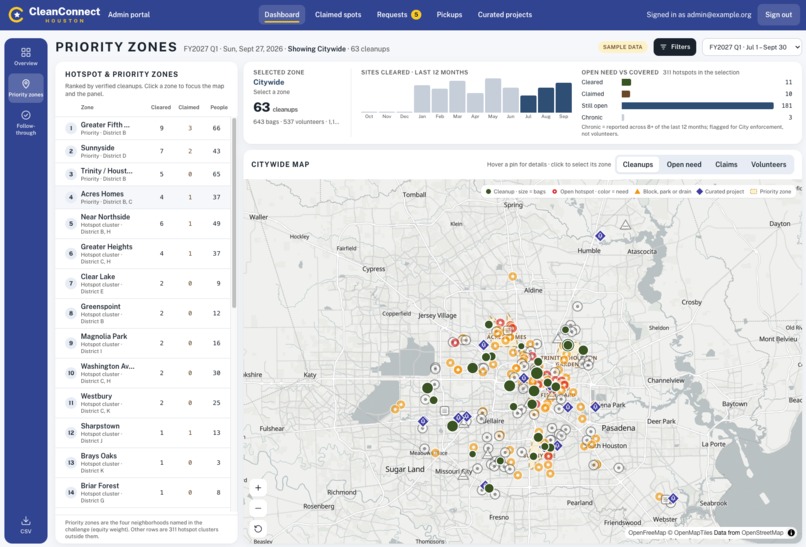
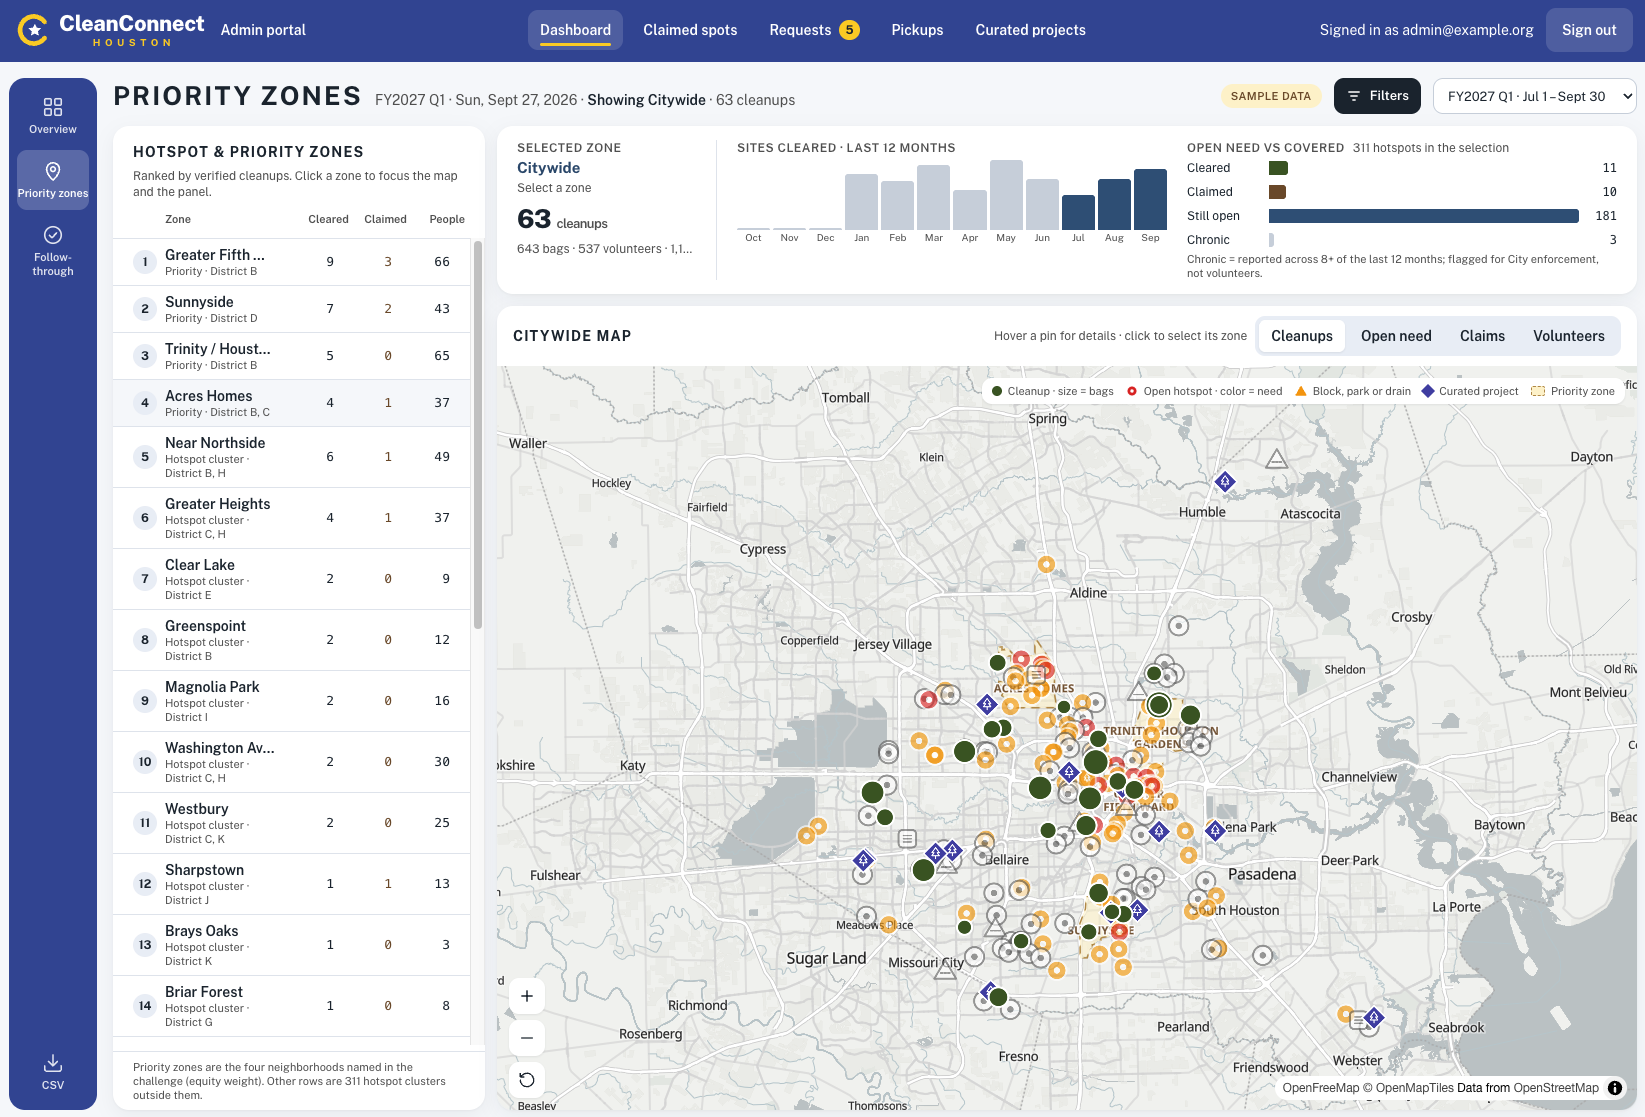
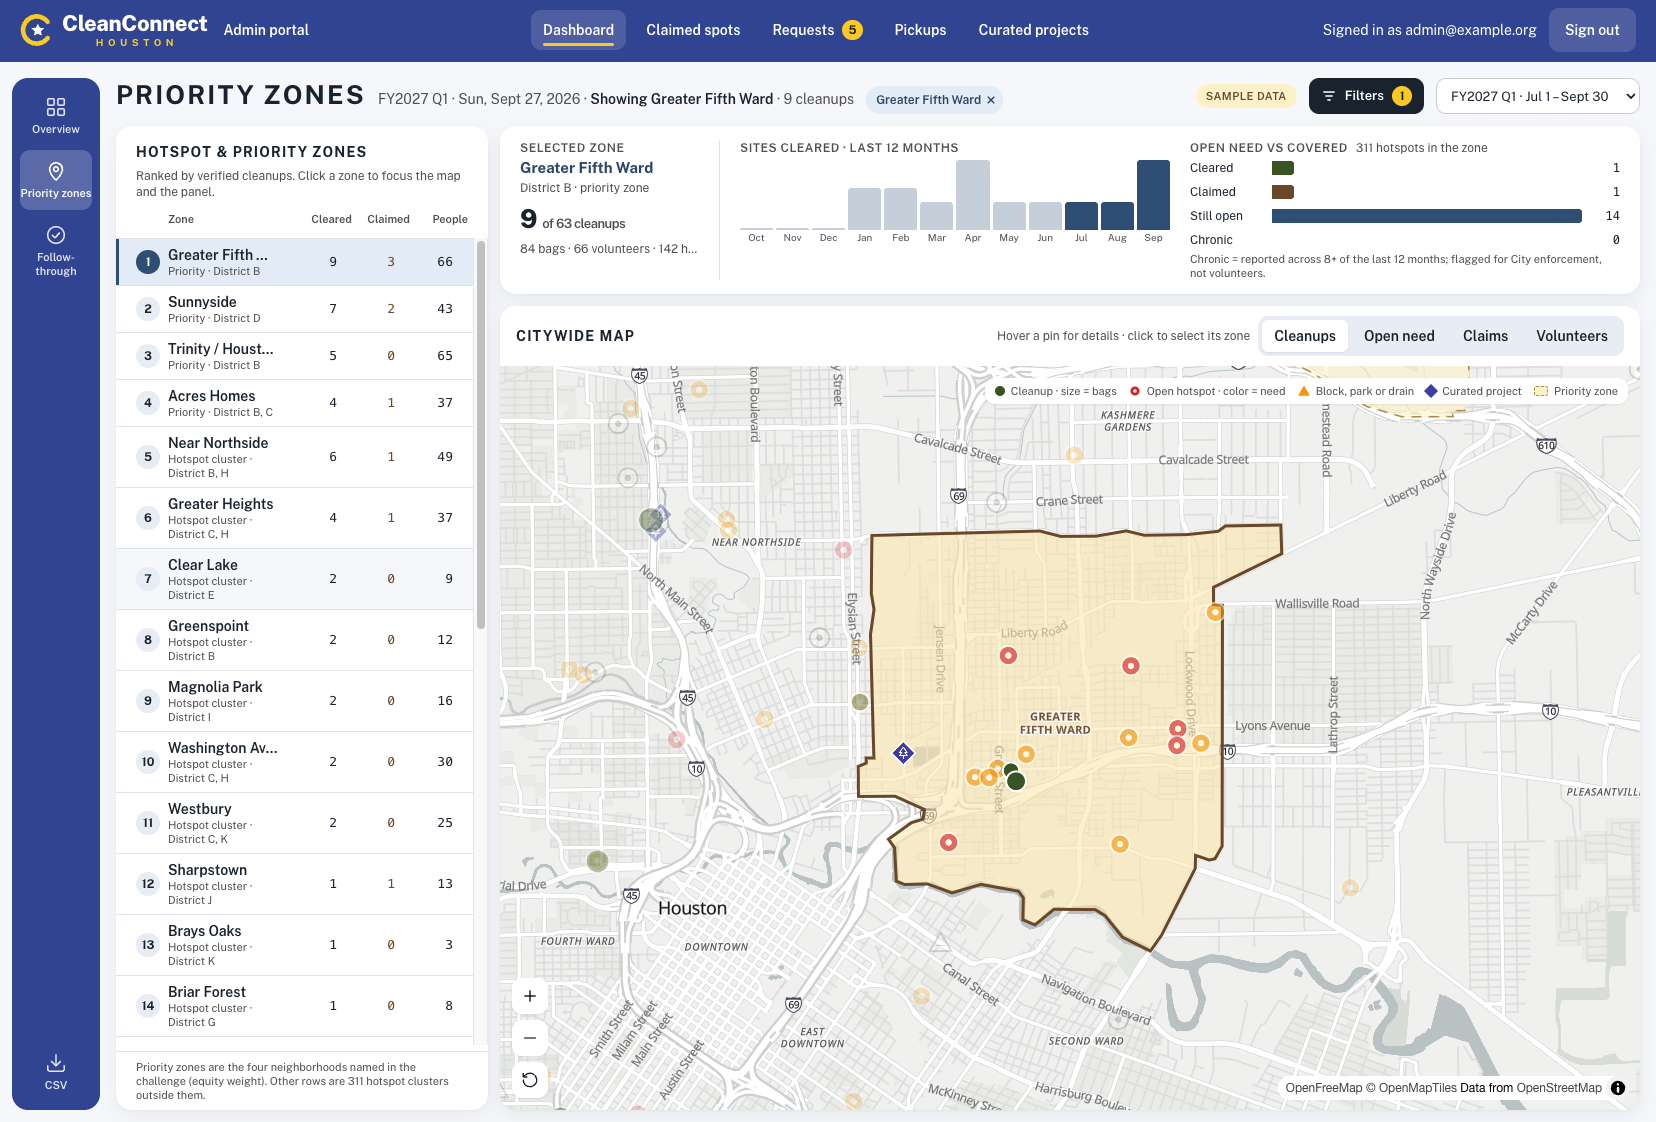
CleanConnect Admin Portal - map tool and breakdown dashboard for priority cleanup areas
-
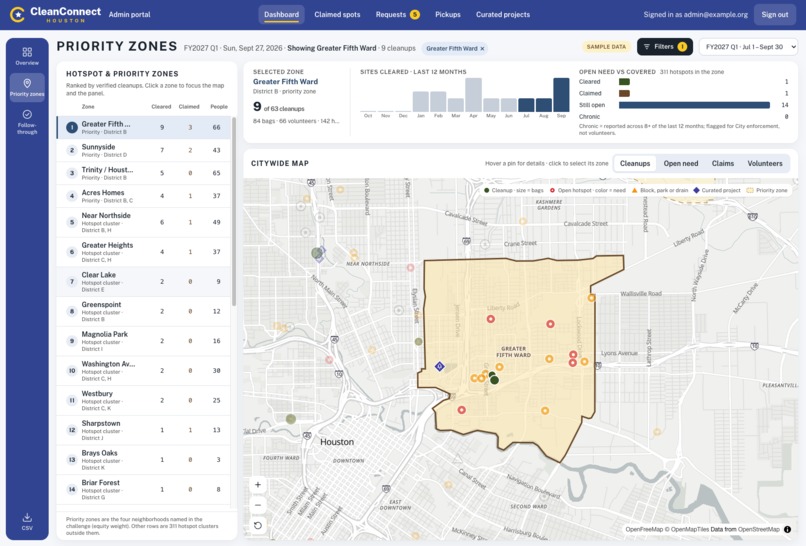
CleanConnect Admin Portal - map tool and breakdown dashboard for priority cleanup areas (detail view)
-
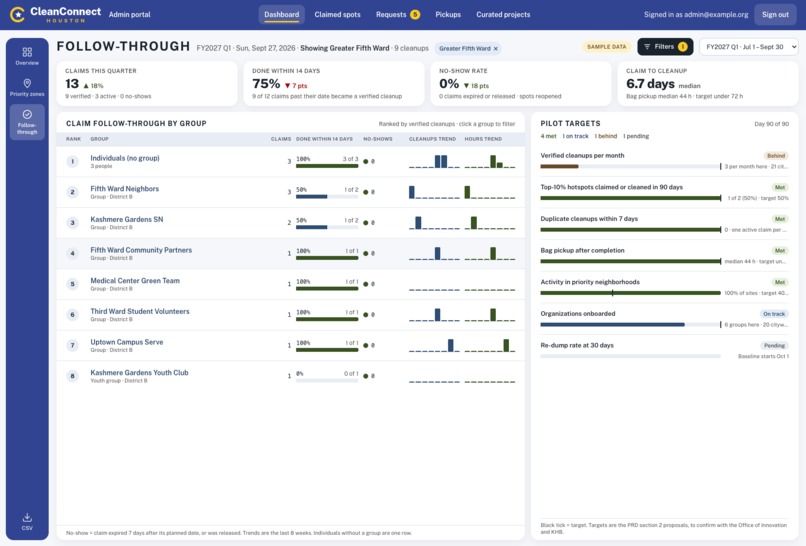
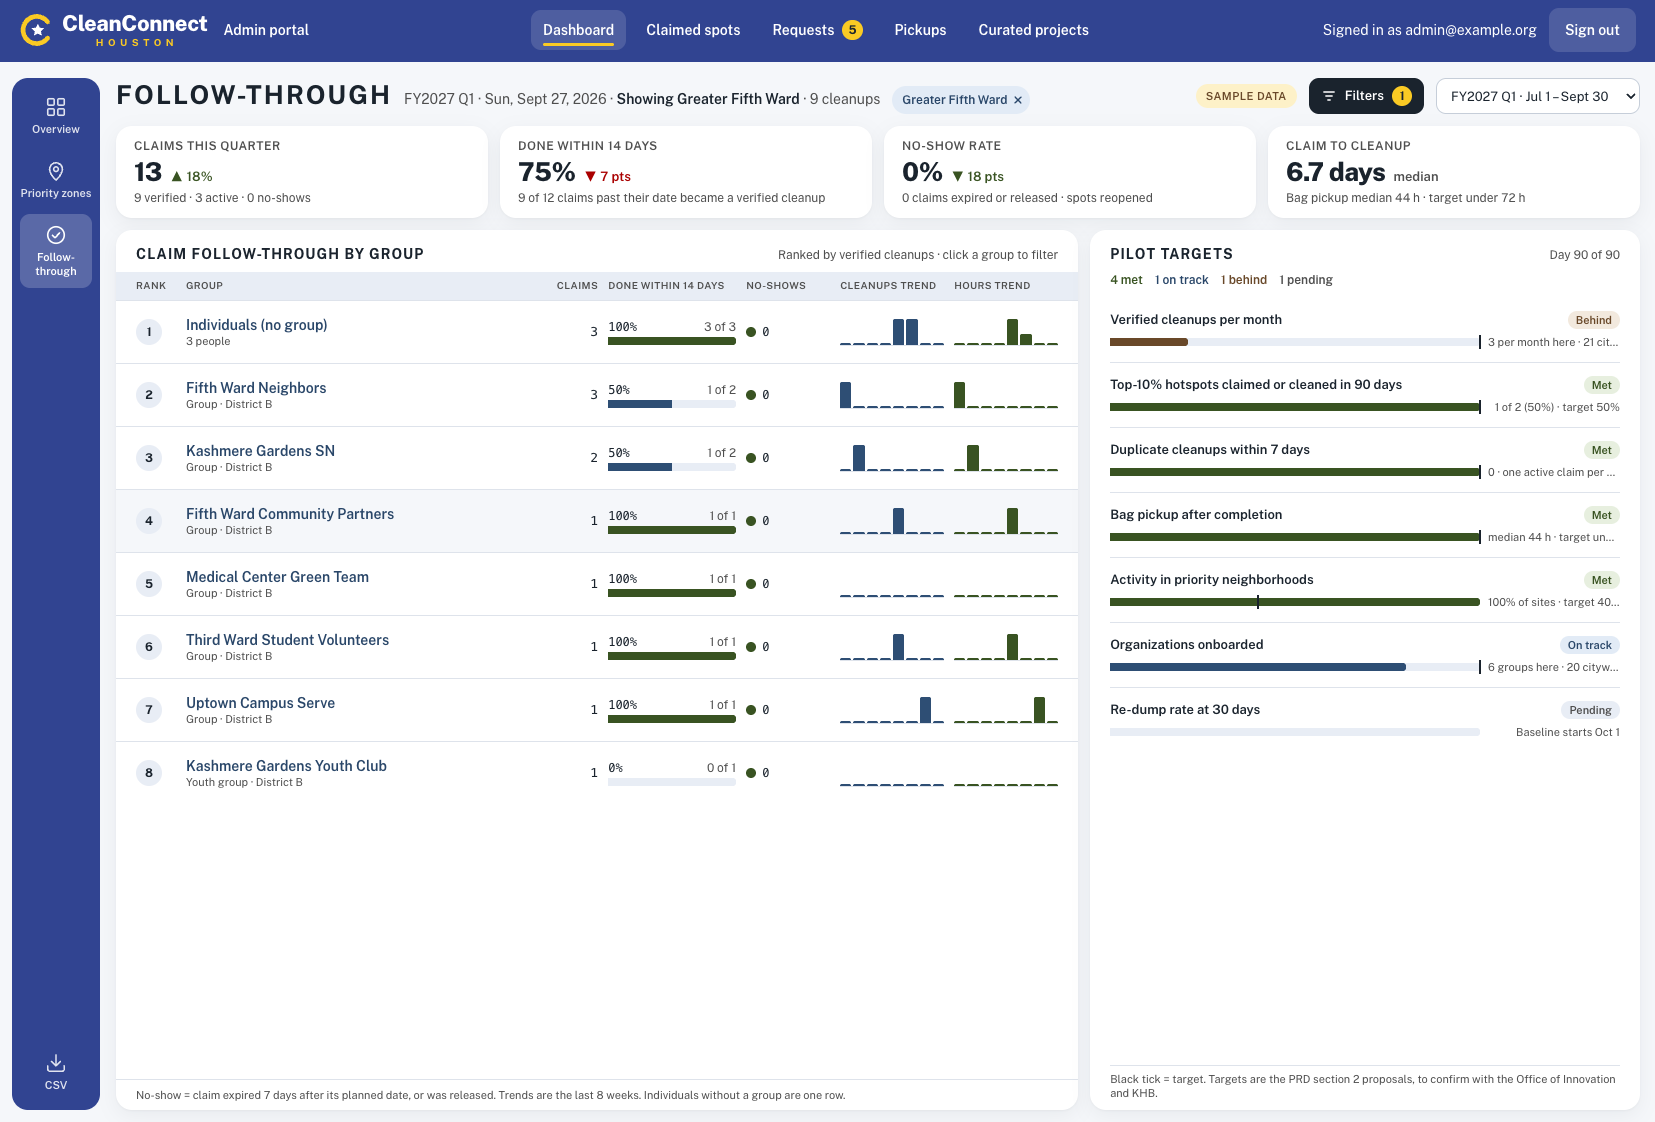
CleanConnect Admin Portal - Follow-up dashboard
Inspiration
Our team runs a data-driven consulting firm and likes using analytics and technology to solve big problems. Mike has organized cleanups and tracked volunteer impact before. At Bevi, he helped start the company's green team in Boston and organized cleanups, where most of the work was logistics: choosing a site, getting people there, and getting full bags picked up. At the Houston Rockets, he led Business Intelligence, volunteered at team cleanup events, and built an organization-wide dashboard that tracked community hours and reported volunteer results to leadership. The hardest part was collecting the data. Hours, headcounts and photos came in through emails, spreadsheets and sign-in sheets, and a lot of it never came in at all.
Houston has the same problem at city scale. The city gets thousands of illegal dumping reports every year. Many residents want to help but adoption programs run on PDFs and email, and nobody can see which sites another group has already taken. Some blocks get cleaned multiple times, and others are never cleaned. Houston needs cleanup numbers it can count, and volunteers need a way to see where to go.
What it does
CleanConnect Houston is a map-first web app. Anyone can:
- See where Houston needs help. Live hotspots come from directly from Houston's 311 dumping and litter reports data, refreshed nightly. The map also shows blocks, esplanades, parks and storm drains that need volunteers, plus curated projects like tree plantings. The blocks, parks and seeded projects are sample data for now, modeled on the city's adoption programs.
- Claim a spot. It's easy to claim a spot or project to volunteer on and our open map shows it right away, so two groups never go to the same site.
- Bring a group. Civic clubs, schools and companies can create a group, share an invite link and manage their roster.
- Prove the work. Volunteers upload before and after photos, log bags and hours, and get a pre-filled 311 request for bag pickup plus an hours certificate.
- Give the city its numbers. Admins verify completions, track bag pickups, approve groups and projects, and export CSVs for easy reporting.
No account is needed. The app gives each device a volunteer ID and keeps every private link on a "My claims" page.
How we built it
We worked in three steps: research and scoping, design, and build.
1. Research and scoping
- We asked Jesse Bounds, Director of the Mayor's Office of Innovation & Performance and presenter of this challenge, questions about the problem, the current process and the stakeholders involved.
- We used what we learned from that conversation to find secondary research on existing resources, such as 311 data, Keep Houston Beautiful's adoption programs and the city's reporting requirements.
- We discussed our combined research and created a product requirements document (PRD) to drive the design.
2. Design
- We designed the screens and visual elements of the app from the PRD, for both phone and desktop (phone designs were not used for the final demo).
- We chose a tech stack that fits the problem: a live map, one claim per site, photo uploads, and reports the city can export.
3. Build
- Application: A full-stack web app built with Next.js and MapLibre, hosted on Vercel.
- Database: Supabase stores sites, claims, groups and photos. The database enforces the key rules, such as one active claim per site, and updates every open map in real time.
- Live 311 data: A nightly job imports the city's public 311 reports, groups them into hotspots and ranks each one by need.
- Testing: Automated browser tests with Playwright check every main flow against the live database.
Challenges we ran into
- Designing for three kinds of users. Individual volunteers, group leaders and admins each need different things from the same map. We worked through each user's steps from start to finish so one app could serve all three.
- Learning how the process works today. We built most of our understanding from secondary research, plus our conversation with the Director. For example, we learned that a city crew closing a 311 case does not mean volunteers cleaned the spot, so the app tracks city status and volunteer status separately. More primary research with active organizations and volunteer groups would help refine the solution.
- Keeping the app simple. There are many ways to approach this problem and many features we could have added. We focused on the information each user needs to act, and left out features that would make the app harder to use.
Accomplishments that we're proud of
- We turned a broad problem into a clear solution quickly. In the first day, we went from the Director's goals to a PRD with a defined MVP and stretch goals.
- We built a working app that could launch as a pilot within weeks. The deployed version covers the Director's MVP items, runs on real Houston 311 reports updated every night, and supports the full volunteer, group lead and admin flows. From a tech perspective, it is not too far from being a fully functioning solution for a pilot.
- We are happy with how it looks. The map-first design is clean and easy to read.
What we learned
- Public data can help Houston right away. Houston already publishes a lot of useful data, such as 311 reports. More time spent on research and solution design could turn that data into tools that help the city now.
- Research and design first makes the build faster. We usually start by building. This time we spent more time refining the idea before writing code, and the build went faster because we knew what to make.
- Map tools are hard to design. A map can show a lot of information at once. The hard part was deciding what each user needs to see first and what to leave out.
What's next for CleanConnect Houston
- Find support for piloting with partner organizations and city departments.
- Enhancing the Admin portal to better meet the needs of organizations and offices that would help contribute to the platform.
- Add email and text updates, so volunteers get their claim links, reminders before a cleanup, and notices when bags are picked up.
- Responsive design for mobile users.
- Add Spanish language support.


Log in or sign up for Devpost to join the conversation.