-
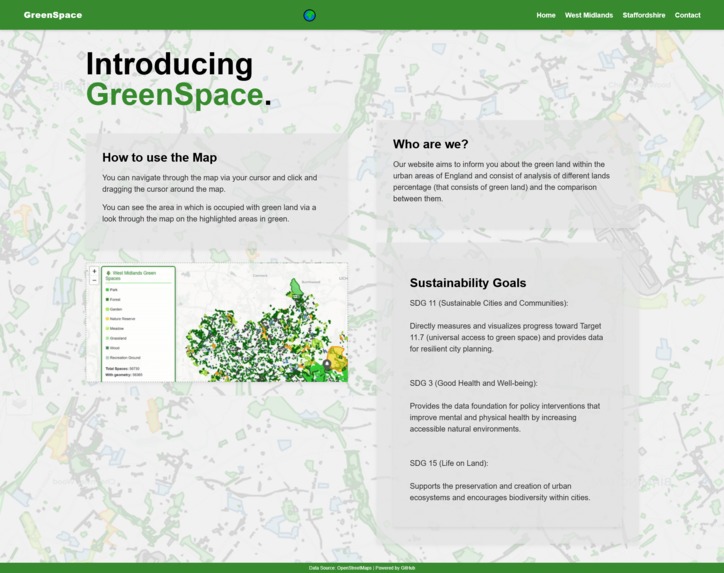
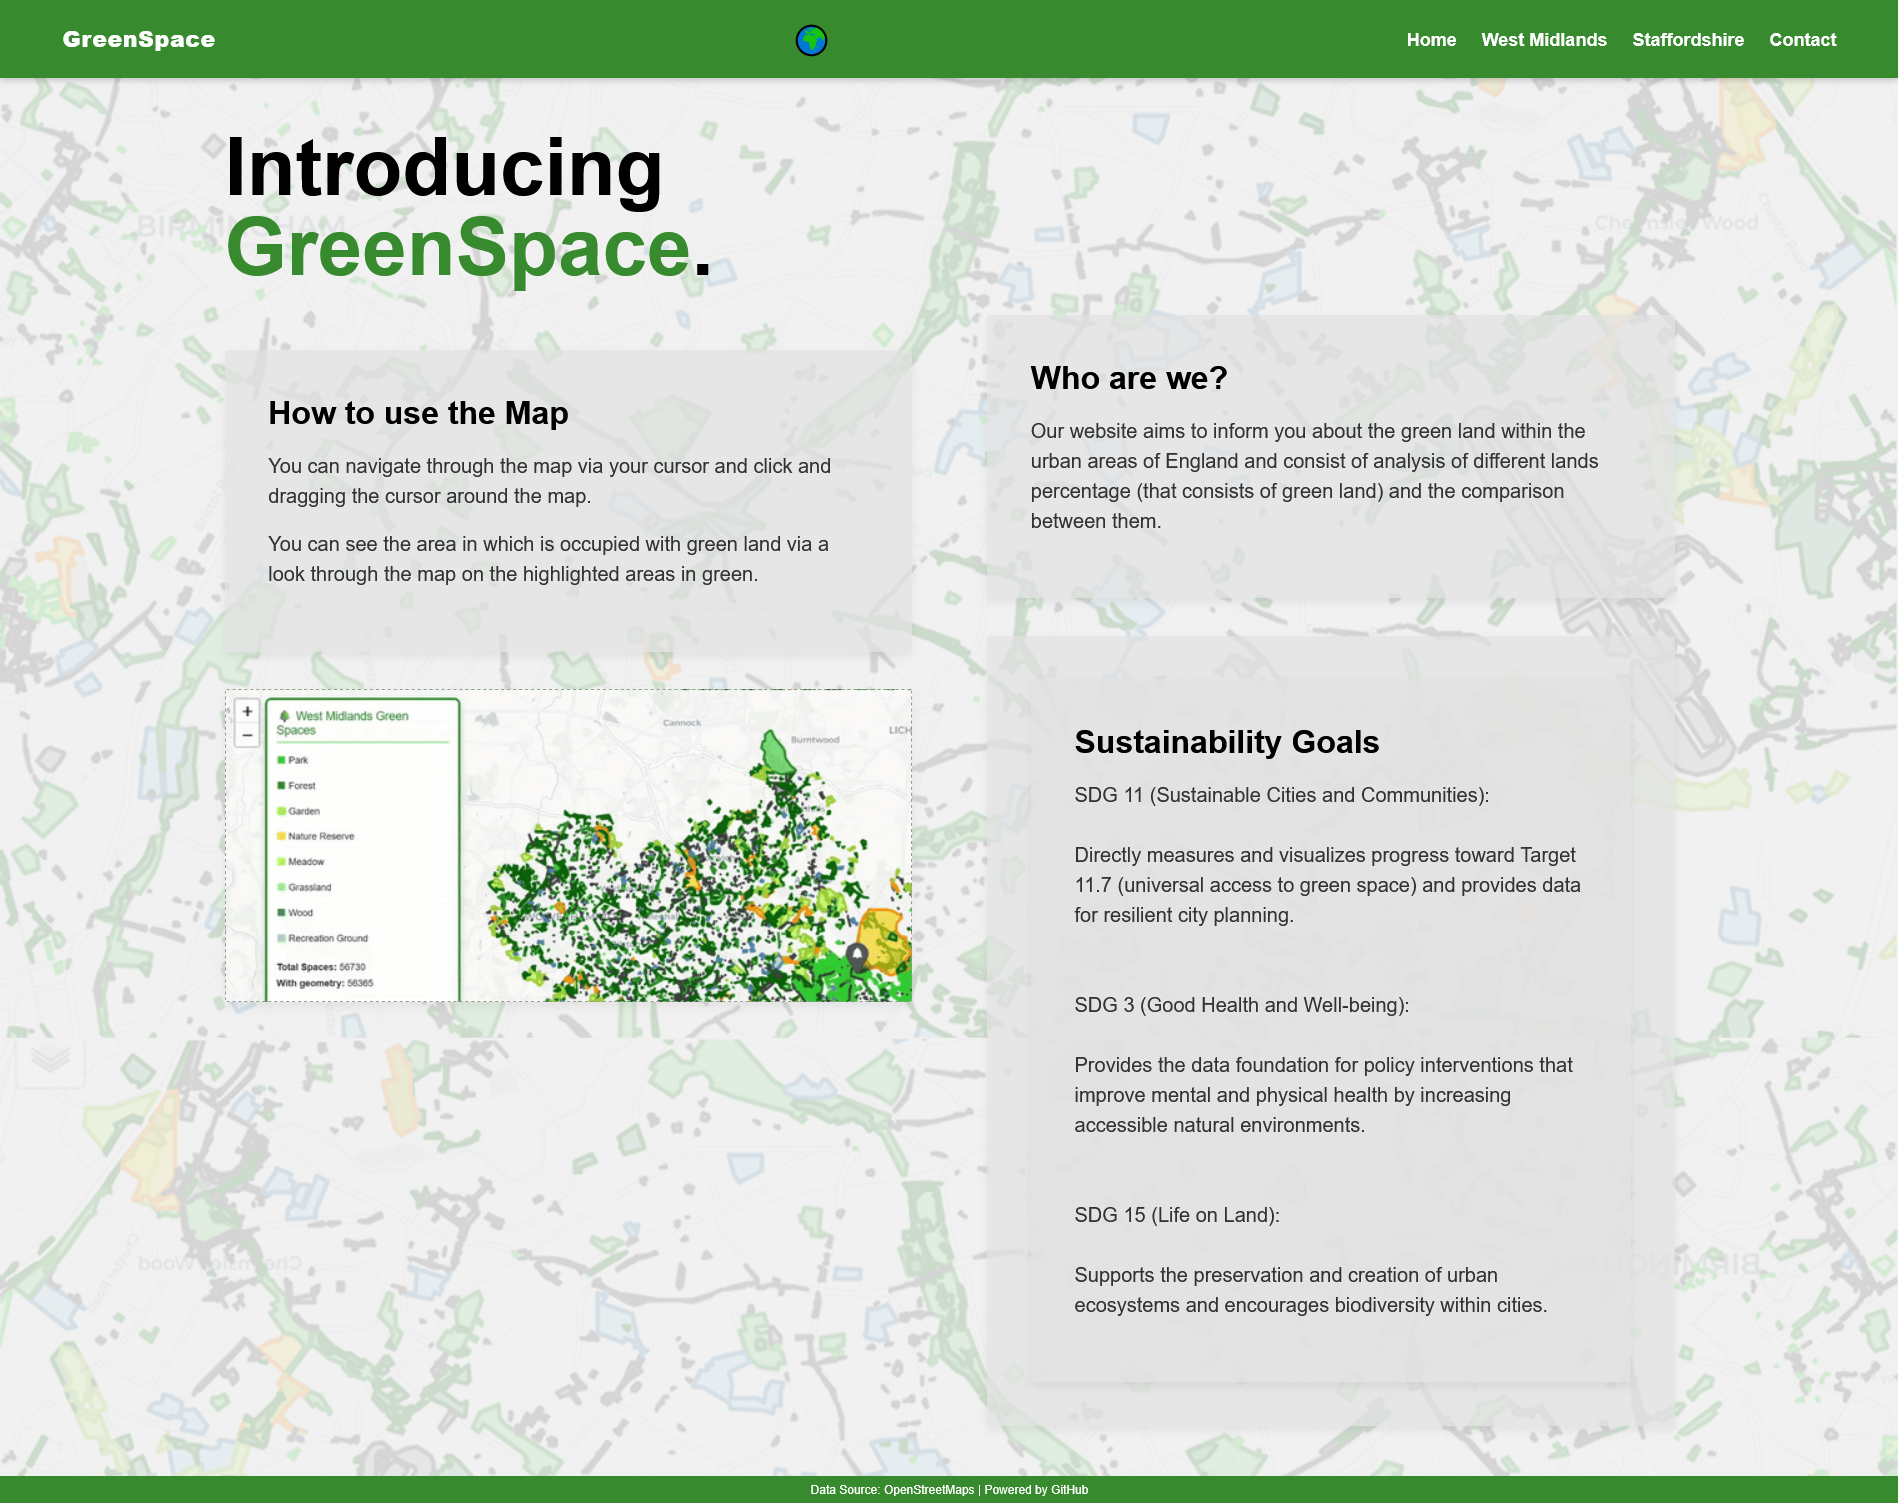
Main Site Page
-
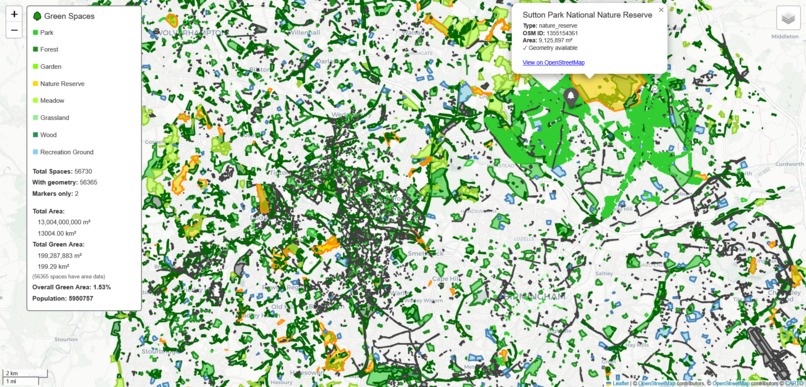
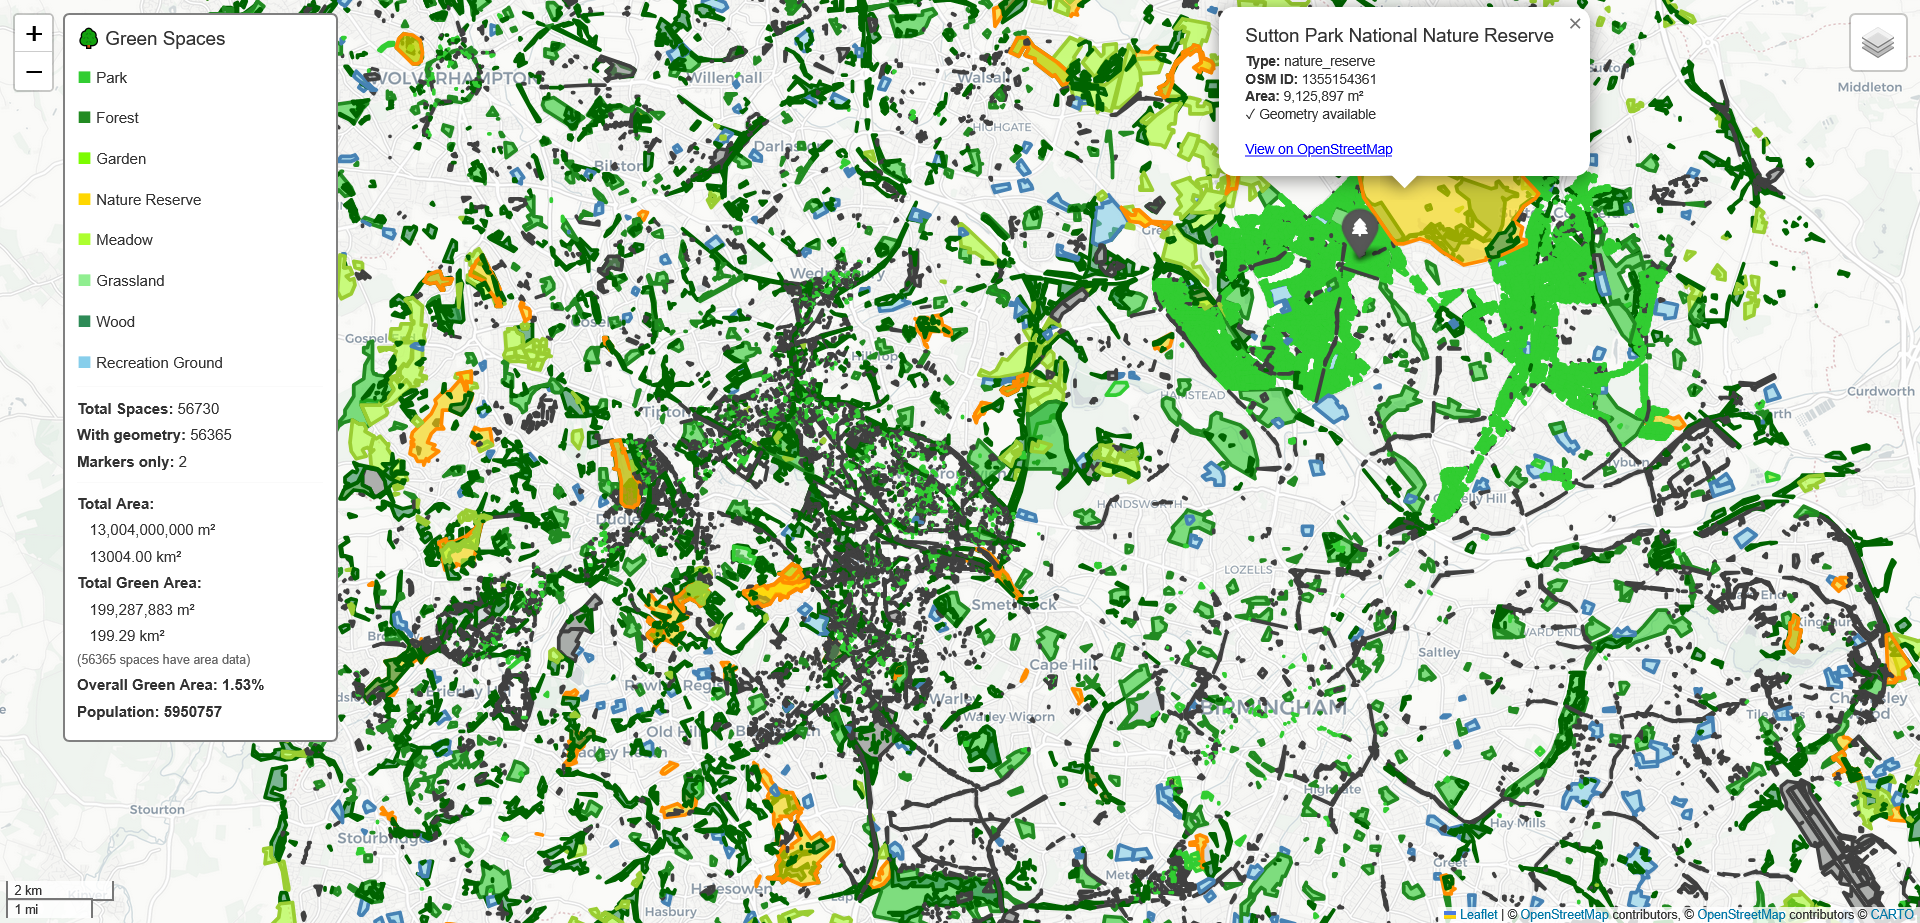
Interactive Map of the West Midlands
Inspiration
The presence of green spaces in urban areas are often unequal, with specific regions having less access to parks, nature reserves and other natural areas. This has negative impacts on mental health, but can start to be mitigated by being aware of which areas need improvement. This can be visualised using our site, and the appropriate people can then be informed (e.g. local council, MPs etc).
What it does
Lets users browse an interactive map visualising green spaces in specific regions.
How we built it
We used Python, and specifically Flask for the webserver. We used the OpenStreetMap API (via geofabrik) to get the data regarding specific regions. Osmium was used to parse the data, and Folium was used to create the interactive map.
Challenges we ran into
The main hurdle was understanding the openstreetmap API, and how to parse the data (we used Osmium for this).
Accomplishments that we're proud of
Ending up with an interactive map that works as intended.
What we learned
How to work on a tight deadline, and prioritise necessary features, rather than. How to use the OpenStreetMap API, and how to create interactive maps.
What's next for GreenSpaces
A more efficient implementation and possibly a "Green Spaces Near You" feature, as well as a more direct comparison tool.
Built With
- flask
- folium
- openstreetmap
- osmium
- python
- shapely


Log in or sign up for Devpost to join the conversation.