-
-
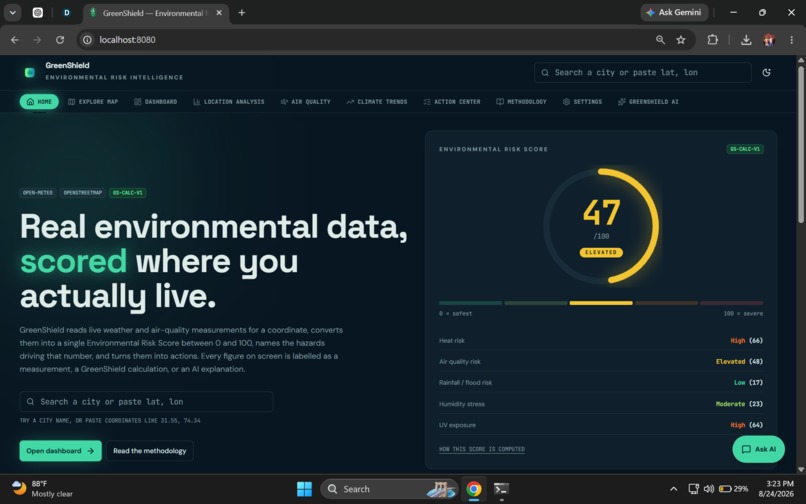
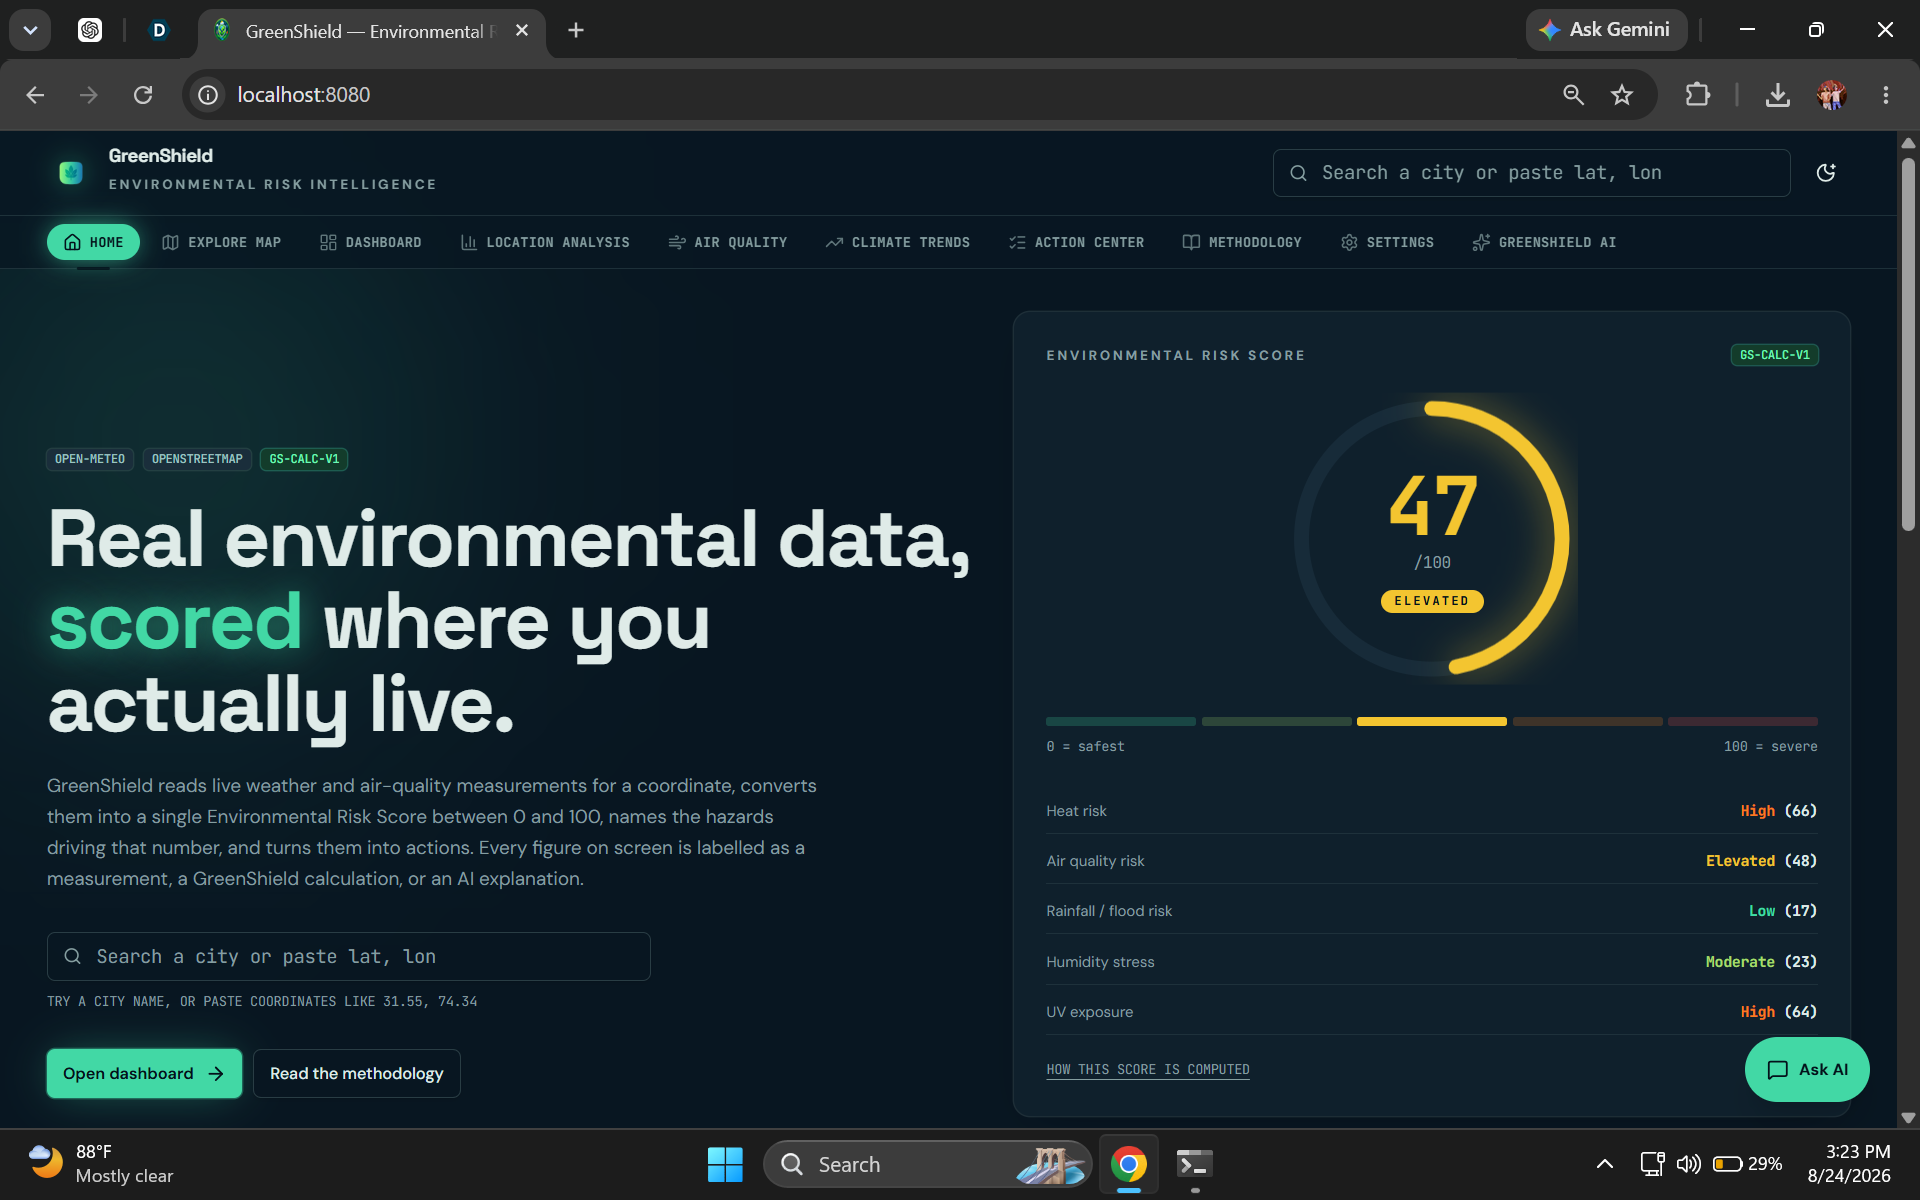
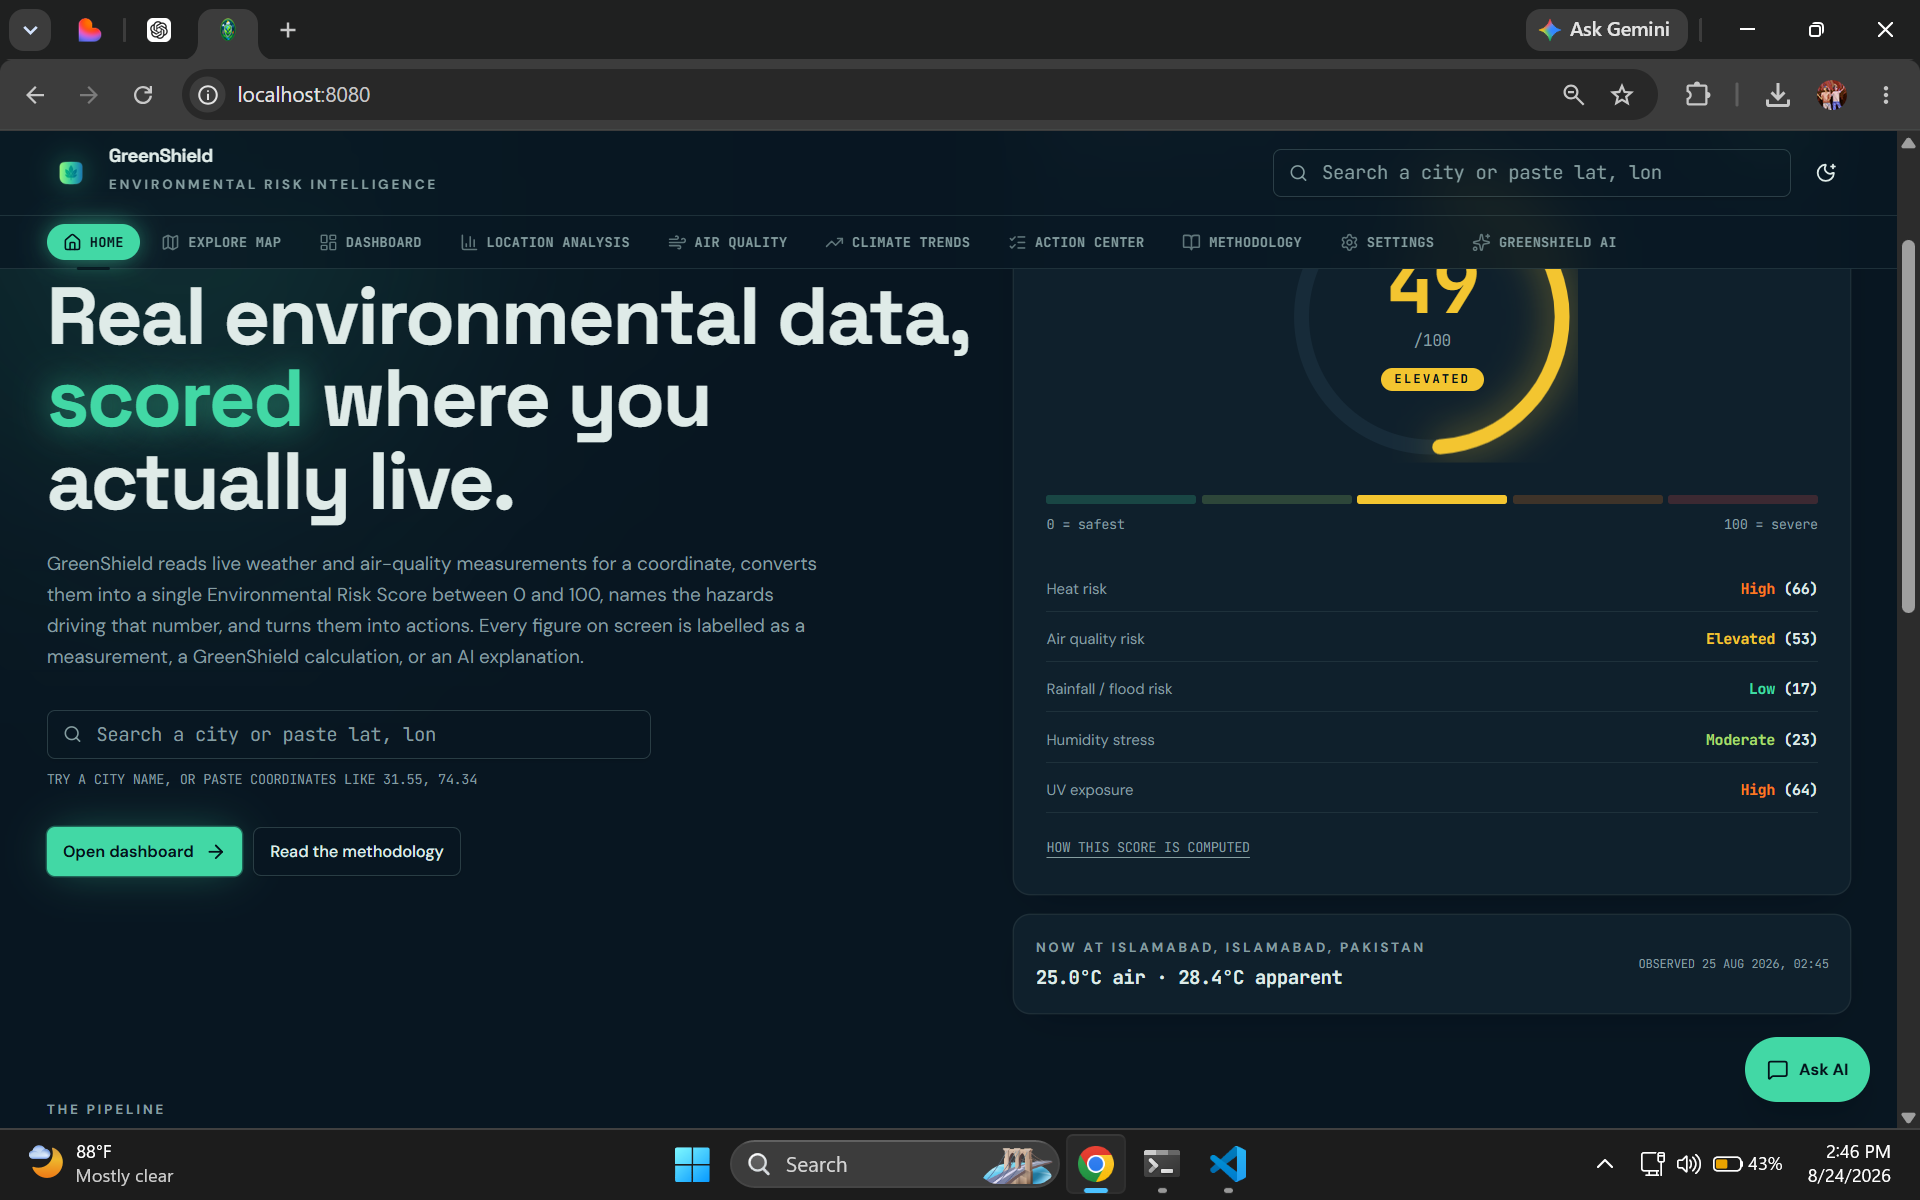
GreenShield home dashboard showing the Environmental Risk Score and the key hazards affecting a selected location.
-
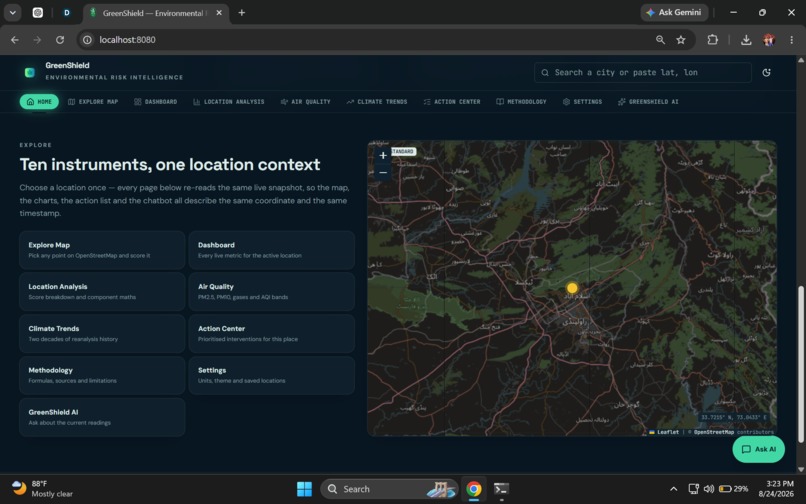
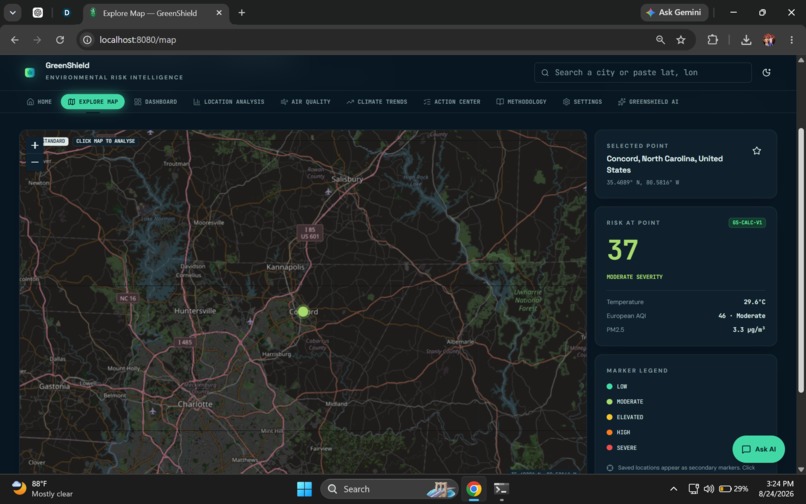
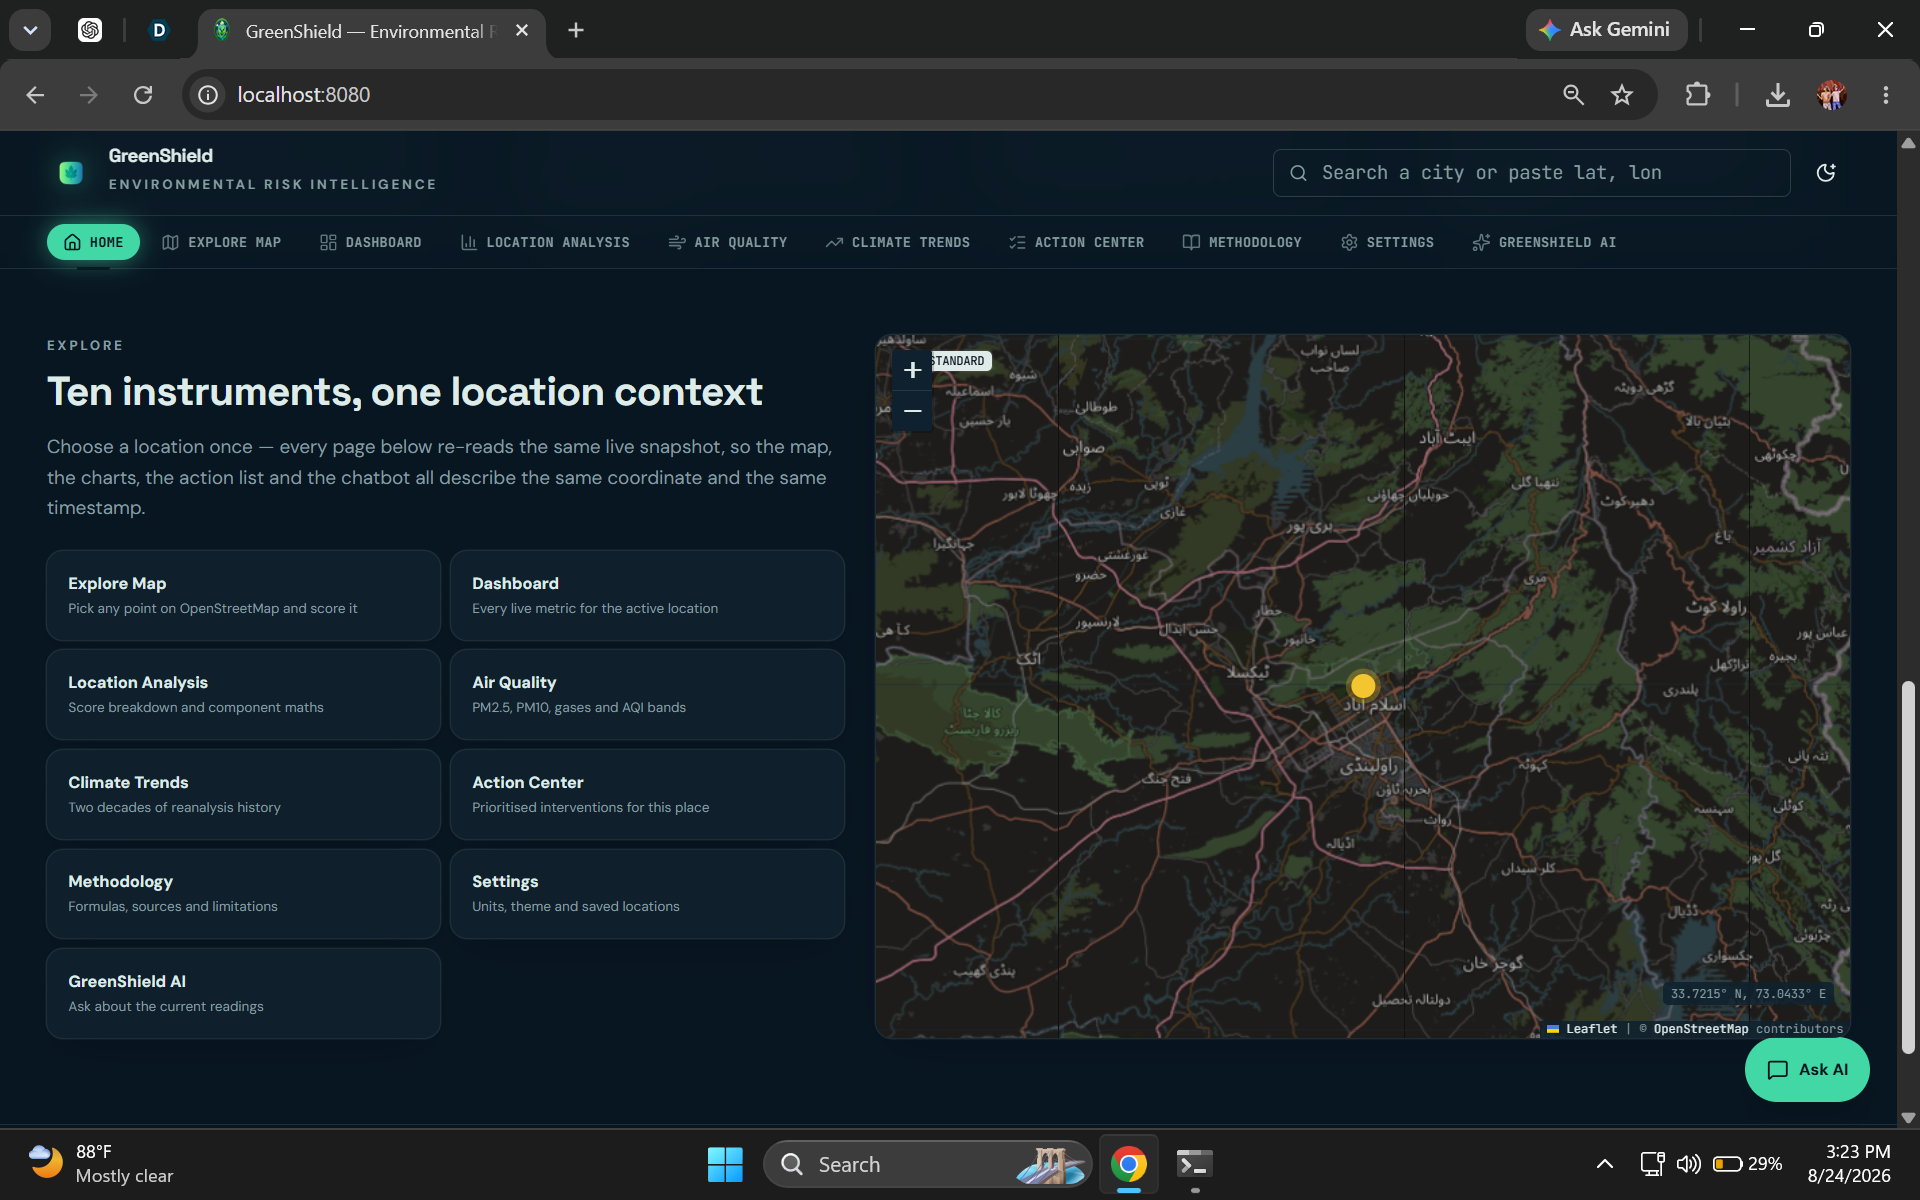
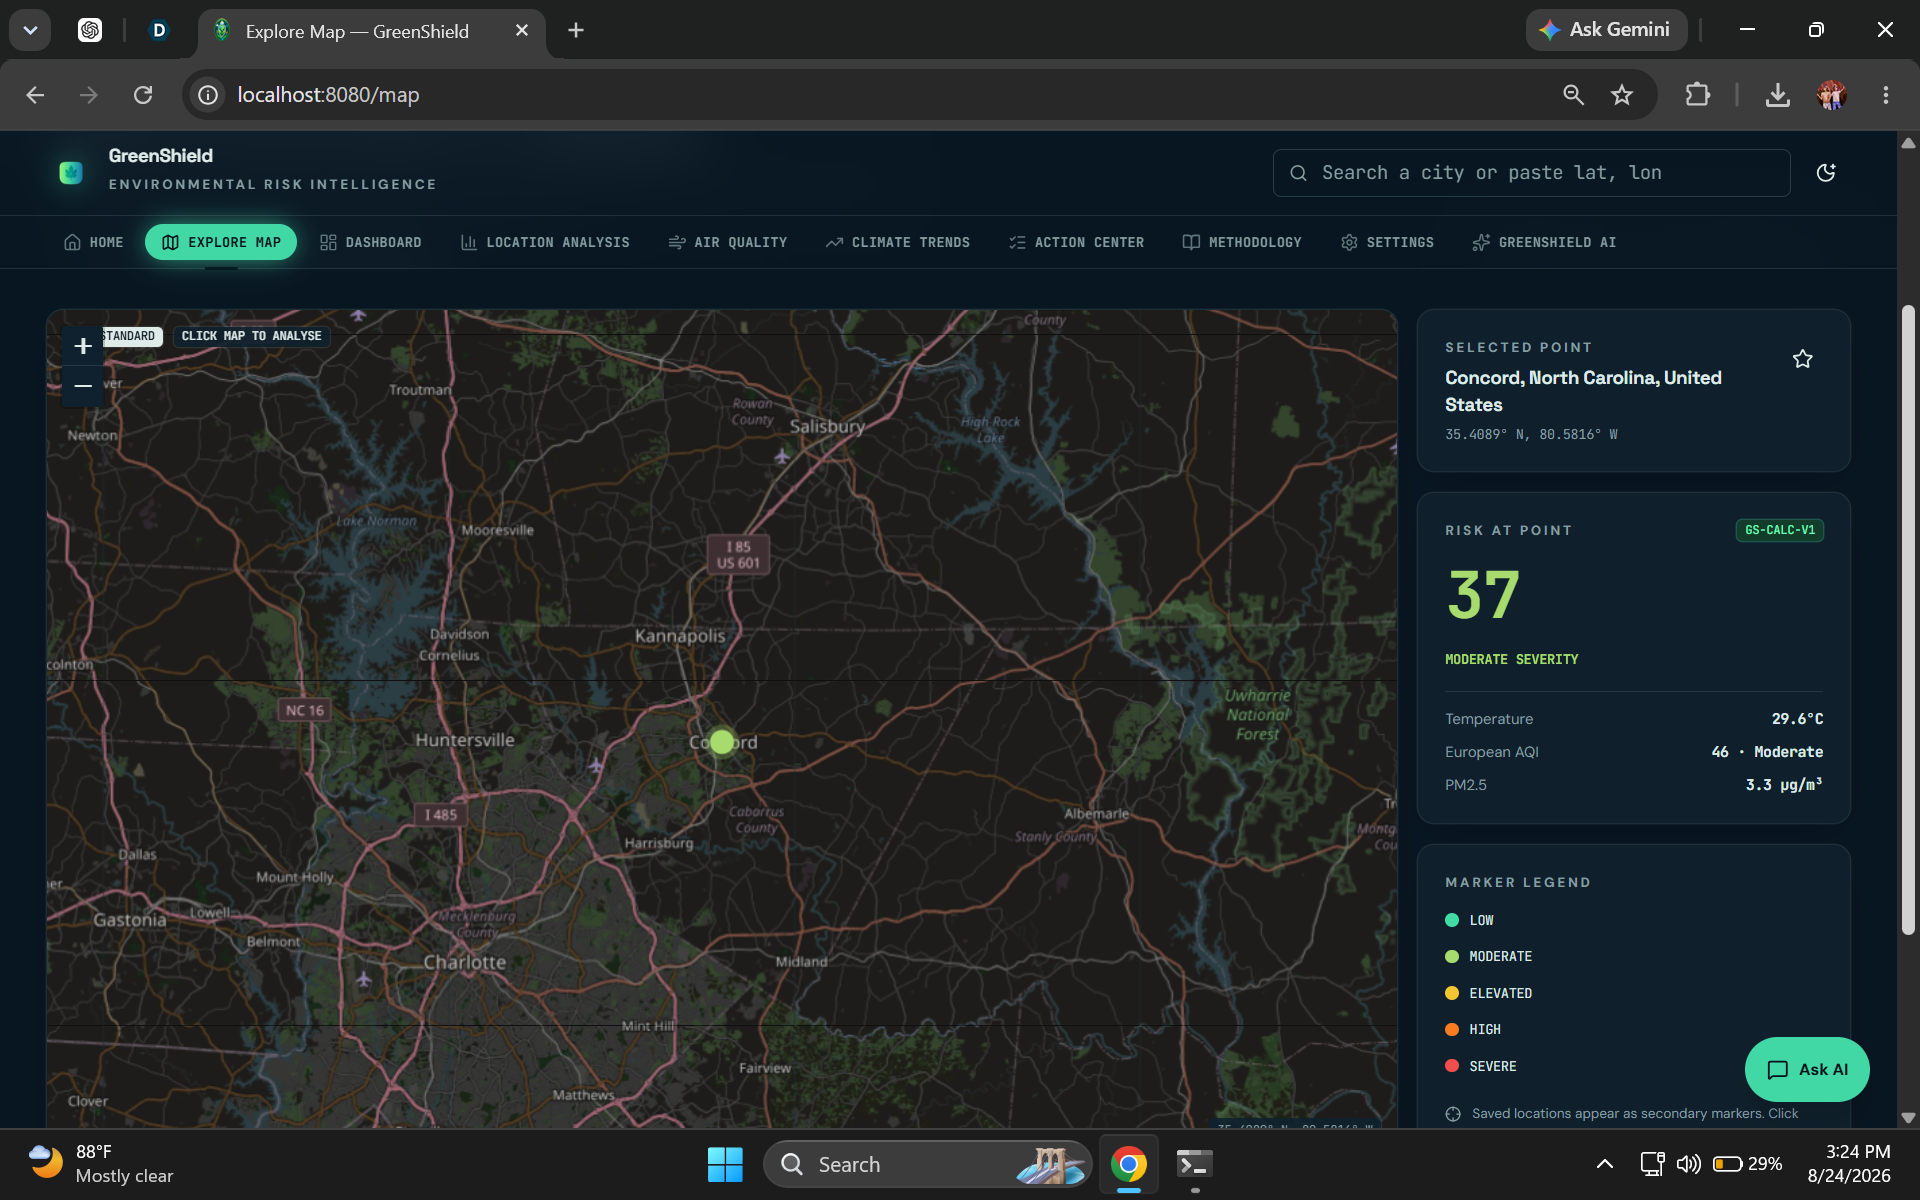
Explore Map view for selecting a location and viewing its environmental risk directly on an interactive map.
-
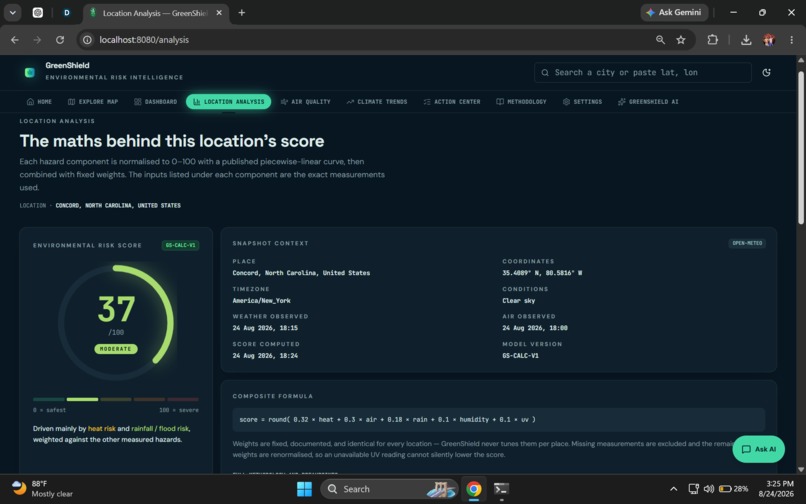
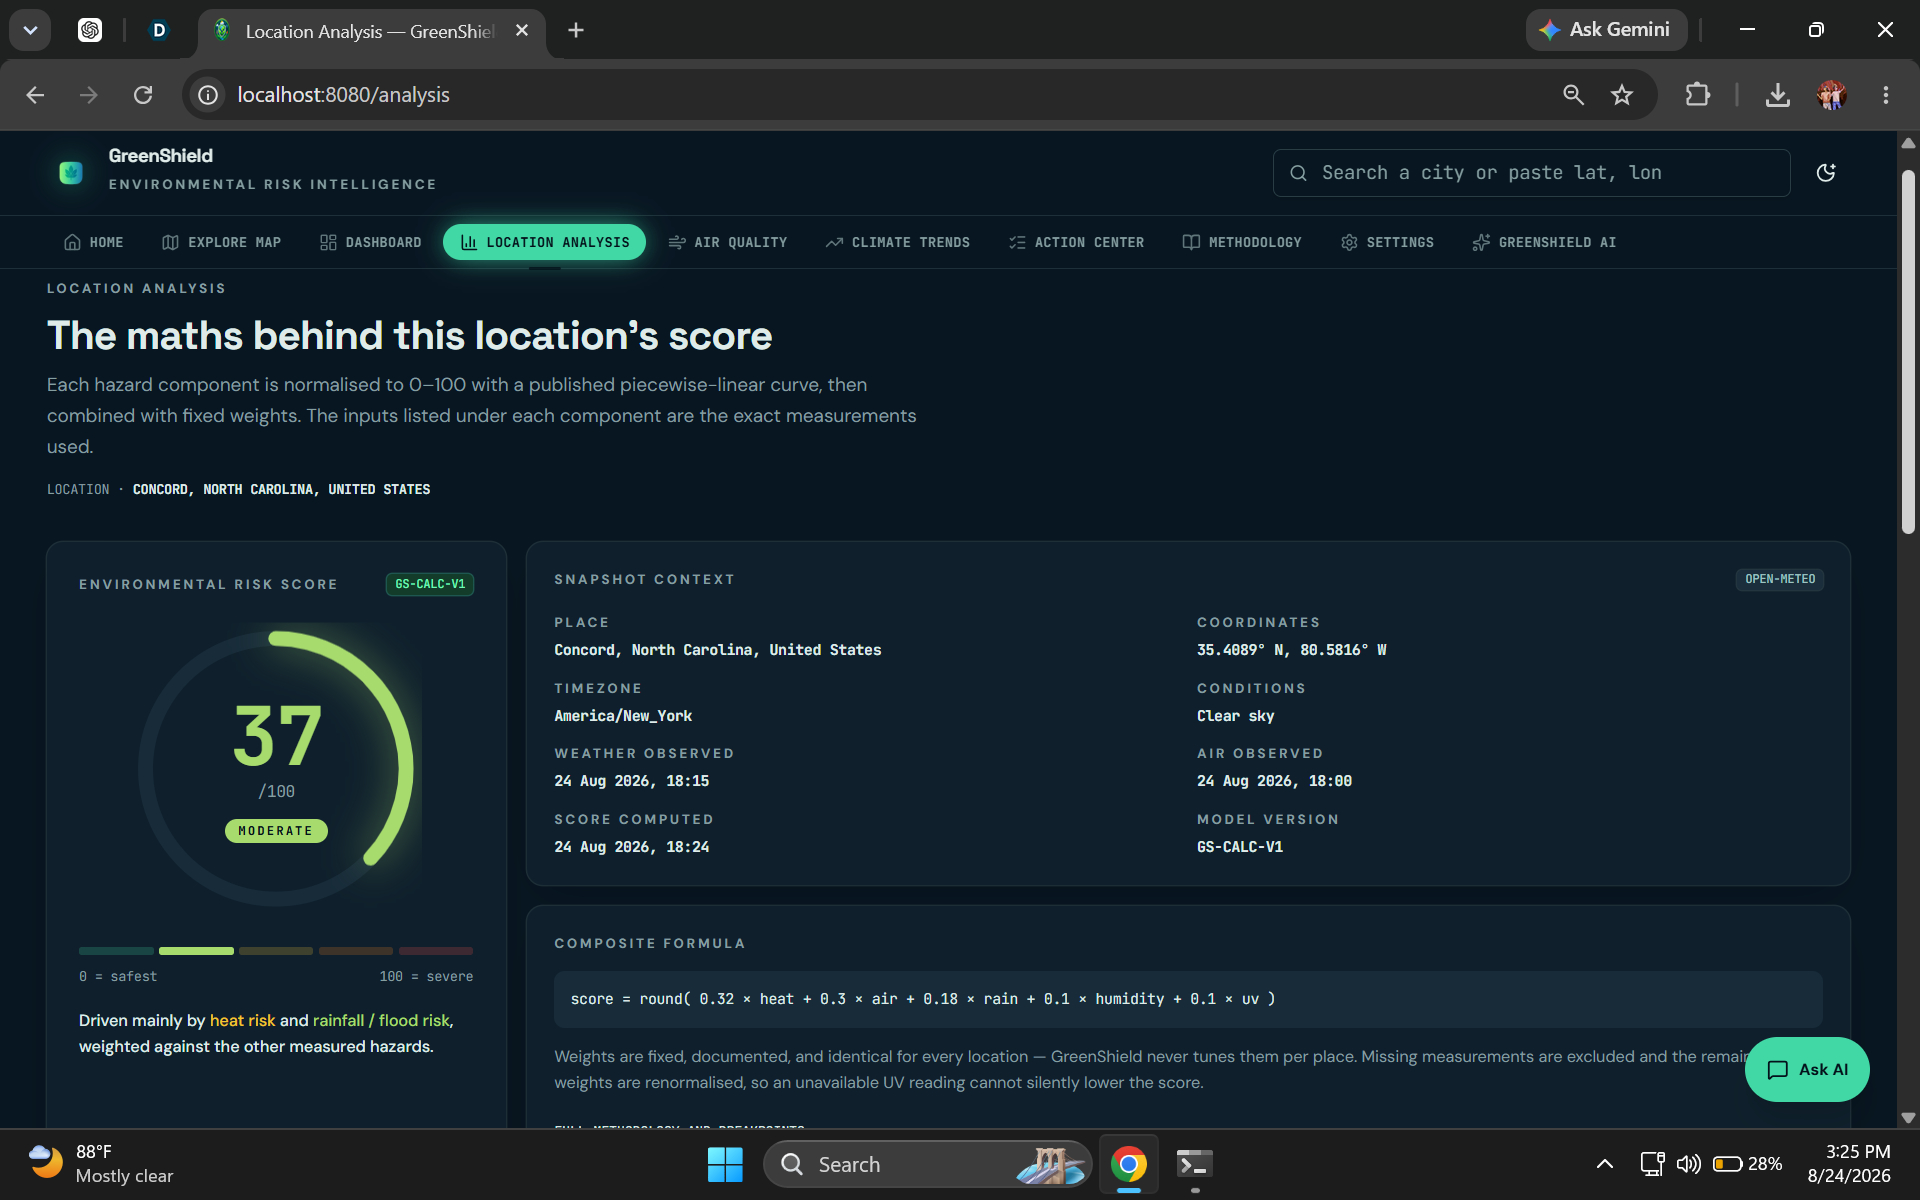
Location Analysis explains how GreenShield calculates the Environmental Risk Score using normalized hazard components.
-
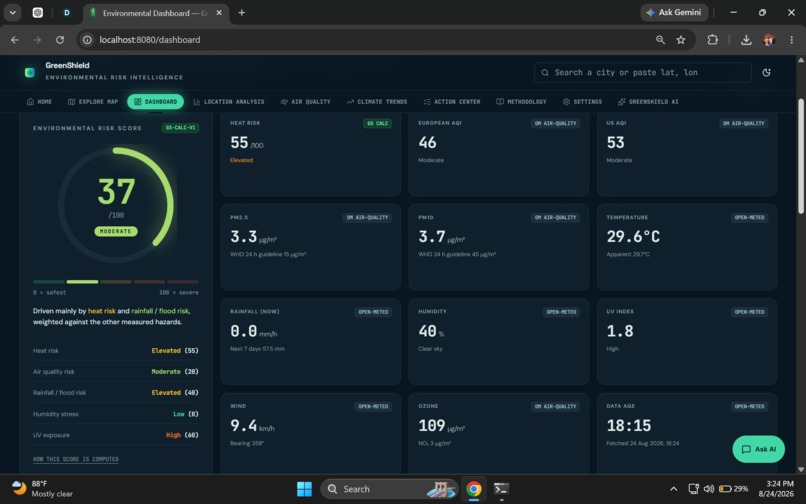
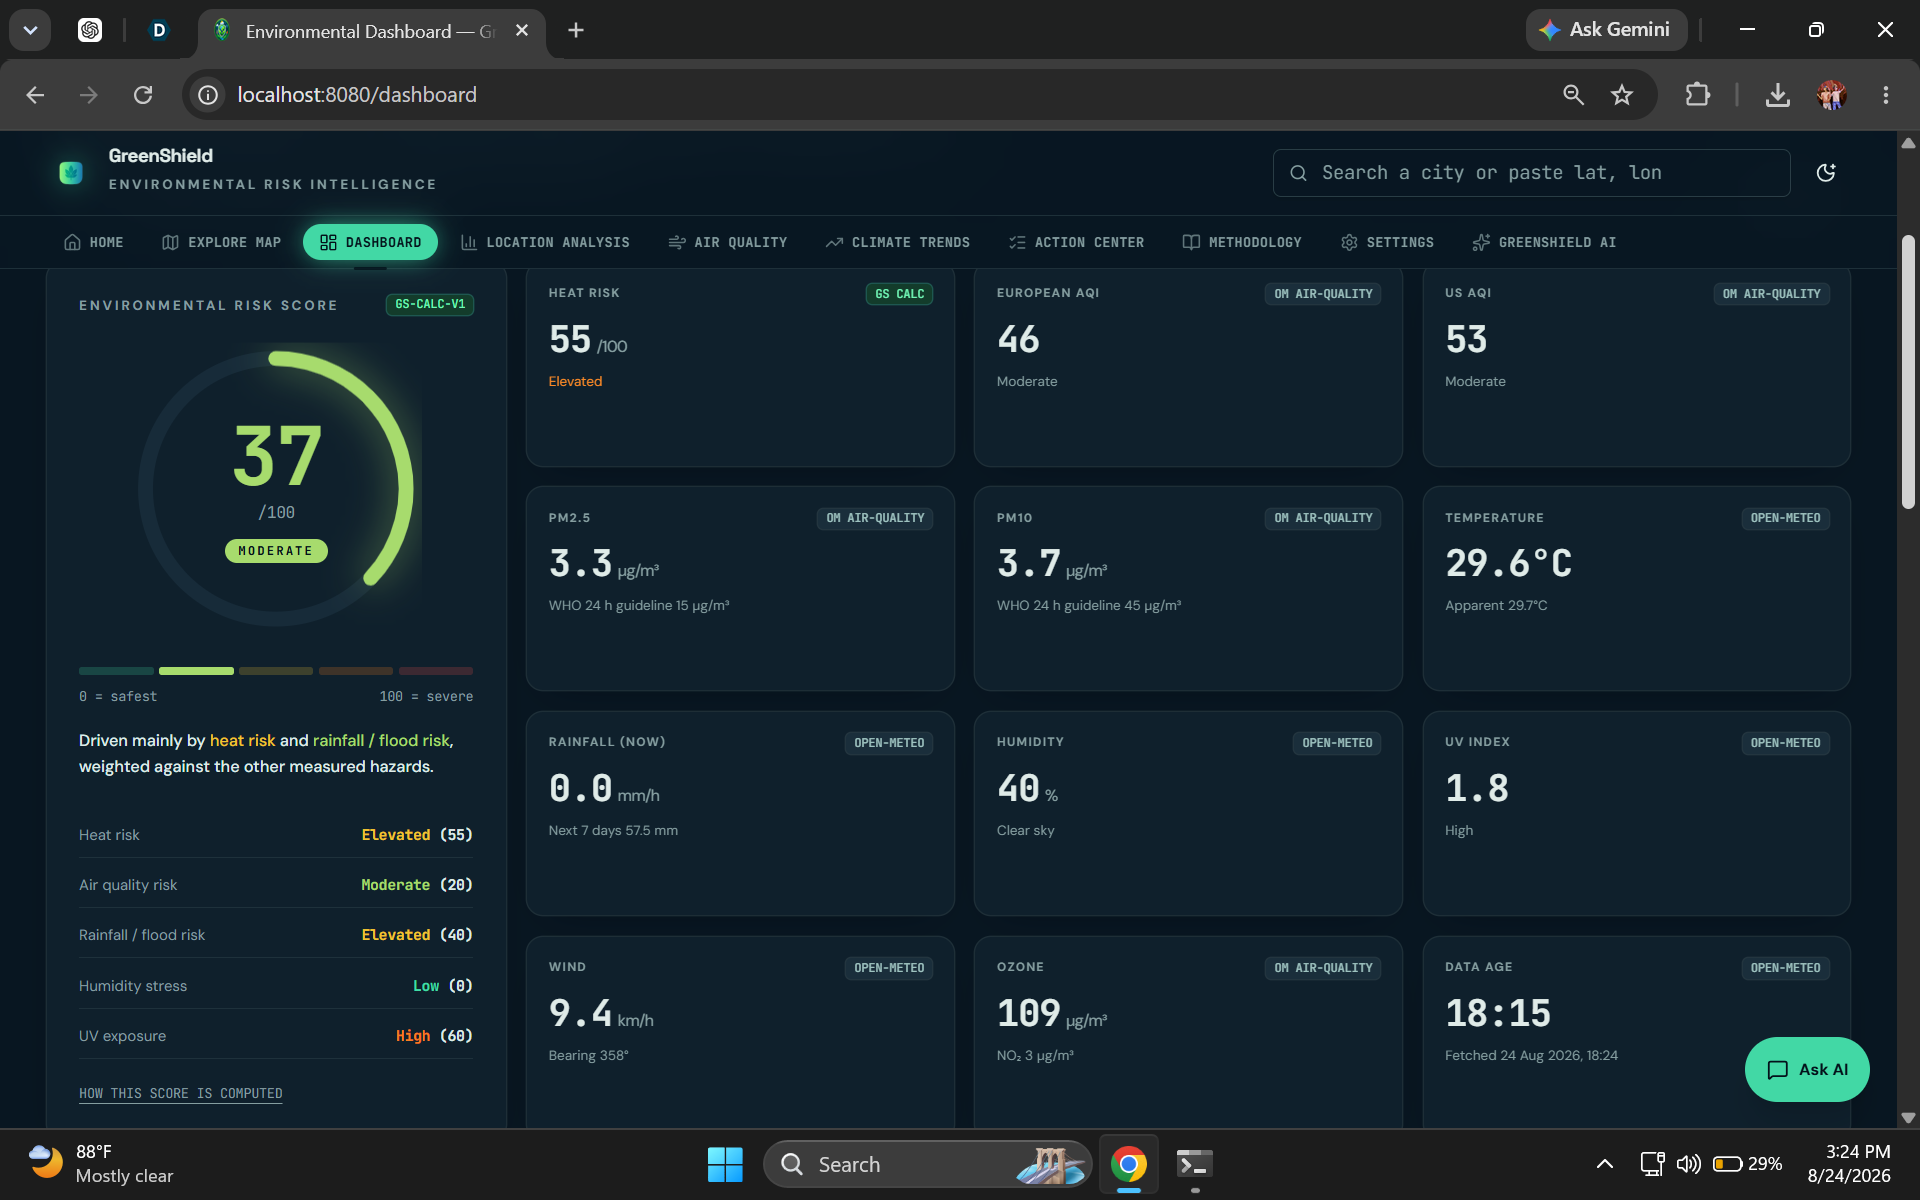
Dashboard overview combining heat, air quality, rainfall, humidity, UV, wind, and other environmental measurements.
-
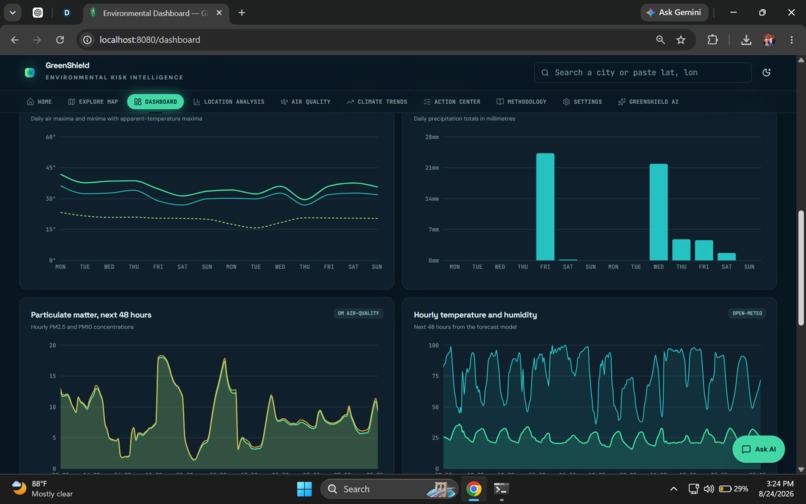
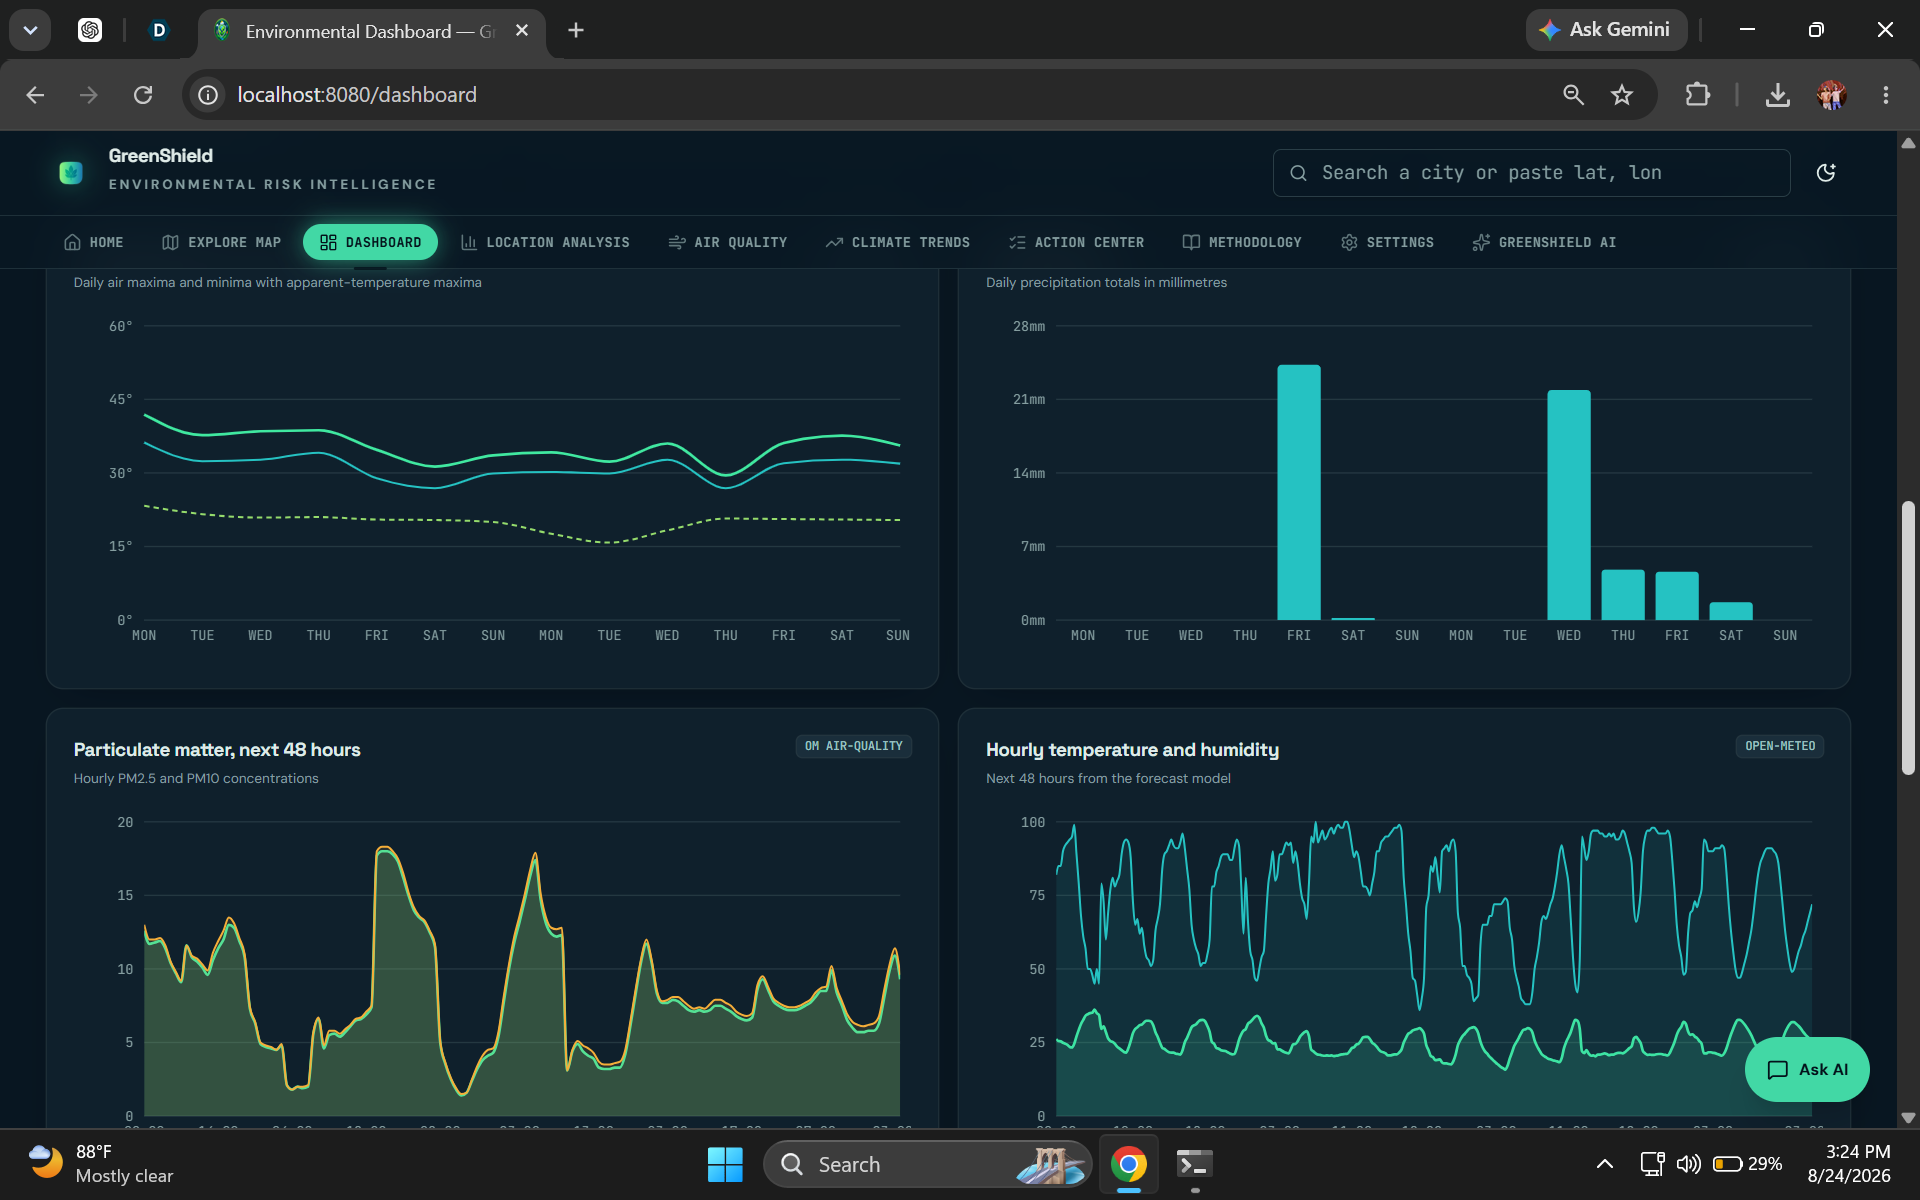
Climate charts show temperature and precipitation trends to help understand changing environmental conditions.
-
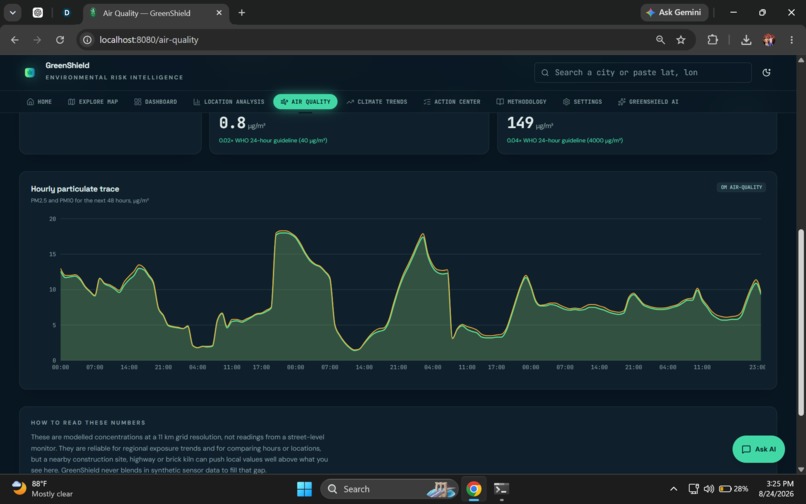
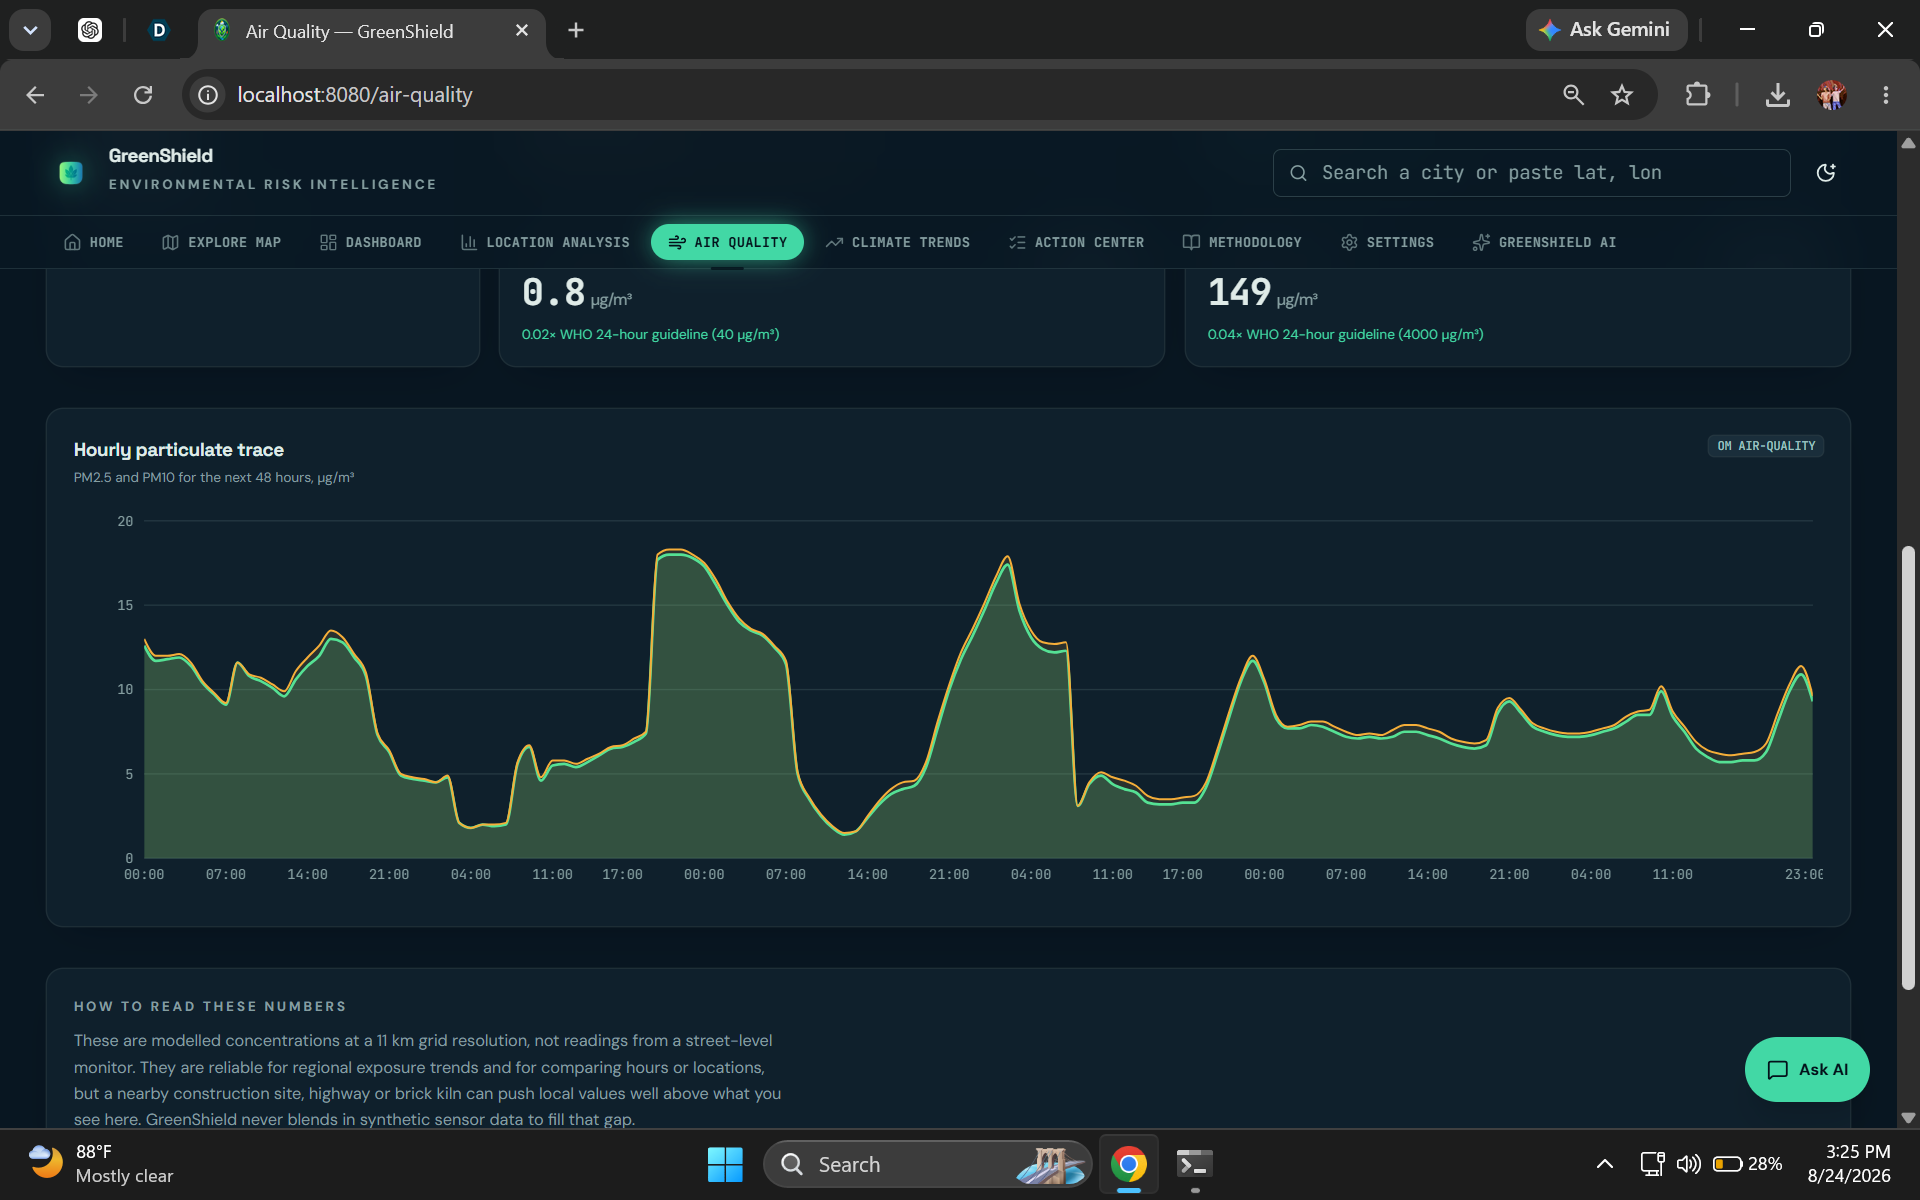
Hourly particulate matter visualization showing PM2.5 and PM10 trends over the next 48 hours.
-
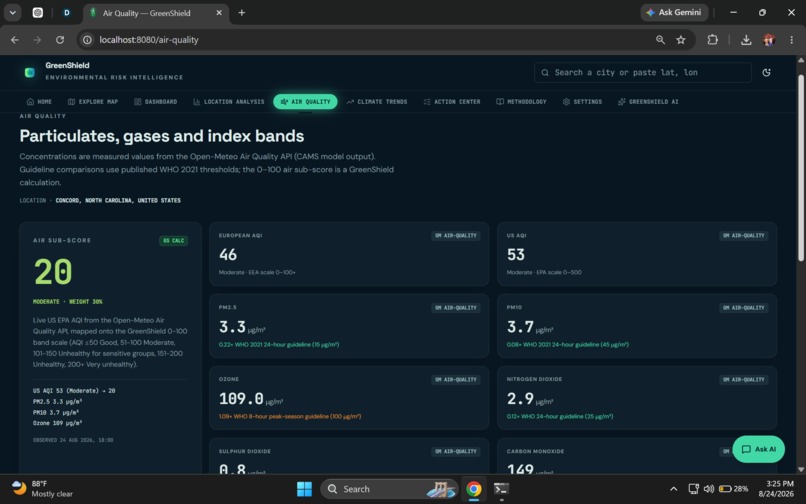
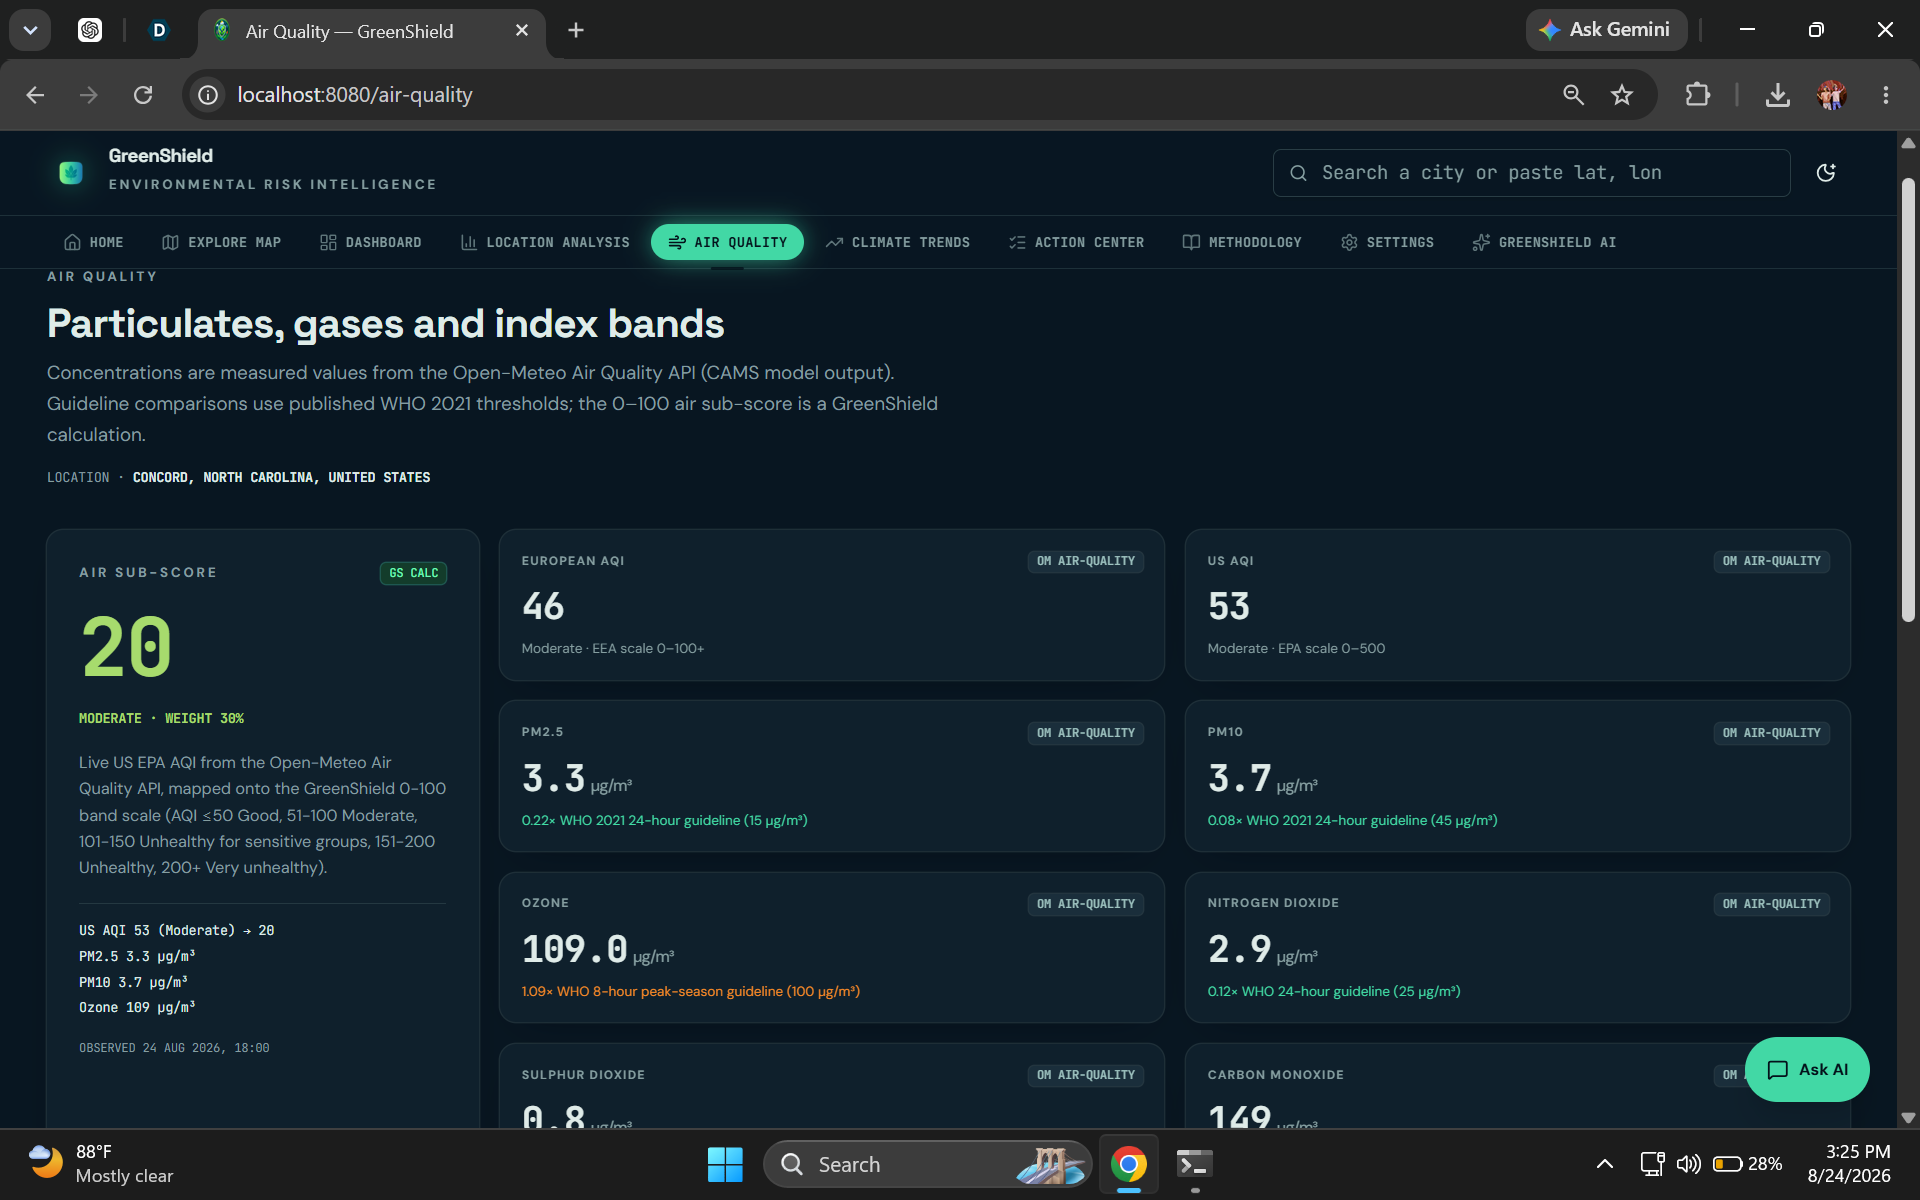
Air Quality dashboard displaying AQI, PM2.5, PM10, ozone, nitrogen dioxide, and other pollutant measurements.
-
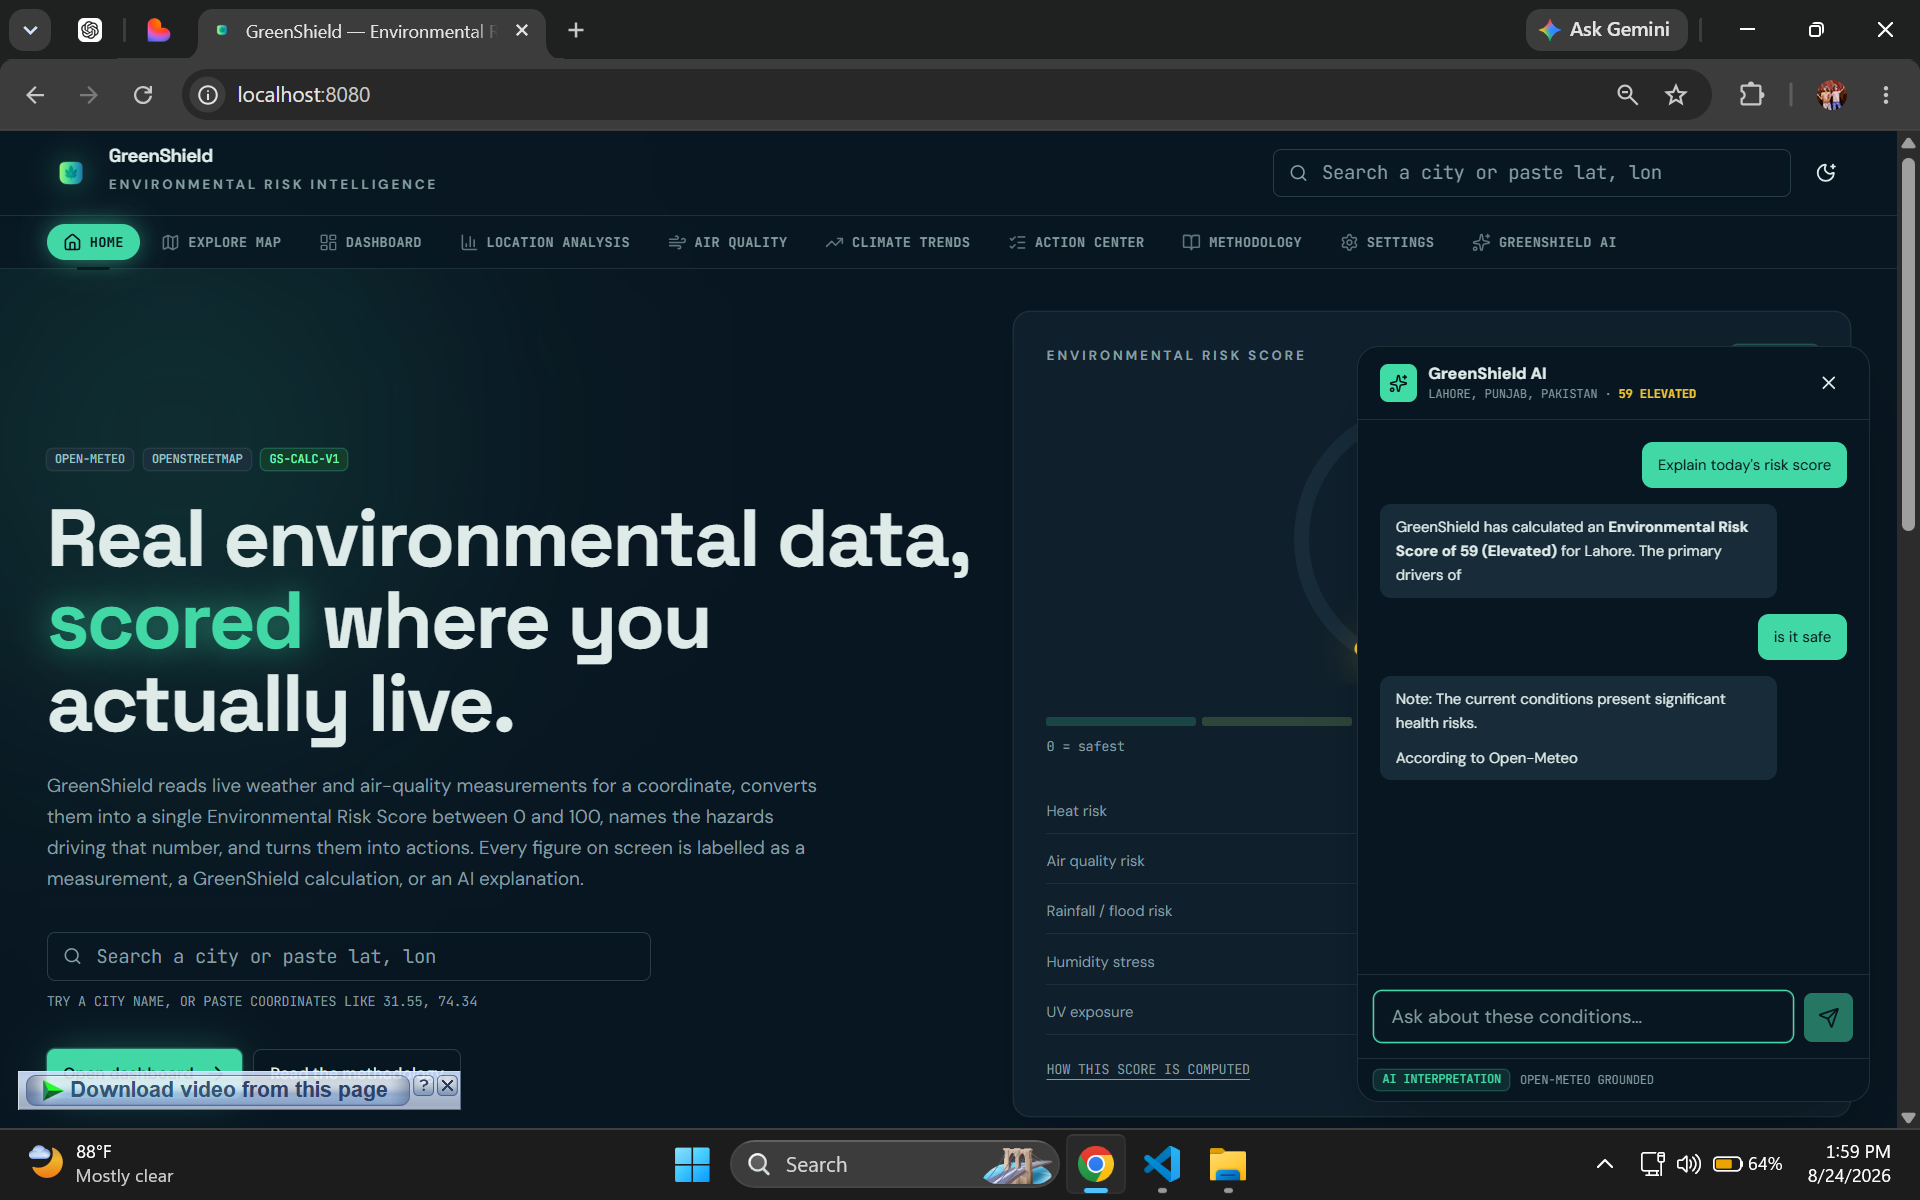
GreenShield AI provides a simple explanation of the current environmental risk and its main contributing factors.
-
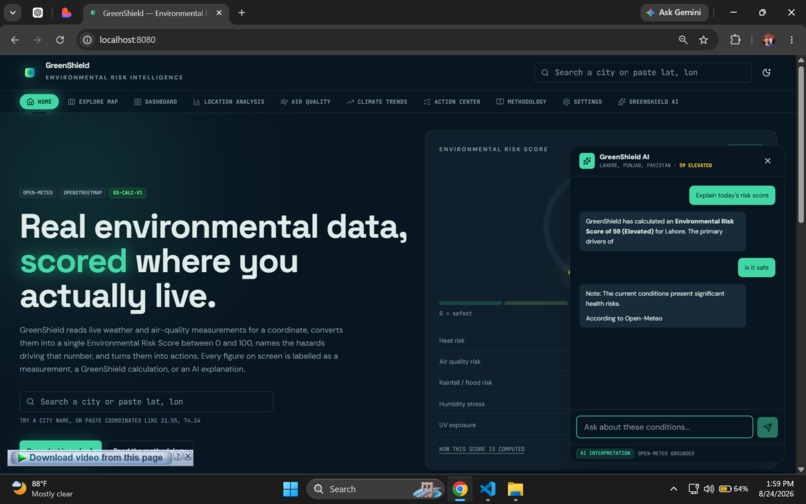
Real-time risk scoring turns environmental measurements into a clear 0–100 score for easier decision-making.
-
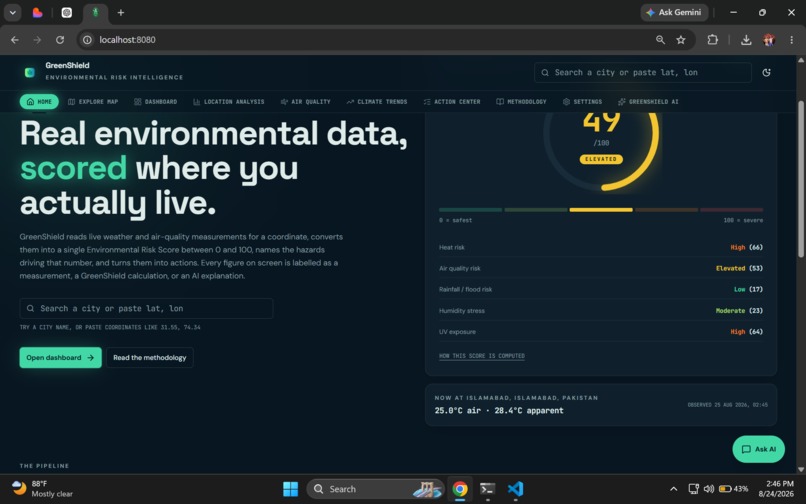
GreenShield brings weather, air quality, location analysis, climate trends, and actionable insights into one platform.
Inspiration
Environmental conditions can change quickly, but people often see separate weather and air-quality numbers without understanding what they mean for their daily lives. We wanted to turn complex environmental data into one clear, location-specific picture of risk.
What it does
GreenShield combines live environmental data with a transparent risk-scoring system to calculate an Environmental Risk Score from 0–100. It identifies key risks such as heat, air quality, rainfall/flooding, humidity, and UV exposure, then provides practical recommendations.
Users can search for a location, explore it on a map, view detailed environmental measurements, analyze risk factors, track climate trends, and ask GreenShield AI questions about the current conditions.
How we built it
GreenShield is a web application built with modern frontend technologies. It uses Open-Meteo for weather and air-quality data, OpenStreetMap/Leaflet for mapping and Nominatim for geocoding. The risk score is calculated using GreenShield's own transparent formula. An AI assistant interprets the collected data while being instructed not to invent missing measurements.
Challenges
The main challenge was combining multiple environmental measurements into a useful score without hiding how the result was calculated. We focused on transparency, clear data attribution, practical recommendations, and an interface that makes environmental information easy to understand.
What's next
Future versions could add historical risk analysis, more environmental datasets, personalized alerts, and improved forecasting to help communities prepare for environmental hazards earlier.
Built With
- api
- css
- gemini
- leaflet.js
- nominatim
- open-meteo
- openstreetmap
- react
- start
- tailwind
- tanstack
- typescript
- zod


Log in or sign up for Devpost to join the conversation.