-
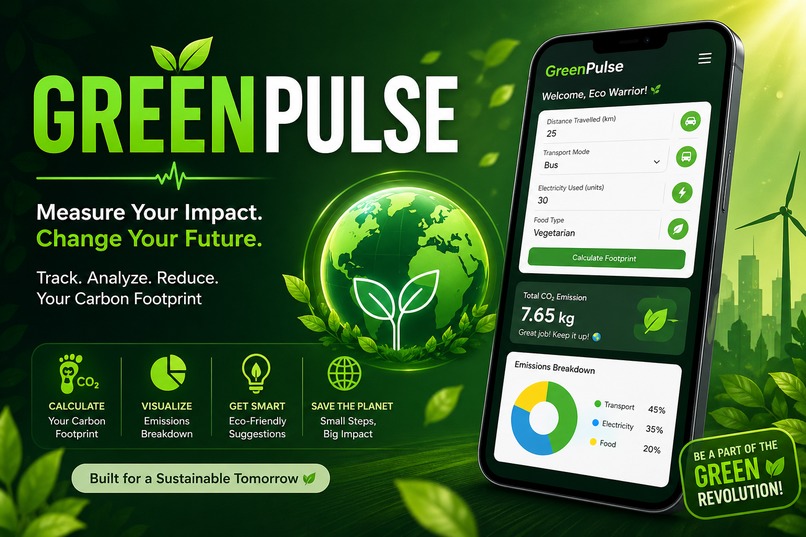
Track today. Save tomorrow.
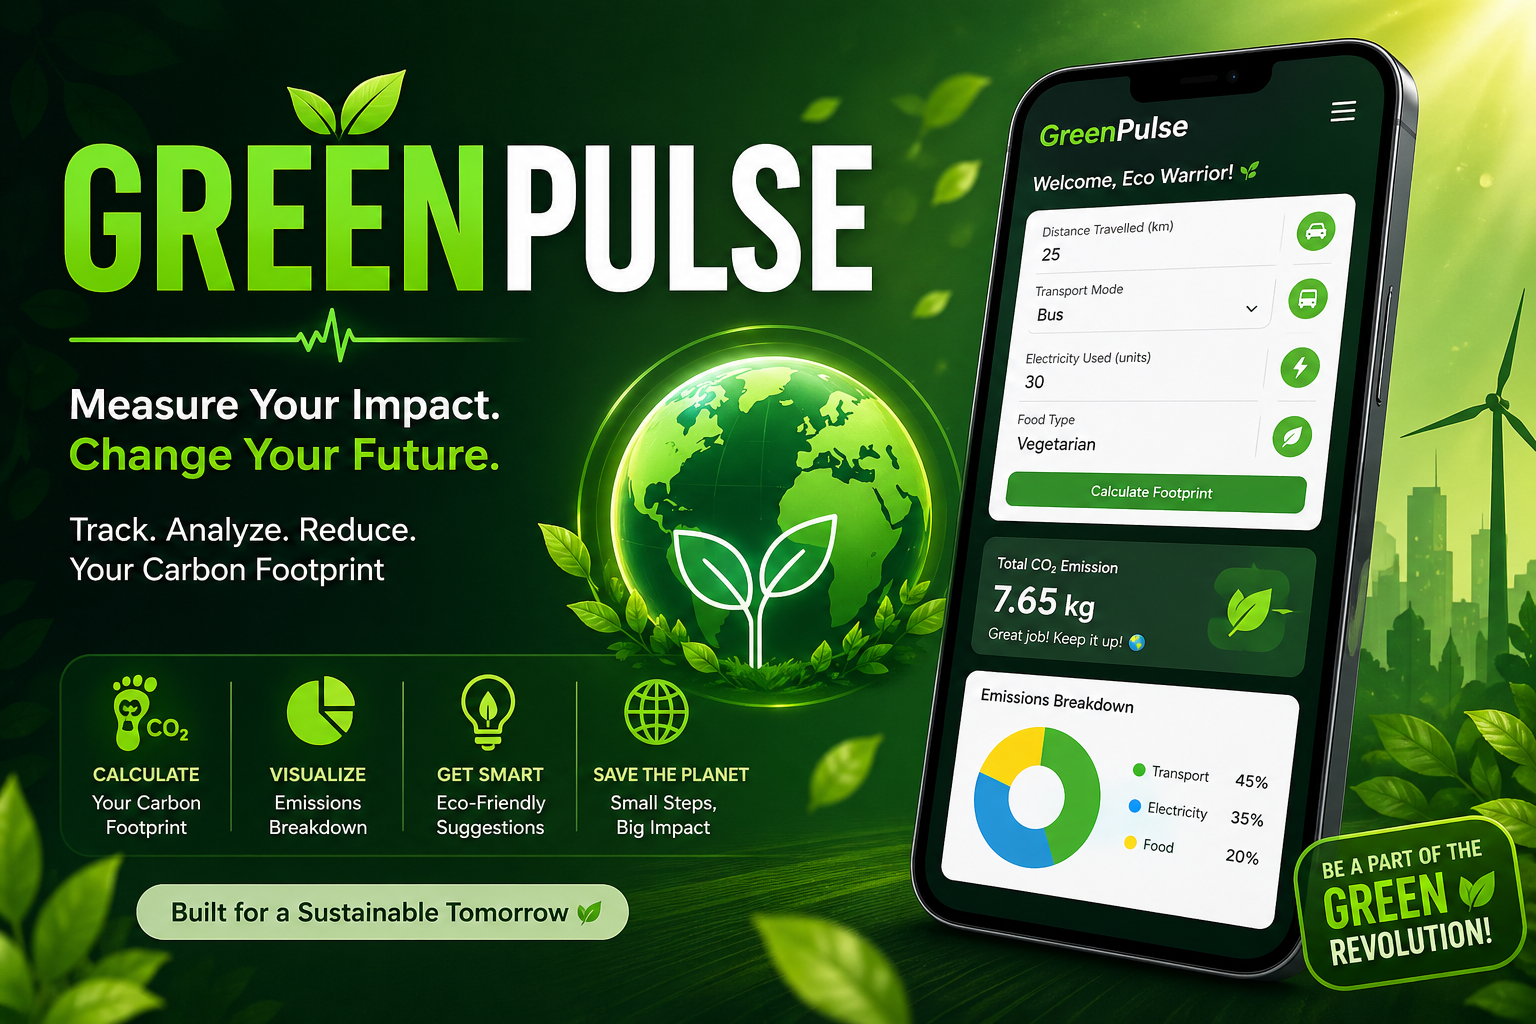
GreenPulse was inspired by the concept of the Carbon Footprint and the realization that climate change is a global challenge driven by everyday individual actions that often go unnoticed. Many people want to live sustainably but lack simple tools to measure their impact or understand how habits such as travel choices electricity usage and diet contribute to emissions. This motivated us to create a solution that makes sustainability accessible by helping users track visualize and reduce their environmental impact in a simple and actionable way.
GreenPulse is a web based application that helps users track and understand their Carbon Footprint based on daily activities such as travel electricity usage and food habits. Users enter simple inputs and the app calculates their total carbon emissions in real time using a simplified formula. It then presents the results through clear visual charts and provides smart suggestions to help reduce environmental impact. The platform makes sustainability easy to understand by turning everyday actions into measurable insights and guiding users toward more eco friendly choices.
GreenPulse was built as a lightweight web application using HTML CSS and JavaScript to ensure fast development and smooth performance within a hackathon environment. I designed a simple user flow starting with a basic login system using LocalStorage followed by a dashboard where users can input their daily activities such as travel electricity usage and food habits. The core functionality was implemented using a simplified carbon calculation model to estimate emissions in real time. To make the data more understandable and engaging I integrated Chart.js for visualizing emission breakdowns through charts. I also added smart rule based suggestions to guide users toward more sustainable choices and used the browser Geolocation API to enable future location based enhancements. The interface was styled with responsive design principles to ensure it works smoothly across devices and the entire project was structured to be easily deployable as a web application.
One of the biggest challenges was balancing simplicity with meaningful accuracy while working with the concept of a Carbon Footprint since real world emission calculations are complex but the app needed to stay easy to use. Another challenge was managing time during the hackathon and prioritizing core features like calculation logic visualization and user experience instead of trying to build too many features. Integrating Chart.js for real time data visualization also required careful handling to ensure charts updated correctly without performance issues. Designing smart suggestions without using full AI was another hurdle so I created rule based logic that still feels helpful and relevant. Additionally making the interface responsive and smooth across different devices while keeping the design clean required quick iterations and testing.
I am proud that GreenPulse successfully transforms the idea of a Carbon Footprint into a simple and usable tool that anyone can understand and interact with. Within a limited hackathon timeframe I was able to build a complete working application including login dashboard calculation logic and data visualization using Chart.js. One of the key accomplishments was simplifying complex environmental data into a clear and responsive system that provides real time feedback and meaningful suggestions. I also achieved a clean and responsive user interface that works smoothly across devices while integrating multiple features into a cohesive and functional product. Most importantly I am proud of creating a project that goes beyond just a demo and has the potential to encourage real world sustainable behavior.
Building GreenPulse taught me that solving real world problems like understanding a Carbon Footprint is more about clarity and usability than complexity. I learned how to break down a large abstract problem into a simple and functional solution by focusing on core features and avoiding unnecessary scope. This project strengthened my skills in frontend development and integrating tools like Chart.js to make data more intuitive and impactful. I also learned how to balance accuracy with simplicity especially when working with environmental data and how rule based logic can effectively simulate intelligent suggestions. Beyond technical skills this experience improved my time management problem solving and ability to build a complete working product under pressure.
GreenPulse will evolve from a simple tracker into a smarter sustainability platform by improving the accuracy of Carbon Footprint calculations using region specific data and more detailed activity tracking. The next step is to introduce AI driven insights that provide personalized recommendations based on user behavior over time. We also plan to expand the platform into a mobile application with cloud integration so users can track their impact seamlessly across devices. Future updates will include advanced data visualization using tools like Chart.js gamification features such as challenges and leaderboards and potential integration with smart devices to automatically monitor energy usage. The long term vision is to make GreenPulse a comprehensive assistant that not only tracks emissions but actively helps users reduce them in meaningful and measurable ways.


Log in or sign up for Devpost to join the conversation.