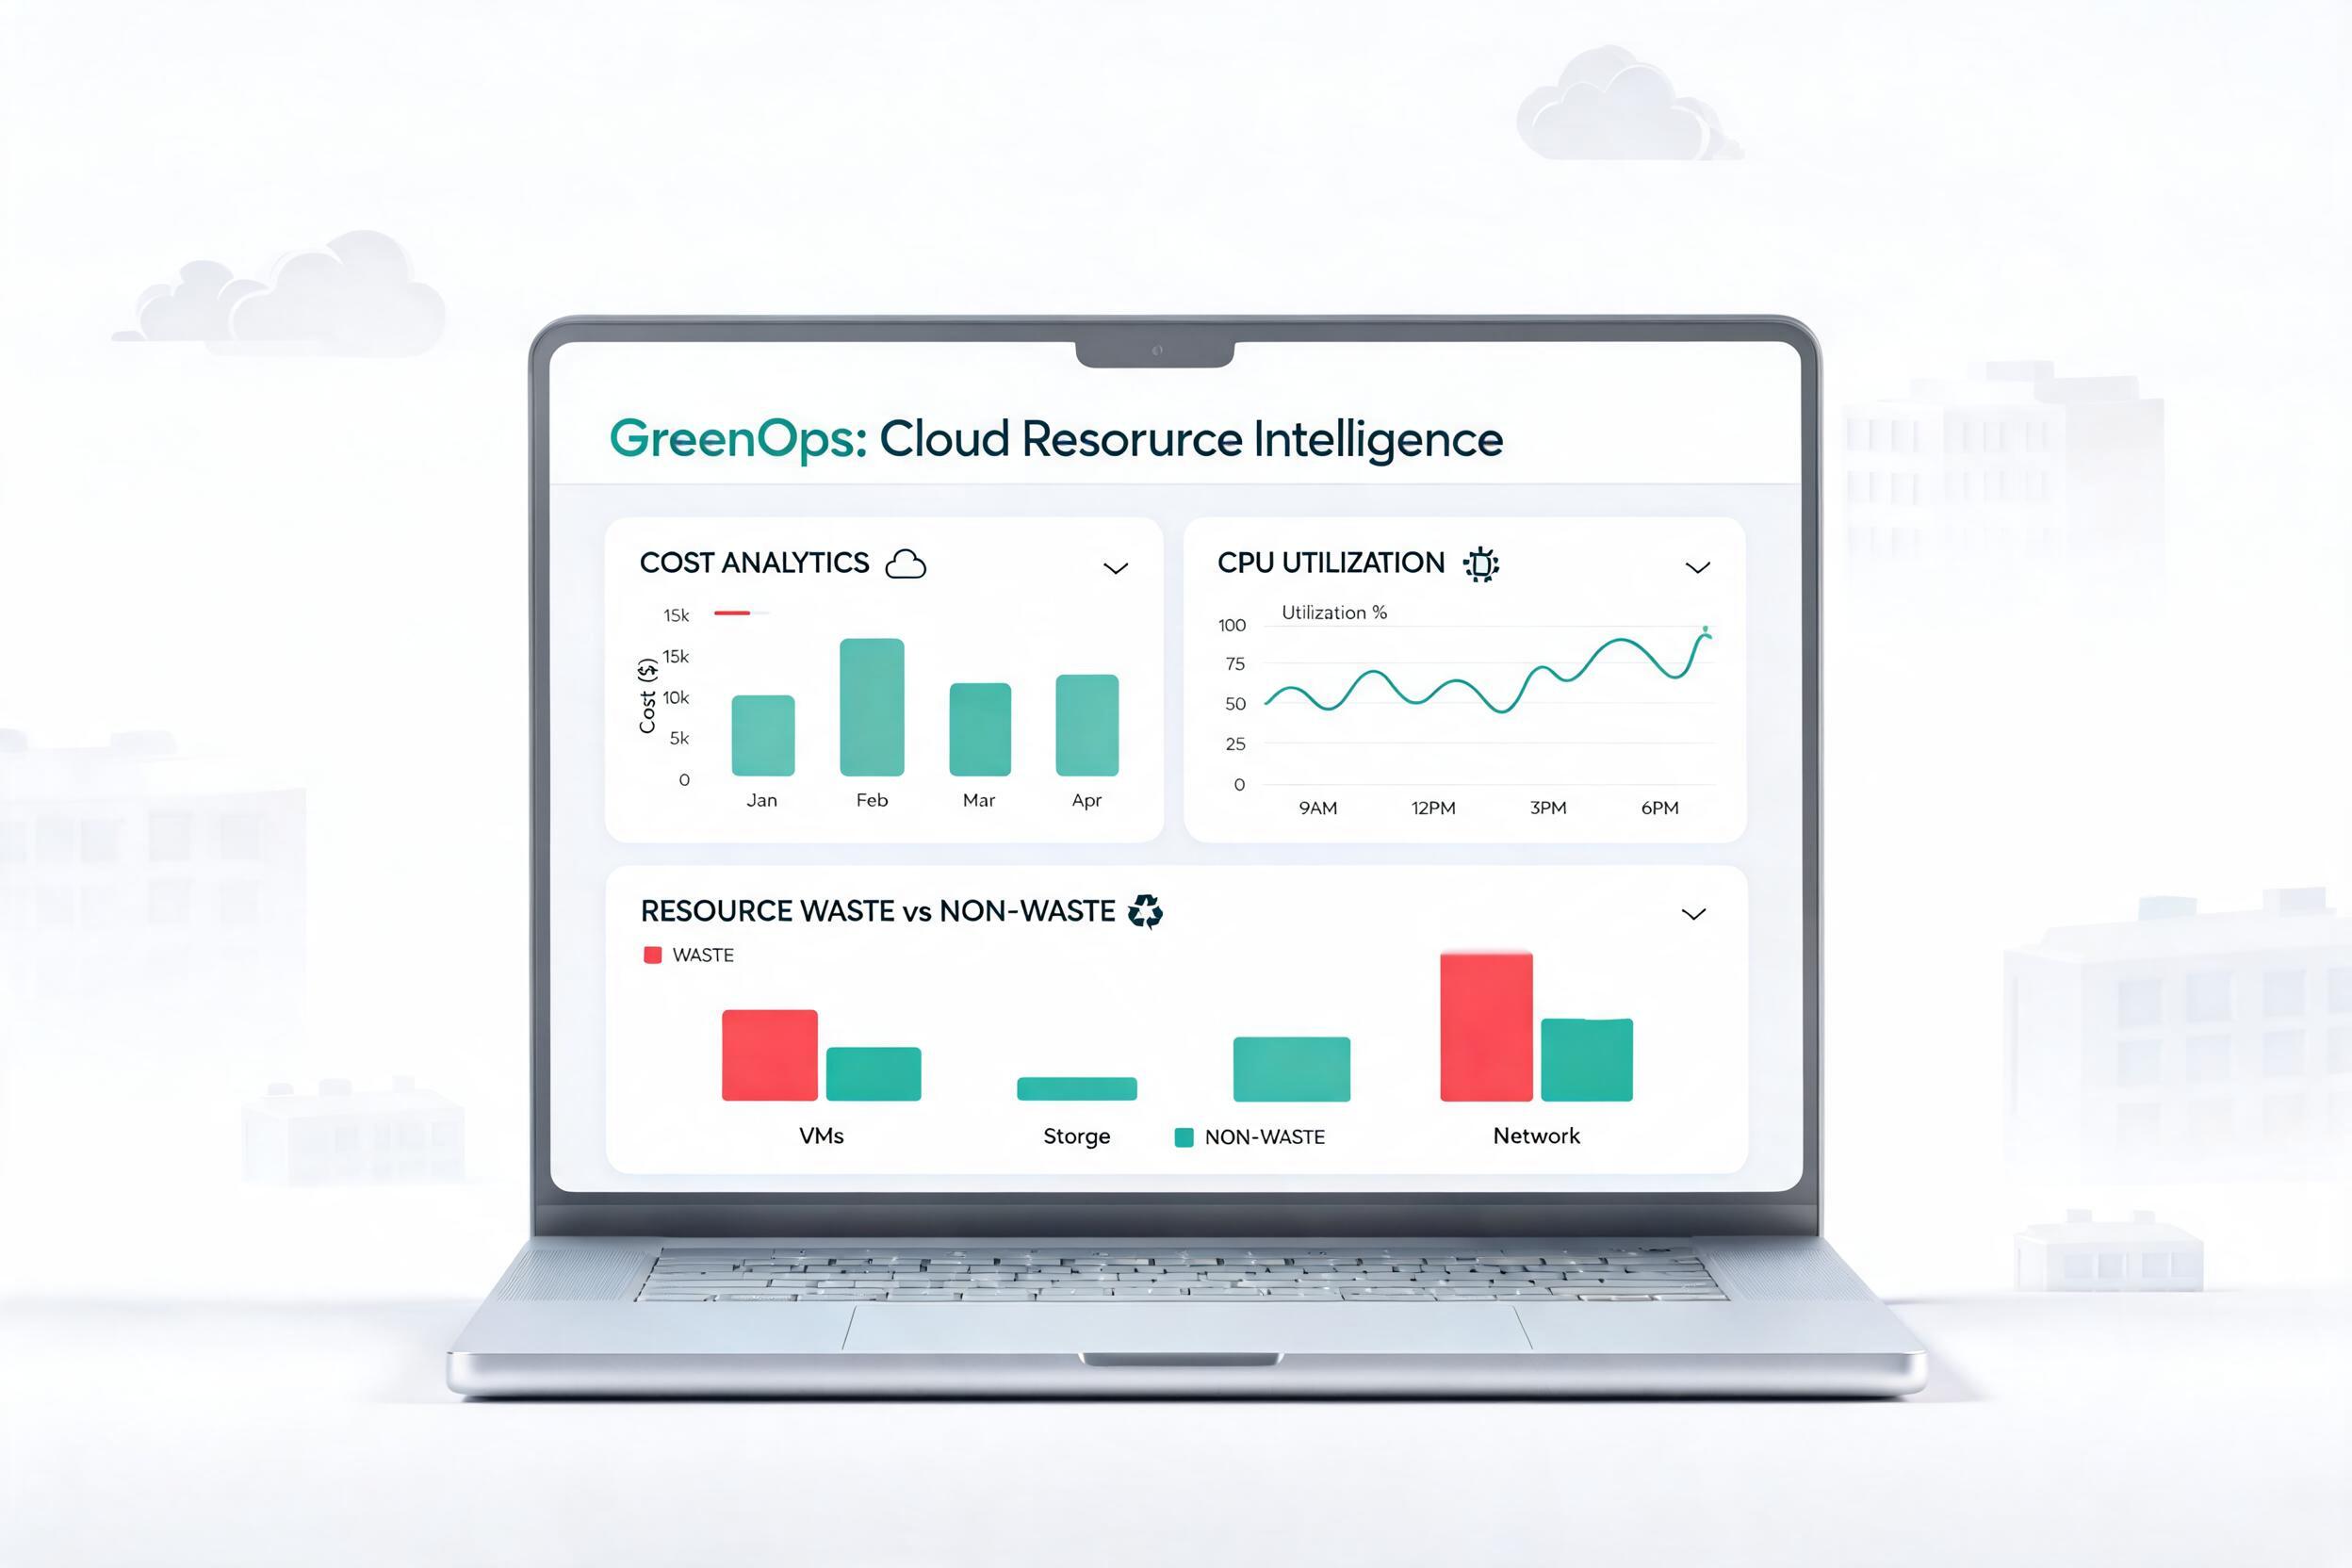
GreenOps: Cloud Resource & Sustainability Intelligence
AI-powered cloud cost, utilization, waste detection, and sustainability operational intelligence built on Splunk.
GreenOps is a Splunk-based observability and optimization project that turns raw cloud infrastructure telemetry into actionable insights for engineering and operations teams. It combines SPL-powered analytics, Dashboard Studio visualizations, AI-assisted search creation, LLM-driven summaries, and real-time sustainability intelligence via MCP to help teams detect waste, monitor utilization, and make smarter, greener infrastructure decisions faster.
Why this project matters
Cloud environments create a constant tension between reliability, speed, cost, and environmental impact. Teams often collect infrastructure data, but they still struggle to convert that data into a clear view of waste, underutilization, and carbon footprint reduction opportunities. GreenOps addresses that gap by turning cloud resource events into a practical decision system for cost and efficiency management inside Splunk.
This matters because a dashboard alone is not enough, and an LLM alone is not enough. Teams need a workflow where telemetry is searchable, insights are visual, and AI can help explain what is happening, what to look at next, and how industry trends in sustainability apply to their operations. GreenOps brings those pieces together in one operator-friendly experience.
What GreenOps includes
GreenOps is designed as a complete, end-to-end project rather than a single visualization. The solution includes the following core layers:
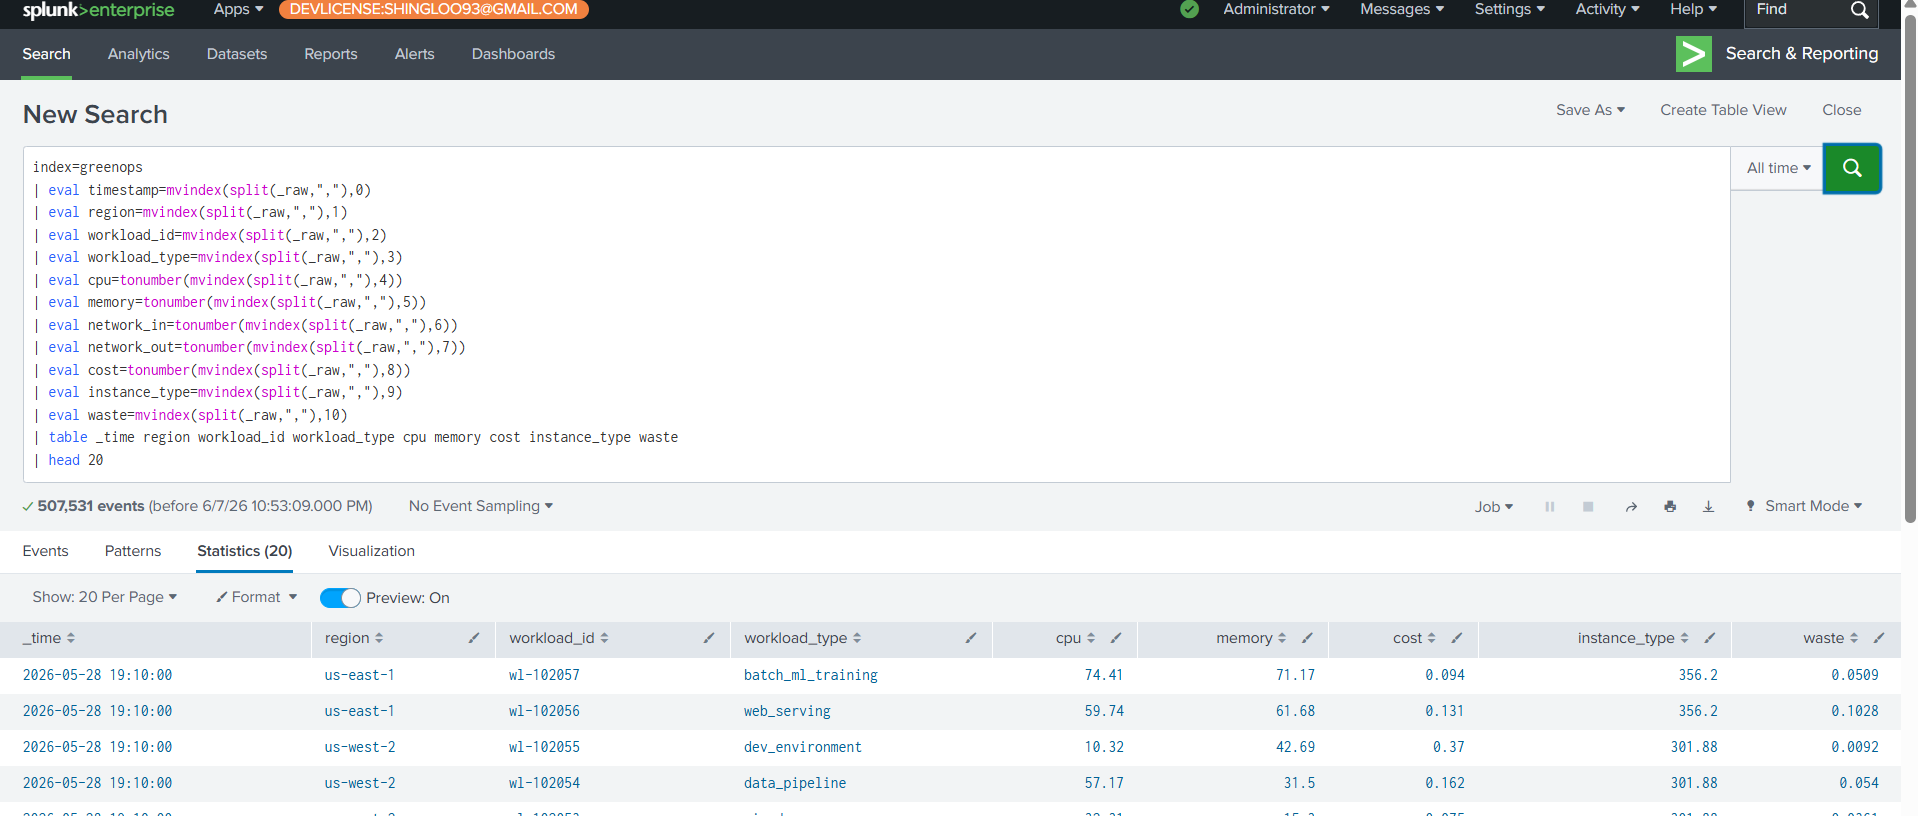
- Splunk data ingestion and search layer for cloud telemetry stored in the
greenopsindex, enabling SPL-based analysis over workload, region, utilization, instance type, and cost-related fields inferred from raw events. - Interactive Multi-Tab Dashboard Studio interface for a polished analytical interface with KPI cards, charts, tables, filters, and trend views. This includes a dedicated Sustainability Intelligence tab with isolated time-pickers.
- Sustainability Intelligence Feed powered by Bright Data MCP. This layer continuously fetches AI-ranked search results and news regarding green computing, energy efficiency, and data center sustainability, streaming them directly into Splunk via HTTP Event Collector (HEC).
- Splunk MCP Server Integration: A custom Splunk MCP server has been created that can be connected to the local server. This allows AI agents and external tools to seamlessly interact with Splunk data, run SPL queries, and fetch operational intelligence directly via the standard MCP protocol.
- Splunk AI Assistant for SPL workflow to speed up SPL generation, explanation, refinement, and environment-aware search creation using natural language.
- LLM-powered summarization using Groq-backed prompting (e.g., Llama 3) to convert raw events into short natural-language waste summaries.
- Agentic AI design direction where the system does not only display data, but helps interpret data, guide investigation, and reduce operator effort using tools like local stdio-based MCP processing.
Together, these layers make GreenOps more than a dashboard. It becomes a compact agentic operations experience focused on cloud efficiency, cost management, and environmental sustainability.
Key dashboard capabilities
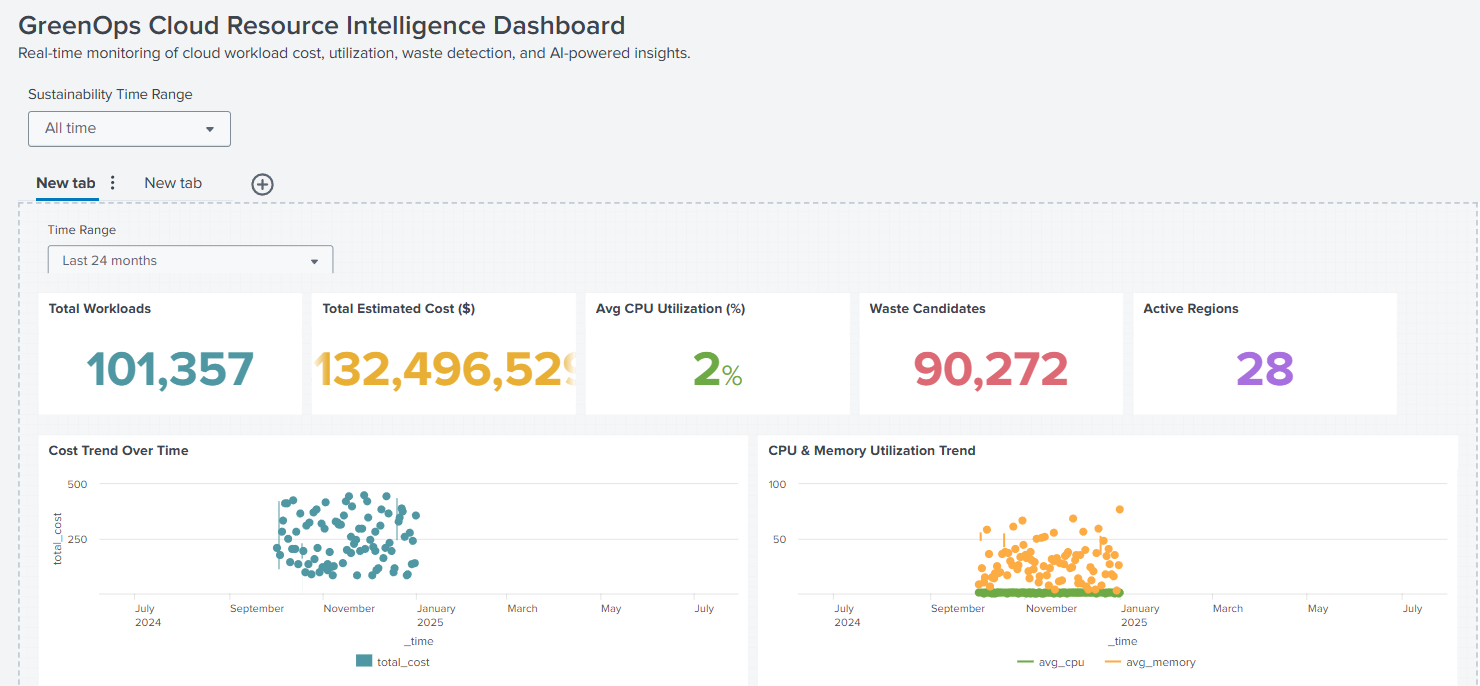
The GreenOps dashboard is built in Splunk Dashboard Studio, which is designed for visually compelling and highly customizable dashboards. The dashboard includes both summary metrics and deeper diagnostic views so users can move from “what changed?” to “where is the problem?” quickly.
KPI tiles
The dashboard includes top-level KPI panels for fast executive and operator visibility:
- Total workloads
- Total estimated cost
- Average CPU utilization
- Waste candidate count
- Active region count
Trend and distribution views
The primary dashboard tab includes charts and tables for:
- Cost trend over time
- CPU and memory utilization trend
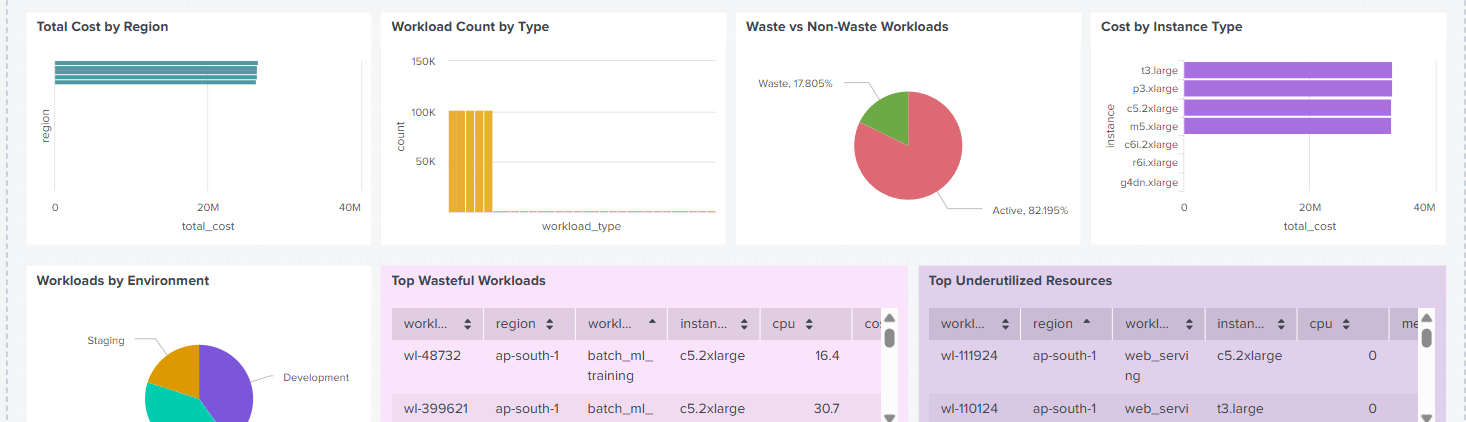
- Total cost by region
- Cost by instance type
- Waste vs non-waste workload split
- Workload count by environment
- Workload count by type
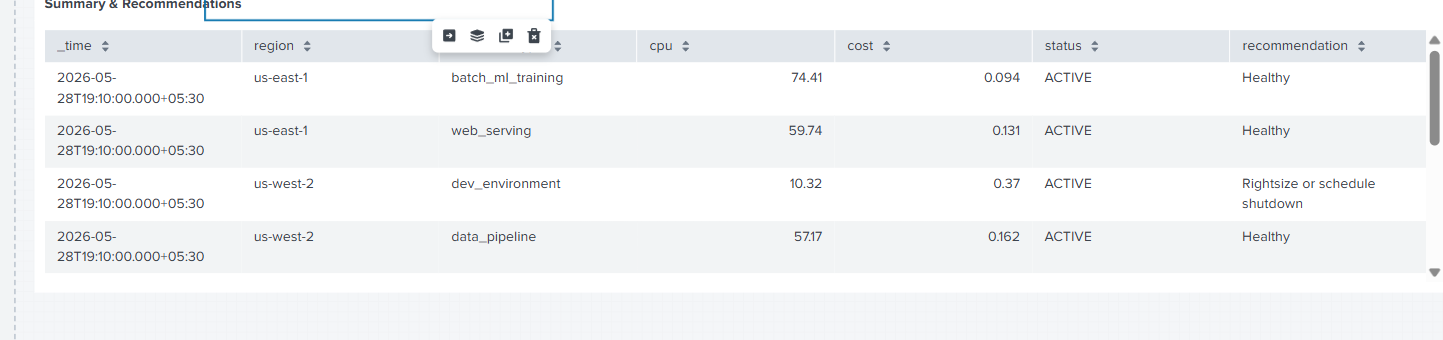
- Top wasteful workloads
- Top underutilized resources
- AI-generated event summaries
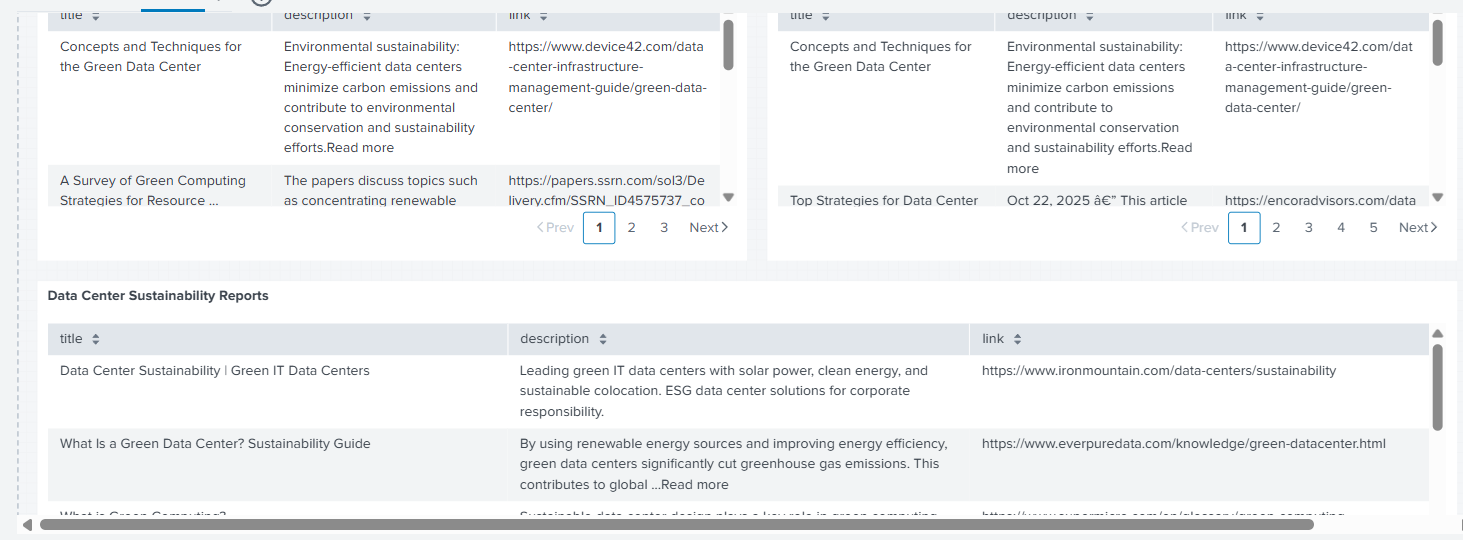
Sustainability Intelligence Tab
A dedicated secondary tab provides live, AI-curated intelligence feeds leveraging the Bright Data MCP's discover tool. Panels include:
- Green Computing Articles
- Energy Efficiency News
- Data Center Sustainability Reports
- Carbon Reduction Initiatives
- Renewable Energy Technology Updates
Interactive controls
The dashboard uses interactive inputs such as global time range, region, workload type, and waste-related filtering. It also features tab-specific time range pickers (e.g., the Sustainability Time Range) to isolate views without disrupting the global state.
How AI is used in GreenOps
GreenOps uses AI in three distinct but complementary ways.
1. Splunk AI Assistant for SPL
Splunk AI Assistant for SPL is a generative AI-powered assistive experience that translates natural language into SPL, explains SPL, helps optimize searches, and supports data discovery in Splunk environments. This shortens the path from idea to operational insight.
2. LLM-based operational summaries
GreenOps uses an LLM-style workflow to summarize potential waste signals from events. Instead of forcing operators to manually inspect every raw log, the system generates concise natural-language descriptions of suspected inefficiency or waste patterns using fast inferencing models via Groq.
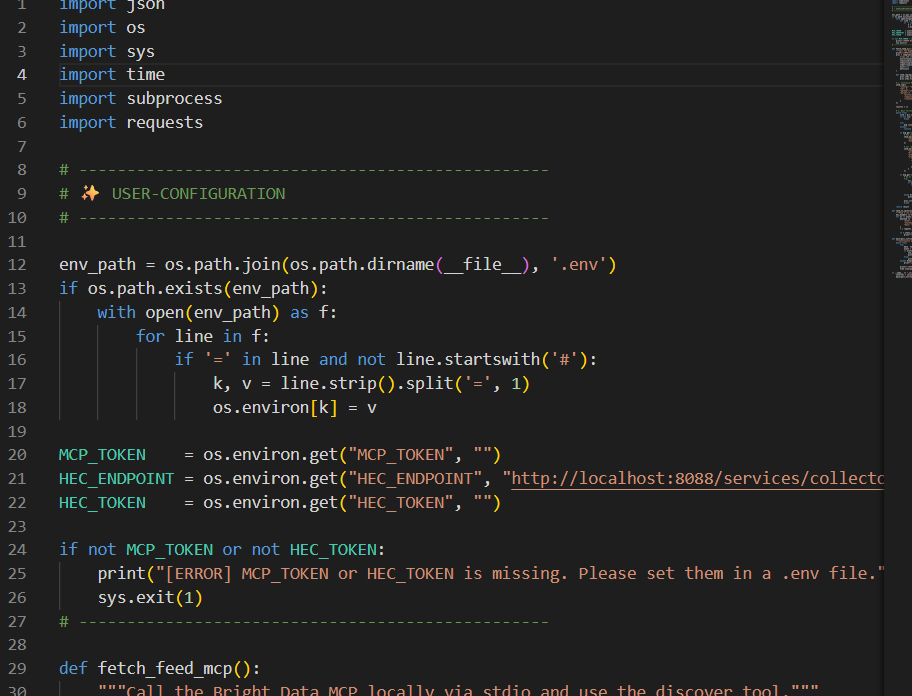
3. AI-Curated External Intelligence (Bright Data MCP)
Using the Bright Data Model Context Protocol (MCP) server, GreenOps executes a background Python worker (fetch_brightdata.py) that uses JSON-RPC over stdio to interact with the MCP's discover tool. This tool uses AI to rank and retrieve the most relevant web search results regarding sustainability, parsing them dynamically and sending them to Splunk via HEC.
Why this is agentic AI
GreenOps fits an agentic AI pattern because it goes beyond passive reporting. It supports a workflow like this:
- A user asks a natural-language question.
- AI helps generate or refine the right SPL.
- Splunk executes the search over real telemetry.
- The dashboard visualizes cost, workload, and utilization patterns.
- A background worker uses an MCP tool to fetch external, AI-ranked sustainability context.
- The LLM layer summarizes suspicious events or waste signals.
- The operator uses those outputs to decide what to investigate or optimize next.
This is clearly moving from static monitoring toward guided, AI-assisted operational decision-making.
Where MCP fits
Model Context Protocol (MCP) is an open standard for connecting AI applications to external systems, tools, data sources, and workflows.
In GreenOps, MCP is heavily utilized to decouple the web-scraping and search-engine logic from the core Splunk application, as well as exposing Splunk itself to other AI agents. By using MCP, GreenOps can:
- Seamlessly fetch unstructured data from the web (sustainability news, green IT trends) using the Bright Data MCP server over stdio.
- Expose Splunk's own analytics and event data to local AI agents via a custom Splunk MCP Server, allowing local LLMs and tools to securely query the
greenopsindex without manual API wiring. - Parse AI-ranked search results without hardcoded web scraper logic.
- Continuously poll for updates via a local background worker and push them to Splunk HEC.
Architecture overview
- Telemetry Ingestion: Cloud infrastructure emits telemetry or workload records into the Splunk
greenopsindex. - External Intelligence Ingestion:
fetch_brightdata.pyspawns annpx @brightdata/mcpprocess, calls thediscovertool to fetch sustainability news, and pushes the data to the Splunk HEC. - Analytics: SPL parses raw events into usable analytical fields (region, CPU, cost, waste flags, news links, descriptions).
- Visualization: Dashboard Studio renders KPIs, trends, and detailed tables over those searches in a multi-tab layout.
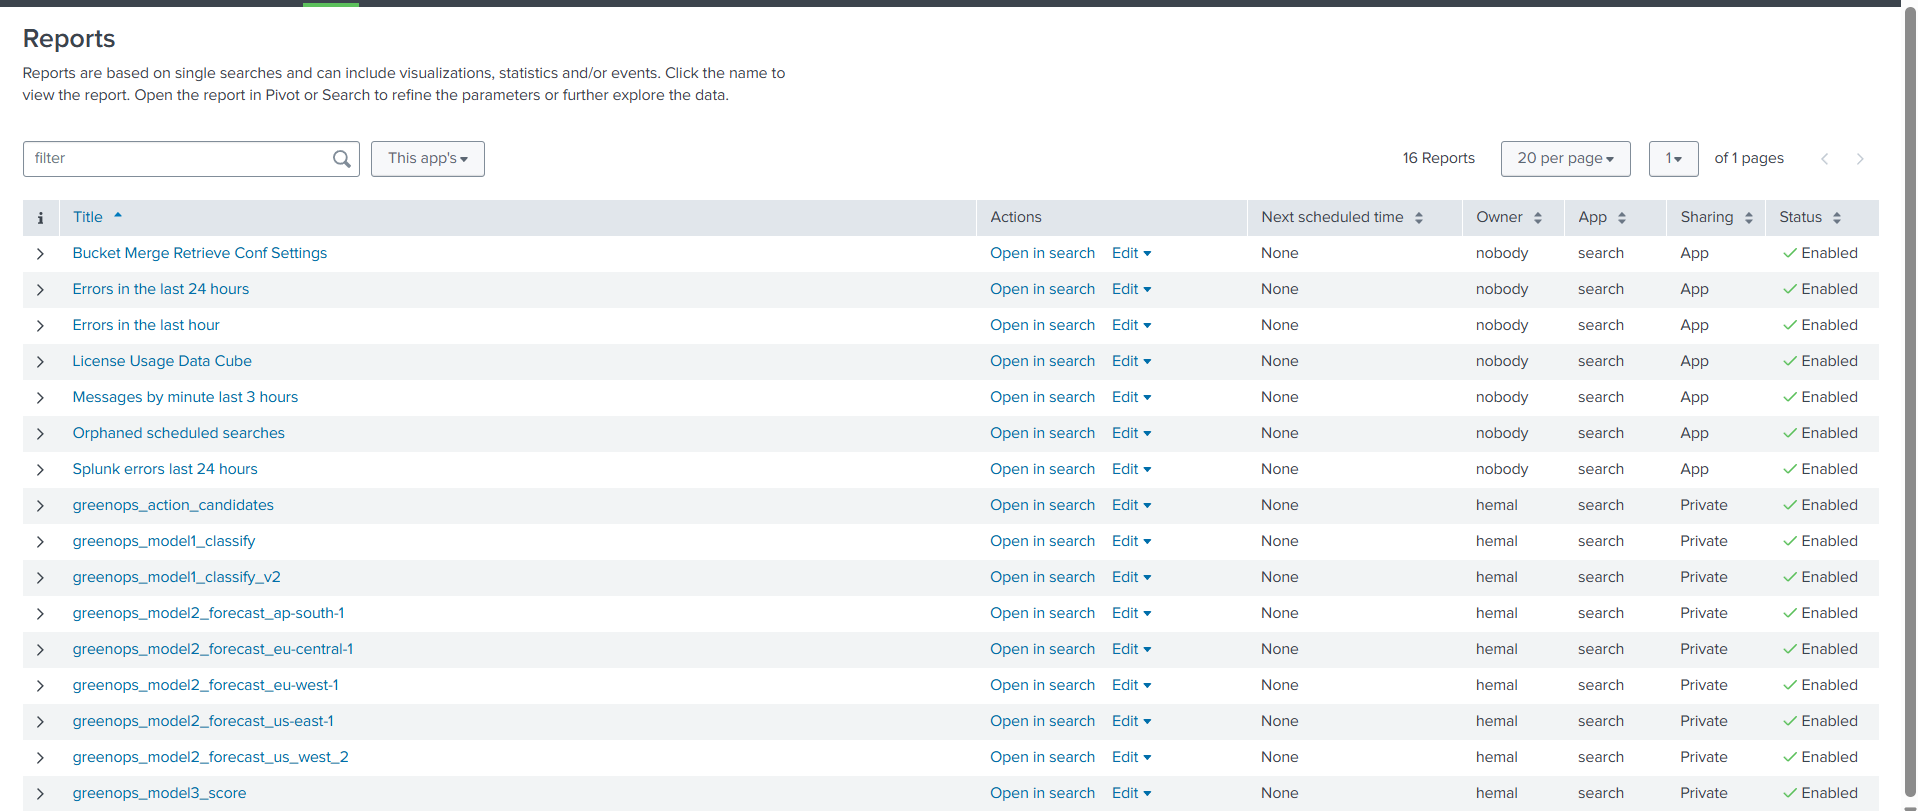
- Generative AI: Splunk AI Assistant helps generate searches, and an LLM script generates natural-language waste summaries.
Setup summary
A basic deployment flow for GreenOps is:
- Ingest cloud workload or infrastructure events into Splunk under the
greenopsindex. - Start the Splunk MCP Server: Run the custom Splunk MCP server locally to expose your Splunk environment to your AI agents via the MCP standard protocol.
- Start the Bright Data Worker: Run
python fetch_brightdata.py(ensure you have your Bright Data API token and Splunk HEC token configured) to begin ingesting the Sustainability Intelligence feed. - Import the GreenOps Dashboard Studio JSON (
7_7.json). - Confirm time-range tokens (
$time.earliest$,$time_sus.earliest$) and dashboard inputs are wired correctly. - Install and configure Splunk AI Assistant for SPL where supported.
- Configure the Groq integration for AI waste summarization.
- Validate that KPI tiles, trend panels, and tables return results over the selected time ranges.
Core message
GreenOps shows how a modern operations experience can evolve from static telemetry monitoring into AI-assisted cloud and sustainability intelligence. By combining Splunk search, Dashboard Studio, AI-assisted SPL generation, LLM-based summarization, and MCP-driven external intelligence, the project helps teams understand not only what is happening in their cloud environments, but also where waste exists, how to optimize it, and how it aligns with global green computing standards.

Log in or sign up for Devpost to join the conversation.