-
-

Landing page
-

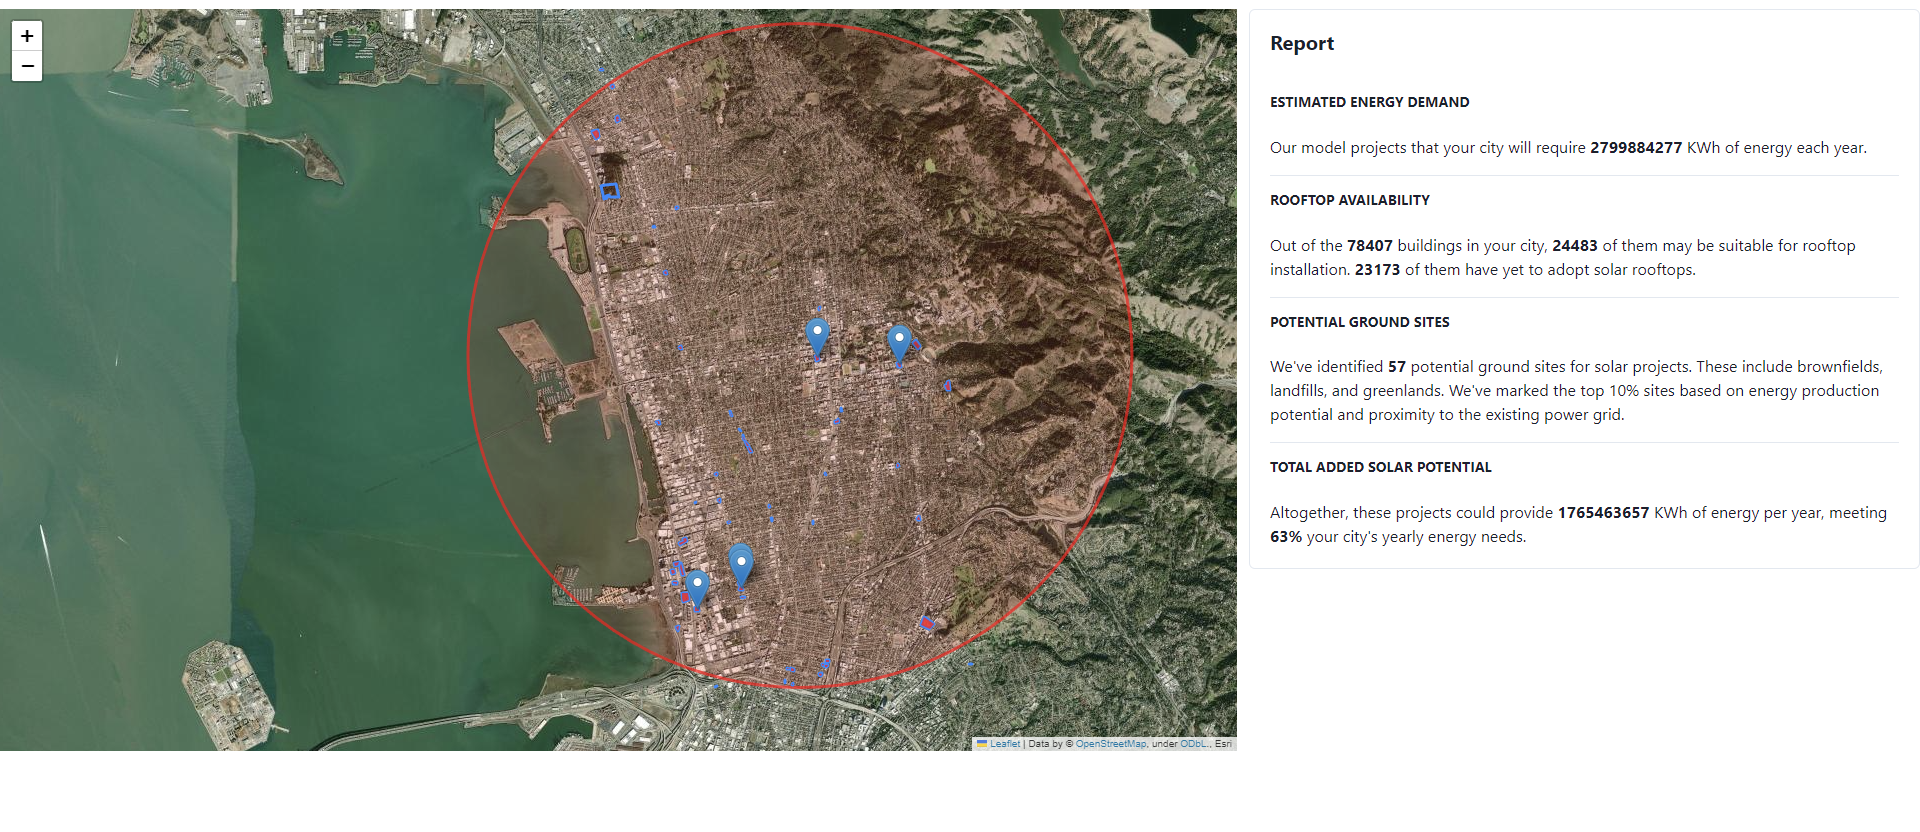
Map and statistics of Berkeley, CA
-

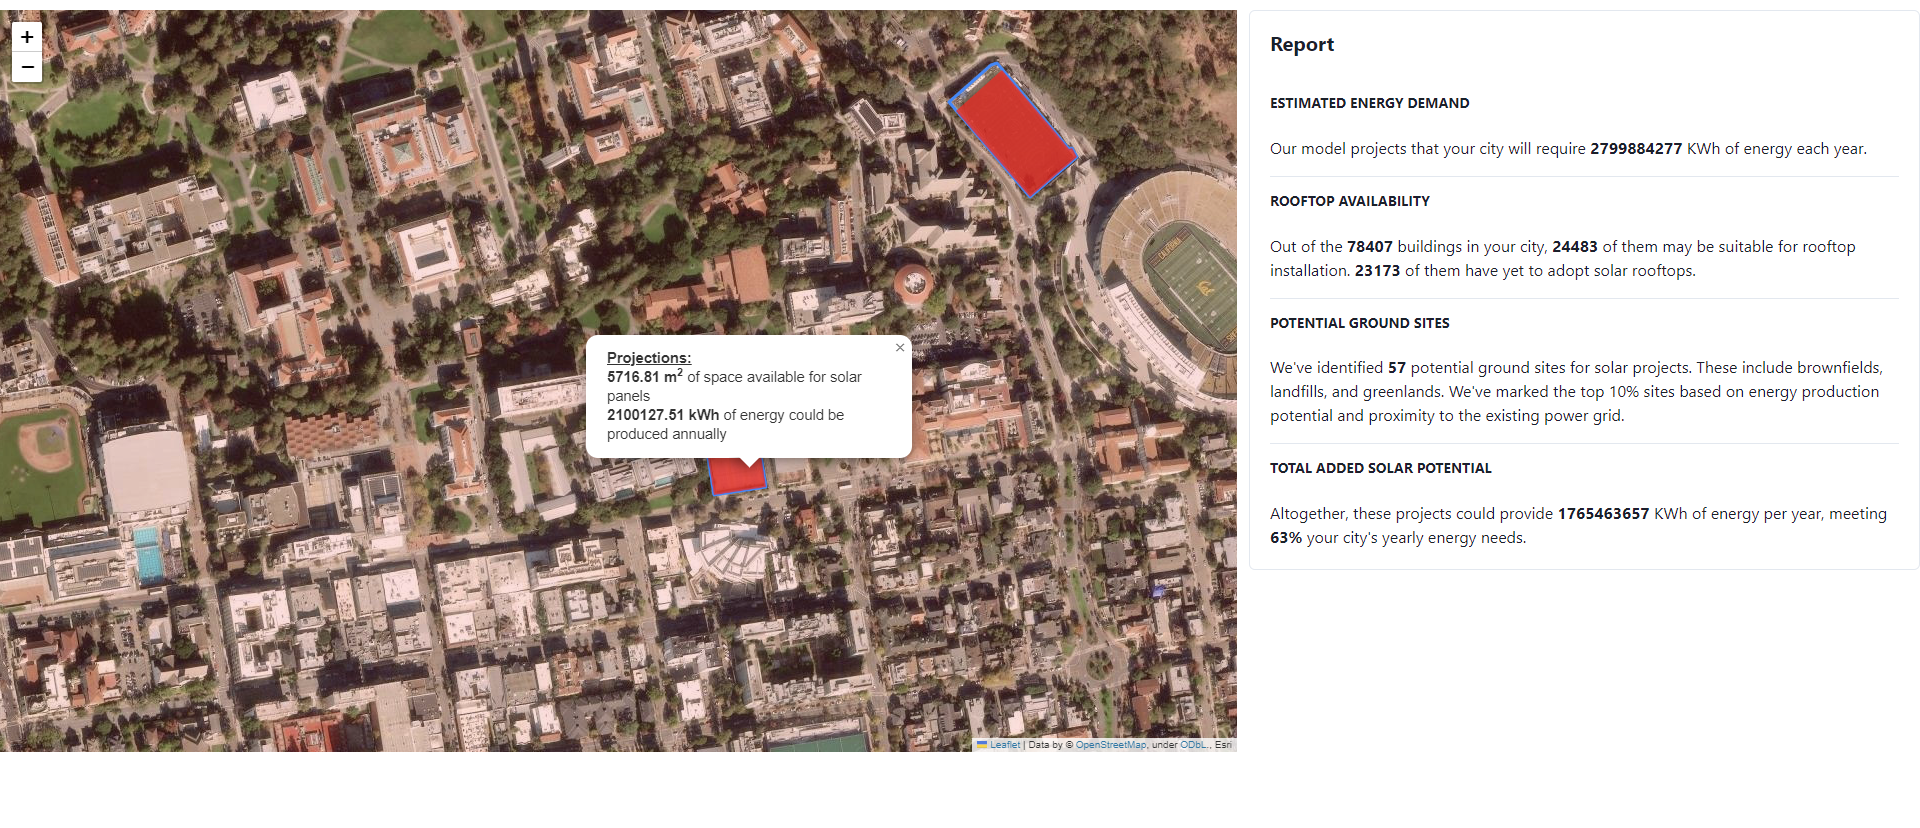
Interactive use of Berkeley map

Inspiration
Despite only covering 3% of the earth's surface, cities are responsible for up to 80% of the world's energy consumption. The importance of swapping to renewable energy is clear, but conducting research to optimize implementation can be daunting. The solution is a simple interface to provide renewable energy installation recommendations:
.88888.           .d88888b           dP                   dP
d8'   `88          88.    "'          88                   88
88        .d8888b. `Y88888b. .d8888b. 88 .d8888b. 88d888b. 88
88   YP88 88'  `88       `8b 88'  `88 88 88'  `88 88'  `88 dP
Y8.   .88 88.  .88 d8'   .8P 88.  .88 88 88.  .88 88
 `88888'  `88888P'  Y88888P  `88888P' dP `88888P8 dP       oo
What it does
GoSolar uses advanced satellite imagery and image classification models to identify the best locations to place solar panels. After identifying potential areas such as landfills, greenfields, brownfields, and parking lots, GoSolar determines which areas are most feasible to integrate into existing power grids through proximity. GoSolar also provides statistics such as estimated energy demand, number of potential roof locations, number of potential ground site locations, and solar potential.
How we built it
We began by testing the core features of GoSolar on Google Colab to develop the basic python code needed to implement our idea in a collaborative workspace. We then moved to develop our web application by creating API endpoints for our backend powered by Flask and designing our frontend with React, HTML, and CSS.
Challenges we ran into
Our algorithm is very computationally complex, so we ran into some issues when trying to increase the efficiency of GoSolar. We've also never deployed a web app on our own, so proper integration between the front-end and back-end was difficult.
Accomplishments that we're proud of
Good and interactive visualization of the map that displays solar site locations and website design.
What we learned
We previously weren't very experienced with geographical python tools, and throughout this hackathon, we learned how to use various libraries like folium, which creates visualization tools for our application; OSMnx, a wrapper to help us access OpenStreetMap data that informs our recommendations; and GeoPandas, which combines the data processing capabilities of pandas with geometric operations. We also worked with a lot of full-stack technology that was new to us, and this experience increased our familiarity in this area.
What's next for GoSolar!
GoSolar is limited by the data sources we use. The majority of infrastructure data is obtained from OpenStreetMap, which is maintained by the open-source community. Unfortunately, this means our data contains gaps for certain communities that are less documented. The future of GoSolar revolves around computer vision, which can help us fill in the gaps by making informed predictions on our existing satellite imagery infrastructure. Due to the lack of data, we were unable to implement a robust model within the timeframe of this hackathon. We can also incorporate a temporal aspect into our algorithm by using a time series model to predict future changes that may affect our calculations.
Built With
- css
- flask
- folium
- heroku
- html
- javascript
- openstreetmap
- python
- react
- sunroof


Log in or sign up for Devpost to join the conversation.