-
-
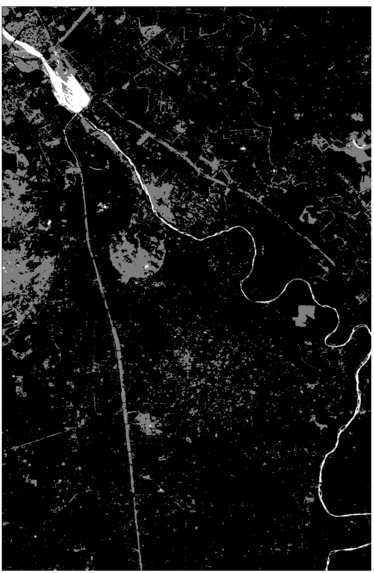
urban.tif
-

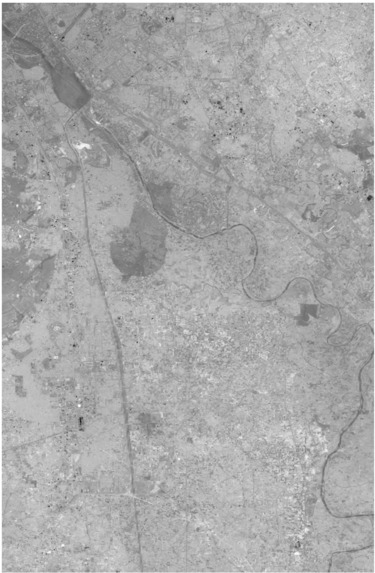
lst.tif
-
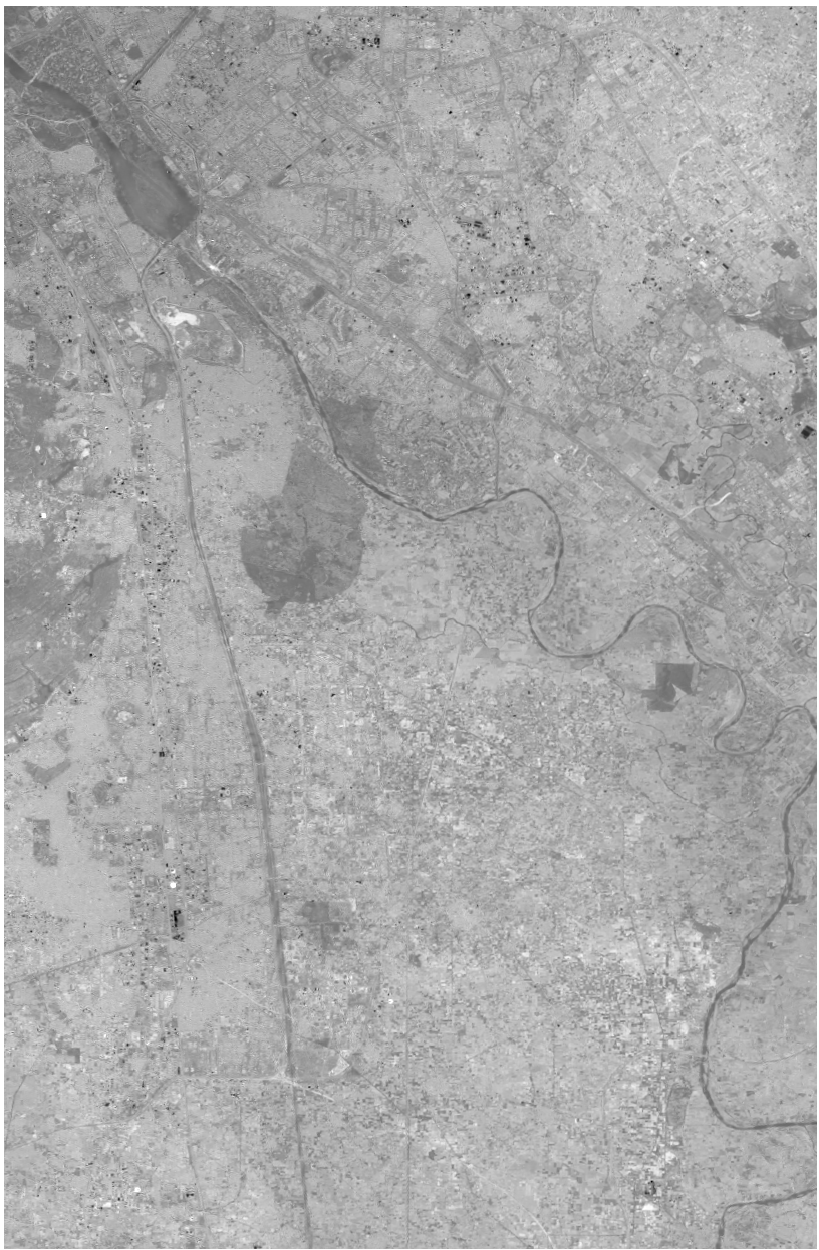
ndvi.tif


Project Story: Urban Heat Island Detection for Bangalore & Delhi
🔍 About the Project
This project was inspired by the growing threat of climate change in urban centers. Cities like Bangalore and Delhi face elevated surface temperatures due to rapid urbanization—a phenomenon known as Urban Heat Island (UHI) effect. Our aim was to harness satellite data and machine learning to detect, predict, and visualize these hotspots in real-time.
🚀 What We Learned
- Leveraged Google Earth Engine to process LST, NDVI, and land use data.
- Gained experience in deploying full-stack geospatial applications using Flask, Leaflet.js, and Chart.js.
- Built a predictive model for UHI using real-world open data.
- Explored cloud deployment pipelines on platforms like Vercel and Heroku.
🛠️ How We Built It
- Data Acquisition: Used Earth Engine scripts to fetch and export satellite layers.
- Backend: Flask API served geospatial data and ML-based predictions.
- Frontend: Leaflet.js rendered dynamic maps, and Chart.js visualized historical data.
- Deployment: Hosted backend on Render and frontend on GitHub Pages for easy accessibility.
🌐 Challenges We Faced
- Dealing with large-scale raster data and optimizing performance.
- Ensuring cross-browser compatibility for the interactive web maps.
- Tuning the ML model to minimize false positives in hotspot detection.
- Harmonizing multiple data sources with varying resolutions and formats.
Built With
- chart.js
- css
- customflaskapi
- flask
- geecodeeditor
- geojson
- git
- googleearthengine
- html5
- javascript
- json
- landsat
- leaflet.js
- python

Log in or sign up for Devpost to join the conversation.