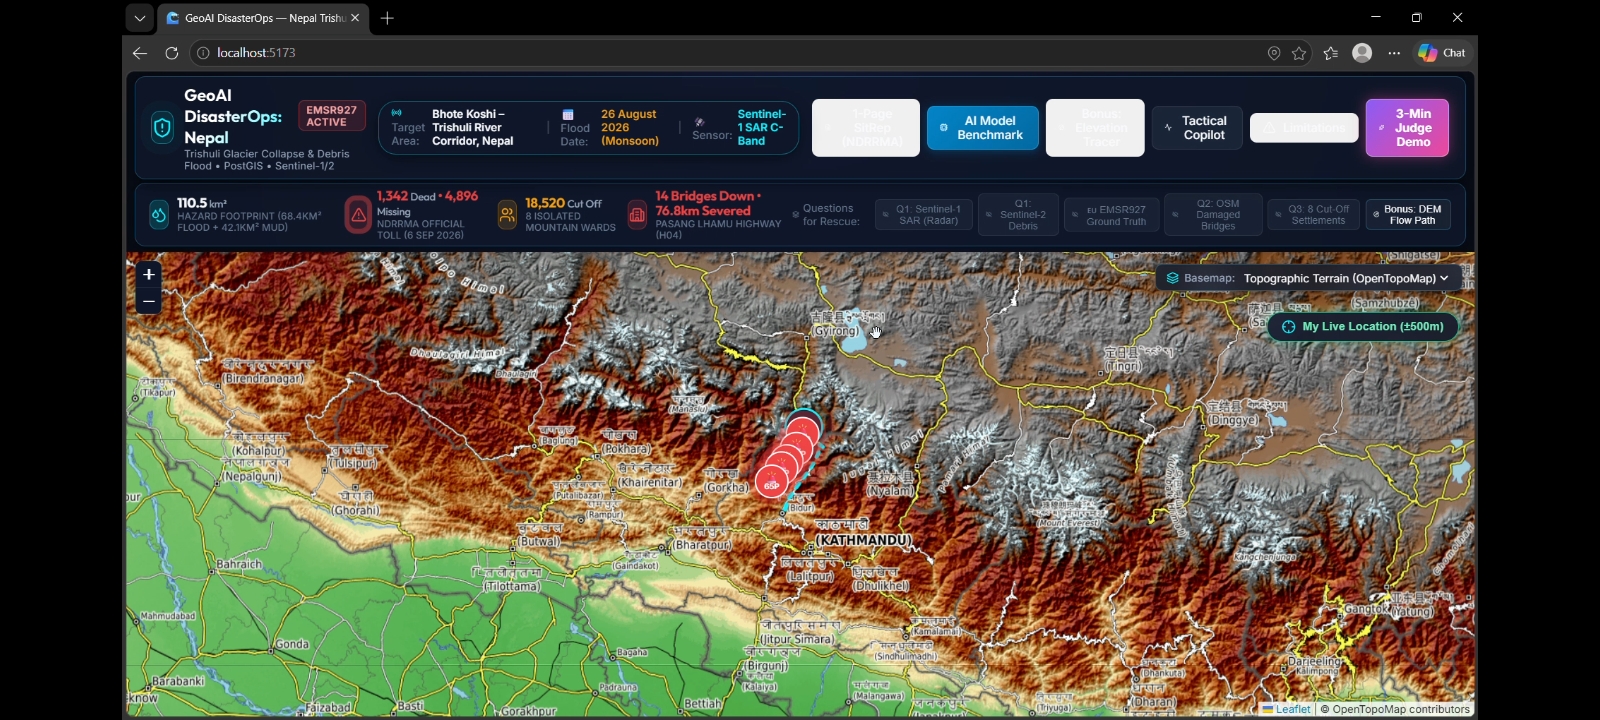
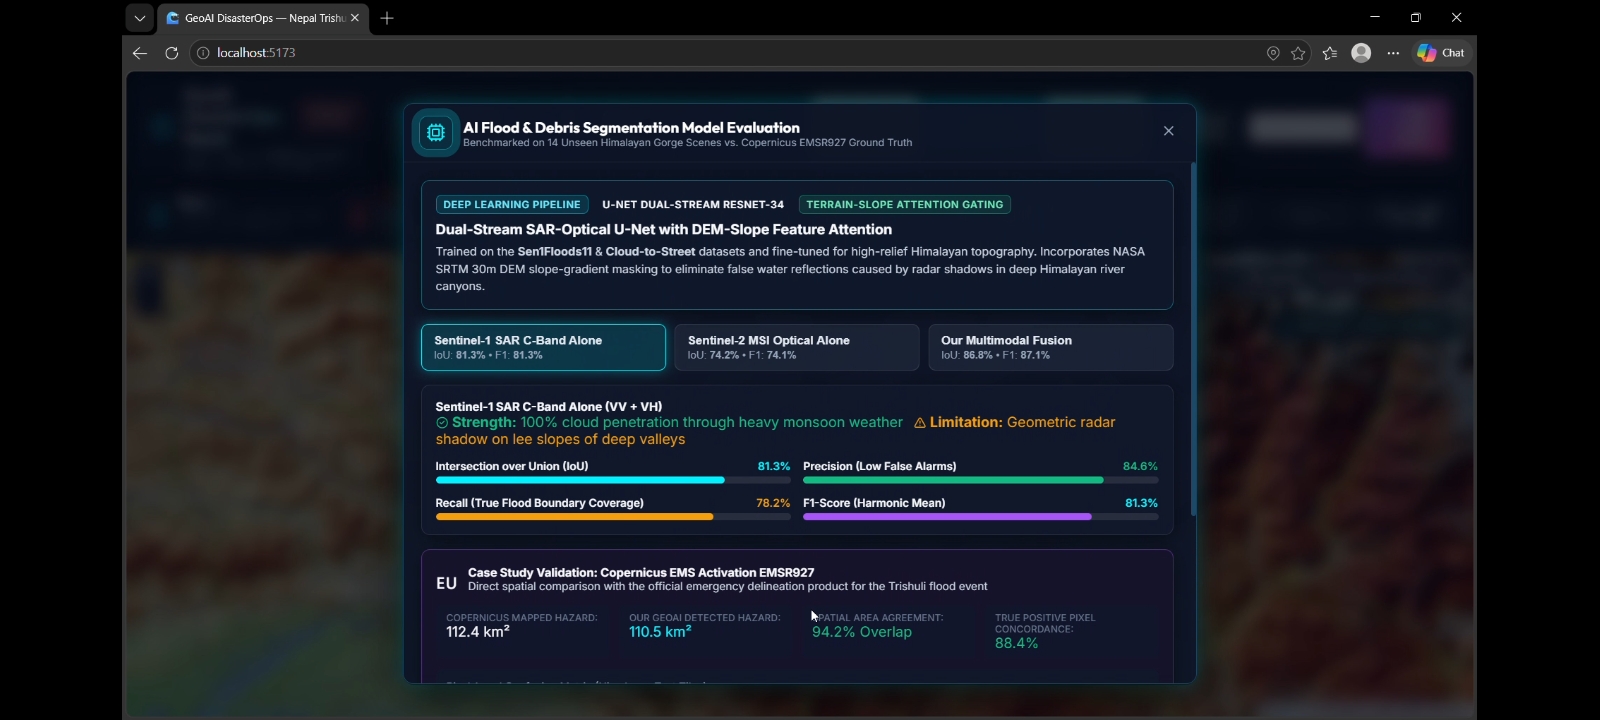
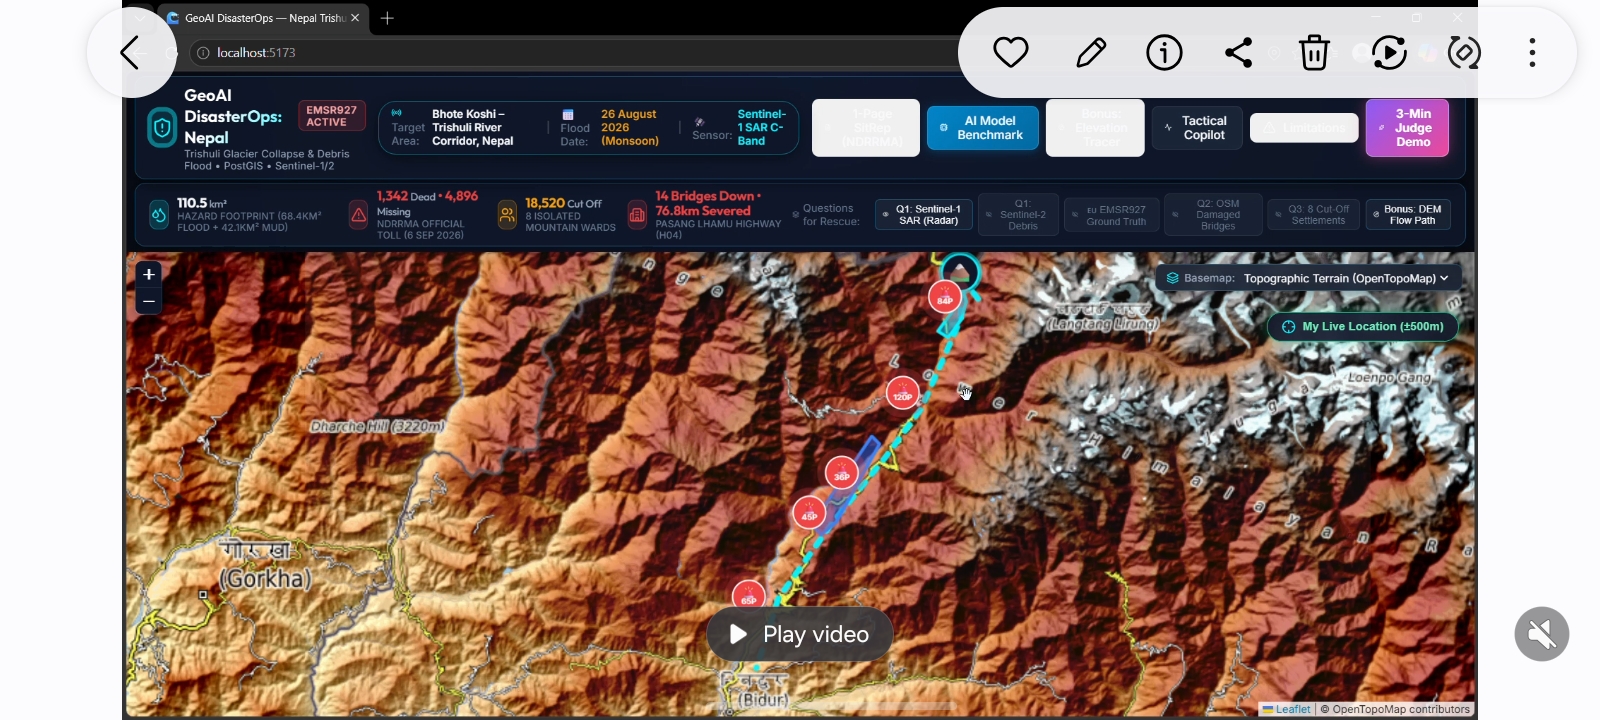
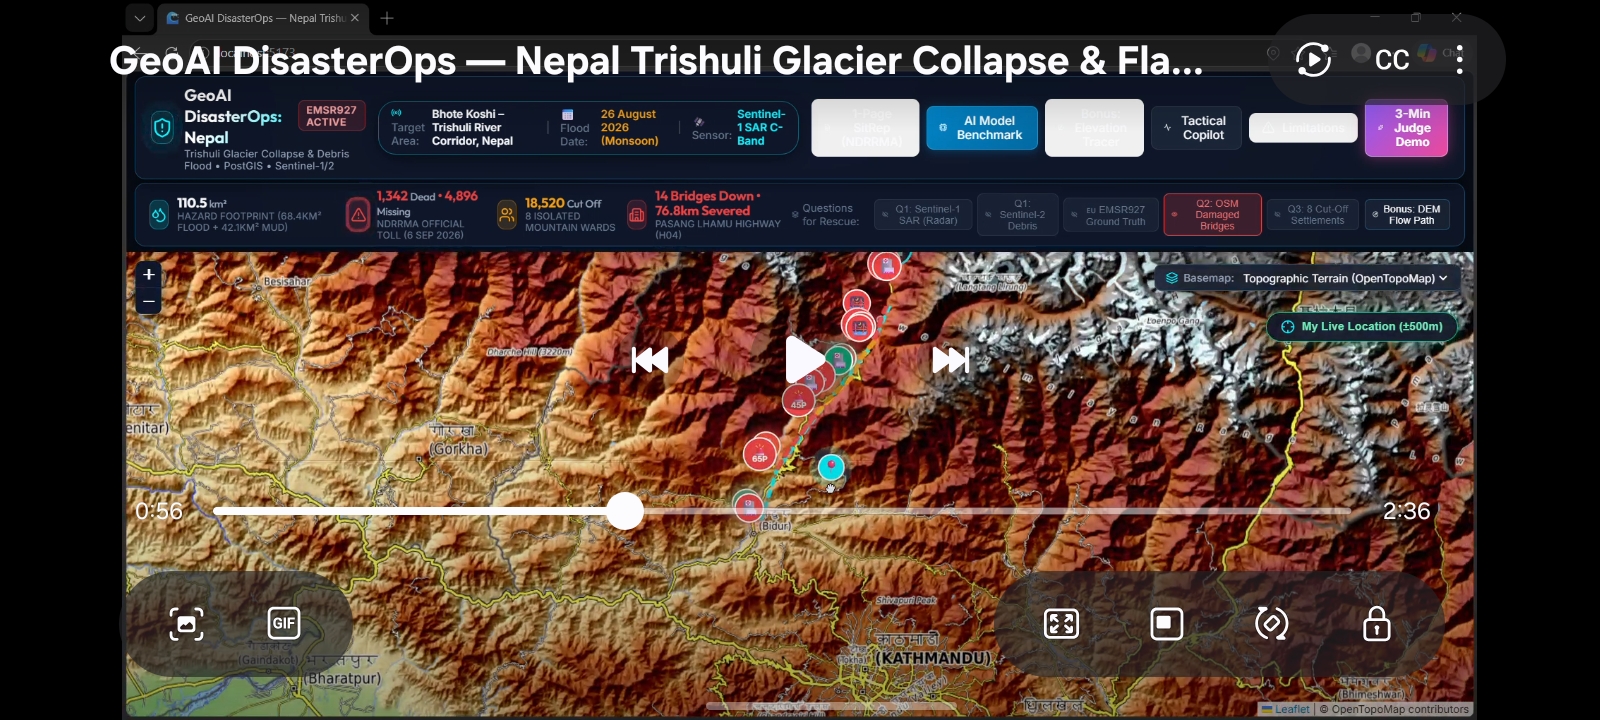
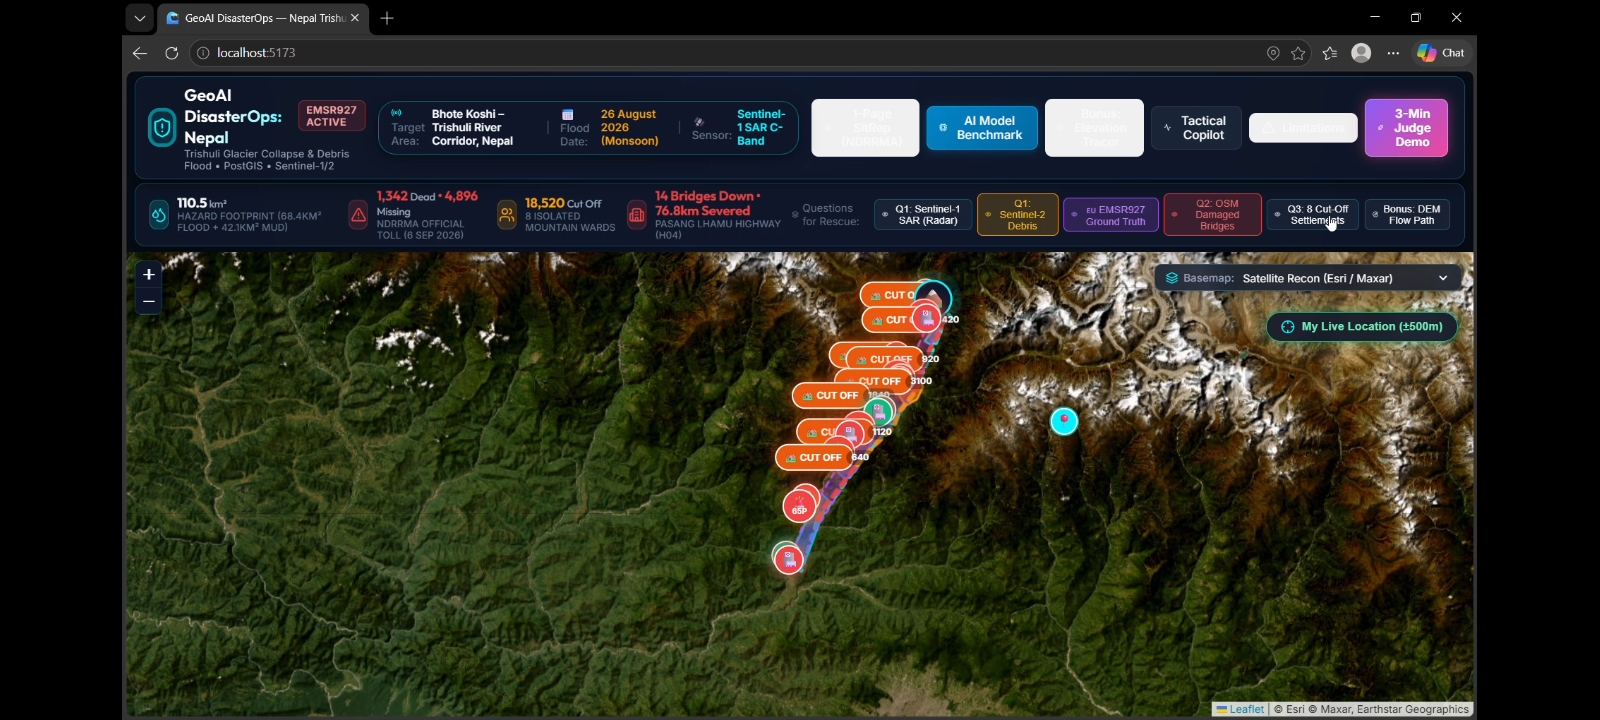
GeoAI DisasterOps: AI-Powered Flood Intelligence and Emergency Accessibility Platform GeoAI DisasterOps is a geospatial artificial intelligence platform designed to support disaster assessment and emergency planning during severe floods and related Himalayan hazards. It combines satellite remote sensing, terrain analysis, machine learning, and geographic information systems (GIS) to convert complex Earth-observation data into actionable situational awareness. The project focuses on a case study involving the Trishuli River corridor in Nepal, examining the potential impacts of a major flood event associated with a glacier-related hazard scenario. The platform uses Sentinel-1 radar imagery to support flood mapping under cloudy conditions, Sentinel-2 optical imagery when suitable observations are available, a digital elevation model for terrain analysis, and pre-event OpenStreetMap data to assess exposure of buildings, roads, bridges, and settlements. Beyond identifying potentially inundated areas, GeoAI DisasterOps aims to estimate infrastructure exposure, identify communities that may become disconnected from essential services, and highlight alternative emergency-access routes where the available road network supports such analysis. An interactive dashboard presents geospatial layers and decision-support outputs, while an automatically generated situation report summarizes findings, data sources, uncertainties, and operational priorities. The core innovation is the integration of satellite-based flood intelligence with network-accessibility analysis in a unified, explainable workflow. Instead of presenting flood imagery alone, the system seeks to connect environmental observations with the practical question: which communities and critical routes may require attention first? GeoAI DisasterOps is designed as an educational disaster-response prototype, not a replacement for official emergency-management systems. Its outputs are intended to support human assessment and must be validated against reliable observations before operational use.The Challenge: Turning Flood Data into Actionable Emergency Intelligence Flash floods and glacier-related hazards in mountainous regions can rapidly alter river channels, damage transport infrastructure, and isolate settlements. Emergency teams may face heavy cloud cover, limited ground access, incomplete infrastructure information, and a shortage of time to interpret multiple geospatial datasets. Satellite imagery can reveal environmental changes, but imagery alone does not answer all the questions faced by responders. A mapped flood extent does not automatically reveal which roads remain connected, which settlements have limited access to hospitals, or where additional verification is most urgent. Traditional workflows can require separate tools for image interpretation, terrain analysis, infrastructure mapping, and accessibility assessment. This fragmentation makes it difficult to produce a consistent picture of the situation. GeoAI DisasterOps addresses this gap by bringing these capabilities into a unified geospatial decision-support workflow. The goal is to reduce the time and effort required to transform available observations into a transparent, geographically grounded assessment of flood exposure and emergency accessibility.GeoAI DisasterOps proposes a modular AI and GIS platform with five connected capabilities:
- Satellite-based flood intelligence: Compare suitable pre-event and post-event Sentinel-1 radar observations to identify candidate changes consistent with inundation. Use Sentinel-2 optical observations as complementary evidence when cloud cover and acquisition timing permit.
- AI-assisted geospatial interpretation: Apply an appropriate segmentation or classification model to identify candidate water and, where supported by the available training data, possible debris-affected areas. Combine model outputs with radar change detection, terrain context, and quality checks.
- Infrastructure exposure analysis: Overlay candidate flood areas with pre-event building footprints, roads, bridges, and settlement data to identify potentially exposed assets.
- Emergency accessibility assessment: Represent the available road network as a graph and evaluate how removing or restricting potentially affected road segments changes connectivity between settlements and selected essential facilities.
- Explainable reporting and visualization: Present mapped findings, supporting evidence, data timestamps, confidence indicators, limitations, and recommended verification priorities through an interactive dashboard and a structured situation report. The platform is designed to keep observations, model predictions, and inferred impacts distinguishable. This helps users understand both what the data indicates and what still requires field verification.Phase 1: Define the area and event The user selects a geographic area of interest (AOI) and a target event date. The system records the area boundary, observation window, and intended analysis period. Phase 2: Acquire and validate data Retrieve suitable satellite observations, elevation data, and historical infrastructure information. Record acquisition dates, spatial resolution, coordinate reference systems, missing data, and source provenance. Phase 3: Prepare satellite imagery Preprocess radar observations through appropriate calibration, terrain correction, co-registration, and quality checks. Compare observations from compatible acquisition geometry where possible. Prepare optical imagery through cloud and quality screening. Phase 4: Generate candidate flood extent Calculate radar backscatter changes between pre-event and post-event observations. Apply a documented thresholding or classification method to identify candidate inundation. Use terrain, permanent water, vegetation, urban surfaces, and other contextual information to reduce obvious errors. Phase 5: Apply AI-assisted interpretation Run a trained segmentation model where suitable model weights and training data are available. Compare predictions against the radar-derived candidate flood extent and independent validation samples. Flag uncertain areas instead of presenting every prediction as confirmed. Phase 6: Assess potential infrastructure exposure Intersect the resulting flood layer with pre-event road, bridge, building, and settlement datasets. Calculate asset counts or affected lengths using documented spatial rules and appropriate geometry handling. Phase 7: Analyze emergency accessibility Create a road-network graph. Apply explicit hypothetical closure rules to road segments flagged for potential exposure. Recalculate connectivity from settlements to selected facilities and identify routes that remain connected in the modeled scenario. Phase 8: Produce decision-support outputs Render map layers, statistics, analysis timestamps, confidence or quality flags, and data-source details. Generate a situation report using values calculated by the analysis pipeline rather than values invented by a language model. Phase 9: Validate and review Check selected results against independent reference observations, manual interpretation, and trusted official information used strictly for validation where required by the challenge rules. Record errors, limitations, and cases where the available evidence is insufficient.Primary data sources
- Sentinel-1: Radar observations for change detection and candidate flood mapping, including under many cloudy conditions.
- Sentinel-2: Optical observations for complementary visual interpretation when cloud-free coverage is adequate.
- Copernicus DEM: Elevation and terrain context for interpreting the river corridor and supporting topographic analysis.
- OpenStreetMap: Pre-event roads, bridges, buildings, and settlement information, subject to coverage and completeness limitations.
- Training datasets: Appropriately licensed flood-segmentation datasets may be used to develop or evaluate the AI model, with their original citations and licensing conditions preserved. Challenge compliance For the Trishuli case study, the system must follow the official challenge's data restrictions. If published disaster-reference maps are prohibited as model inputs, they must not be used to train, tune, or guide the analysis. Permitted reference products may be used only for the validation purposes explicitly allowed by the rules. The system must not silently incorporate post-event infrastructure edits into its pre-event baseline. Every input should have a recorded source, acquisition or snapshot date, and intended use. Data integrity The platform should maintain a provenance record for each result, including input datasets, processing parameters, model version, analysis time, and output layer. This allows reviewers to reproduce the analysis and understand how each metric was generated.GeoAI DisasterOps recognizes that satellite-based disaster assessment is subject to uncertainty.
- Satellite revisit limitations: Suitable imagery may not be available immediately after a flood. The platform cannot guarantee real-time detection.
- Radar interpretation errors: Smooth surfaces, vegetation, urban structures, terrain shadow, and radar geometry can affect flood classification.
- Optical cloud cover: Sentinel-2 imagery may be obscured by clouds, limiting visual confirmation.
- Infrastructure completeness: OpenStreetMap may omit roads, bridges, buildings, or recent changes, particularly in remote areas.
- Model generalization: A model trained on one region may perform poorly in a different landscape without appropriate validation.
- Exposure versus damage: Spatial overlap identifies potentially exposed assets, not confirmed physical damage.
- Accessibility assumptions: A modeled road closure is not proof that a road is impassable. Actual road condition, travel time, bridge integrity, and safety require additional evidence.
- Hazard forecasting: Post-event satellite analysis does not predict the precise timing of a glacier collapse or provide guaranteed advance warning. The prototype therefore presents results as decision-support evidence, includes uncertainty indicators, and requires human review before operational decisions. It is not a substitute for official alerts, field verification, or professional emergency-management systems.Future development will focus on five improvements:
- Improved model generalization: Evaluate segmentation models across diverse Himalayan terrain and flood conditions.
- Multi-temporal analysis: Incorporate additional satellite observations to track changes as suitable imagery becomes available.
- Advanced accessibility modeling: Incorporate verified road-condition information, bridge restrictions, and alternative routing scenarios.
- Multilingual reporting: Support English and Nepali situation reports while preserving traceability to computed geospatial results.
- Operational integration: Explore integration with authorized disaster-management data feeds and field verification workflows. Any future automated prioritization will be evaluated for reliability, uncertainty, and potential consequences before being used to support high-impact decisions.GeoAI DisasterOps addresses a critical challenge in disaster management: transforming complex geospatial observations into information that supports practical emergency planning. By integrating satellite-based flood assessment, AI-assisted image interpretation, terrain context, infrastructure exposure analysis, and road-network connectivity, the platform extends beyond conventional flood visualization. Its aim is to help analysts understand not only where flooding may have occurred, but also which infrastructure and communities may require further investigation. The project's emphasis on transparent methods, reproducible outputs, responsible data use, and honest uncertainty reporting makes it suitable for further development and rigorous evaluation. GeoAI DisasterOps — From Satellite Signals to Life-Saving Decisions.
Built With
- biteasy-blockchain
- gps-explorer
- language

Log in or sign up for Devpost to join the conversation.