-
-
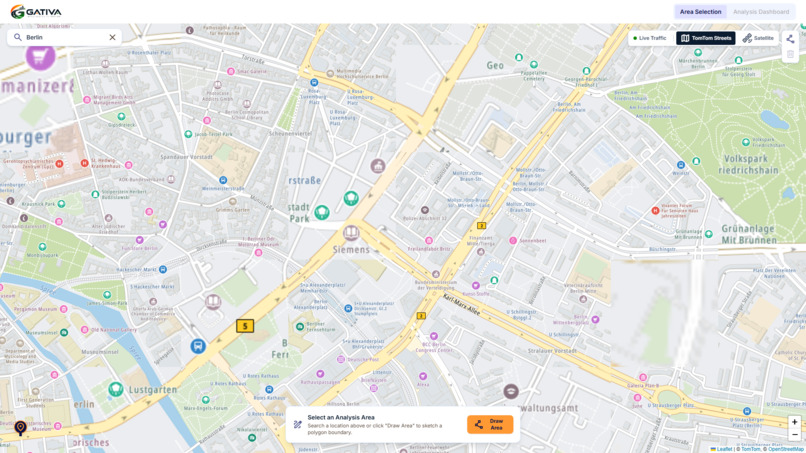
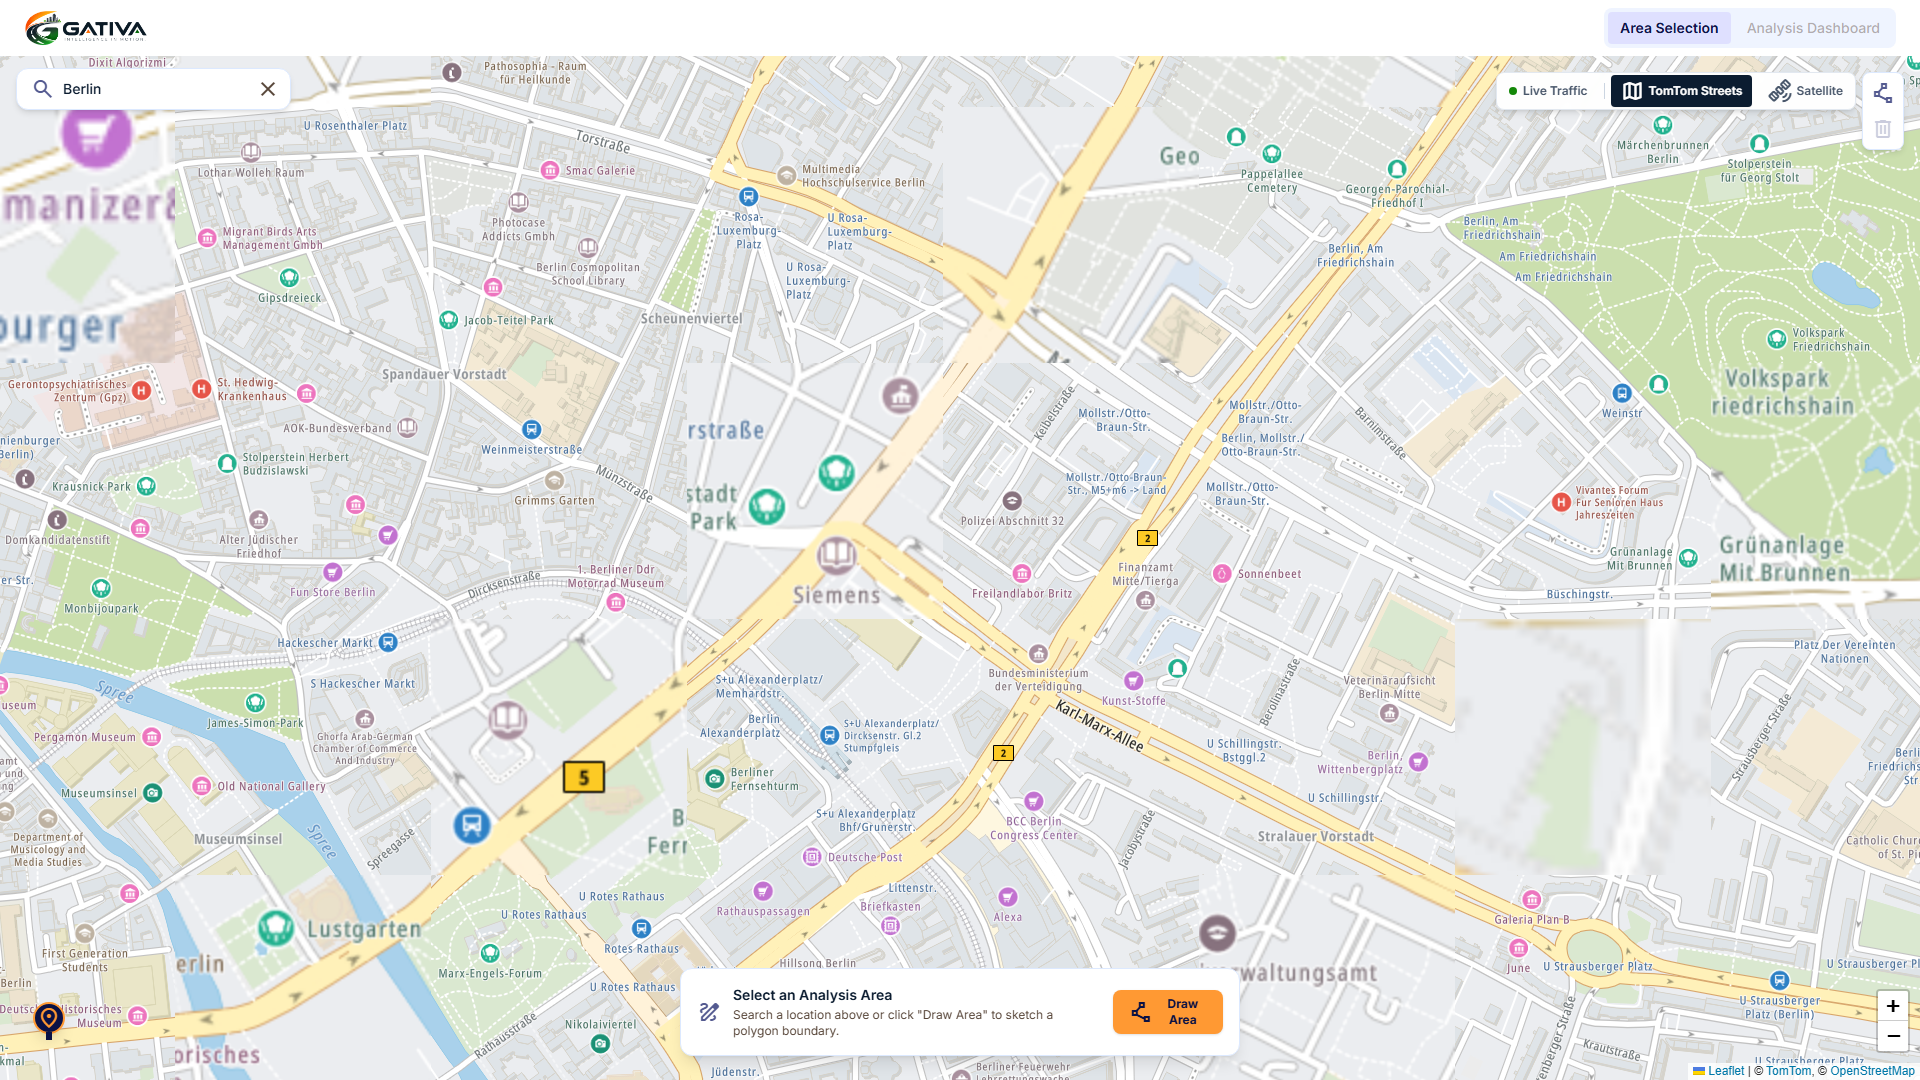
The Map
-
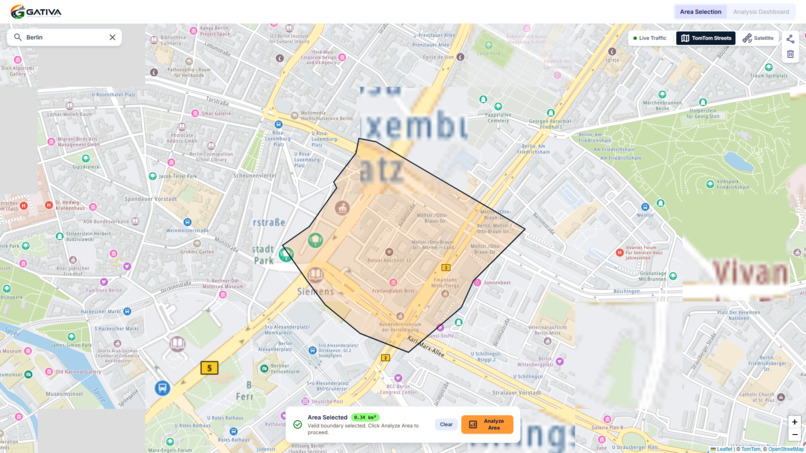
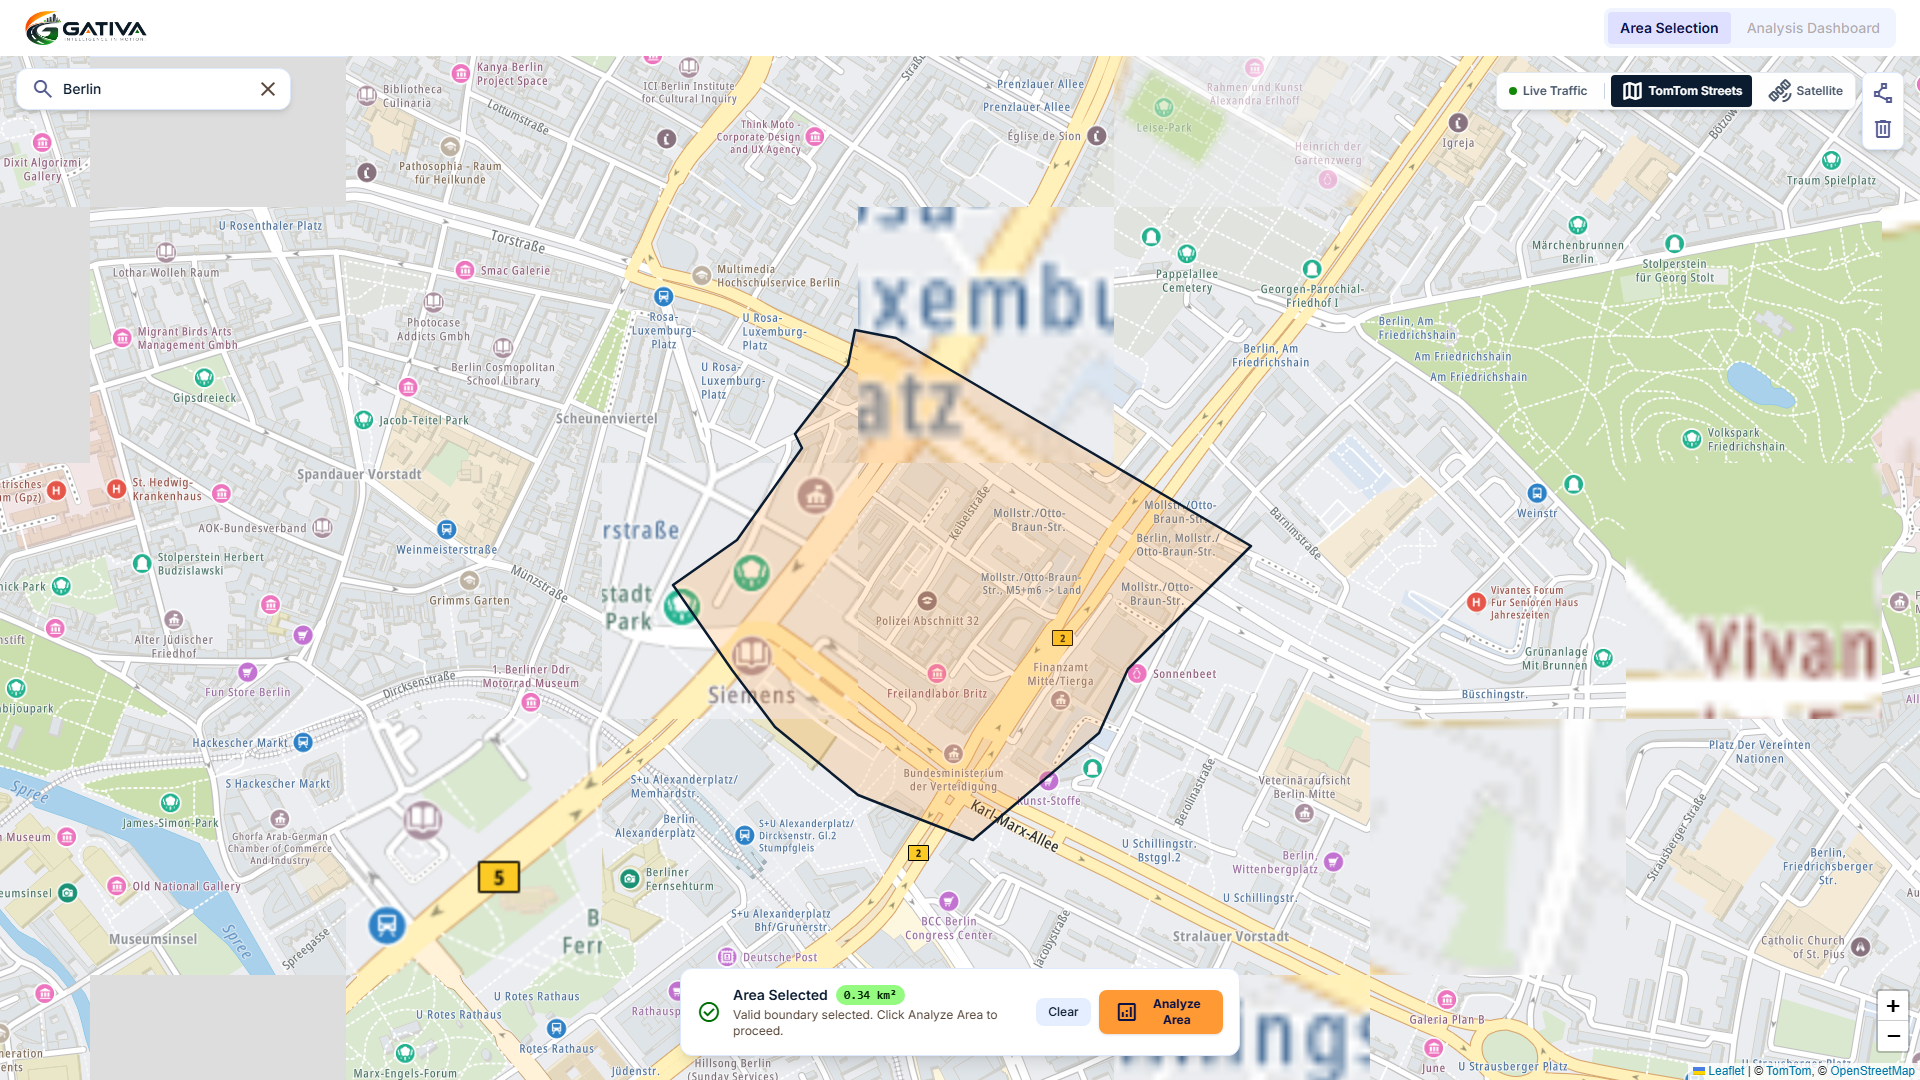
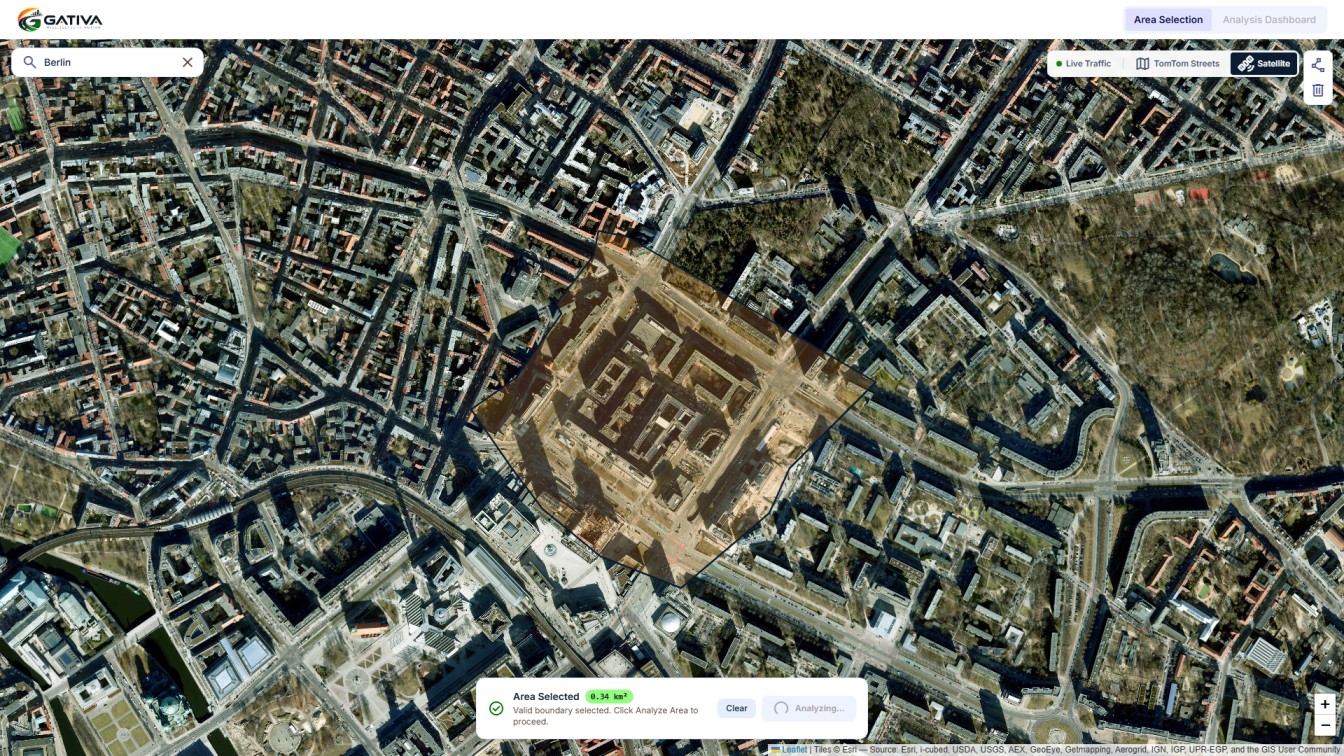
Selecting an area for analysis
-
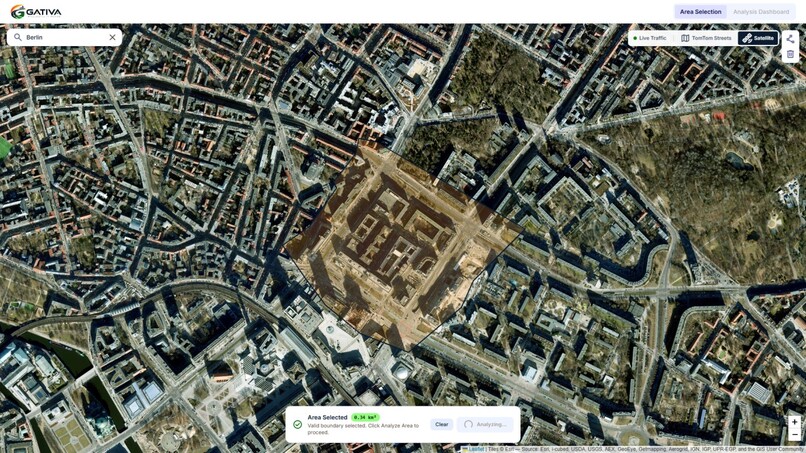
Satellite view
-
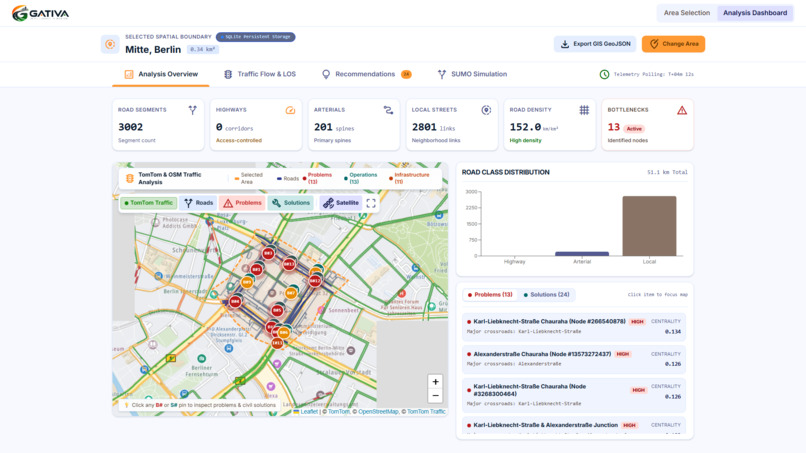
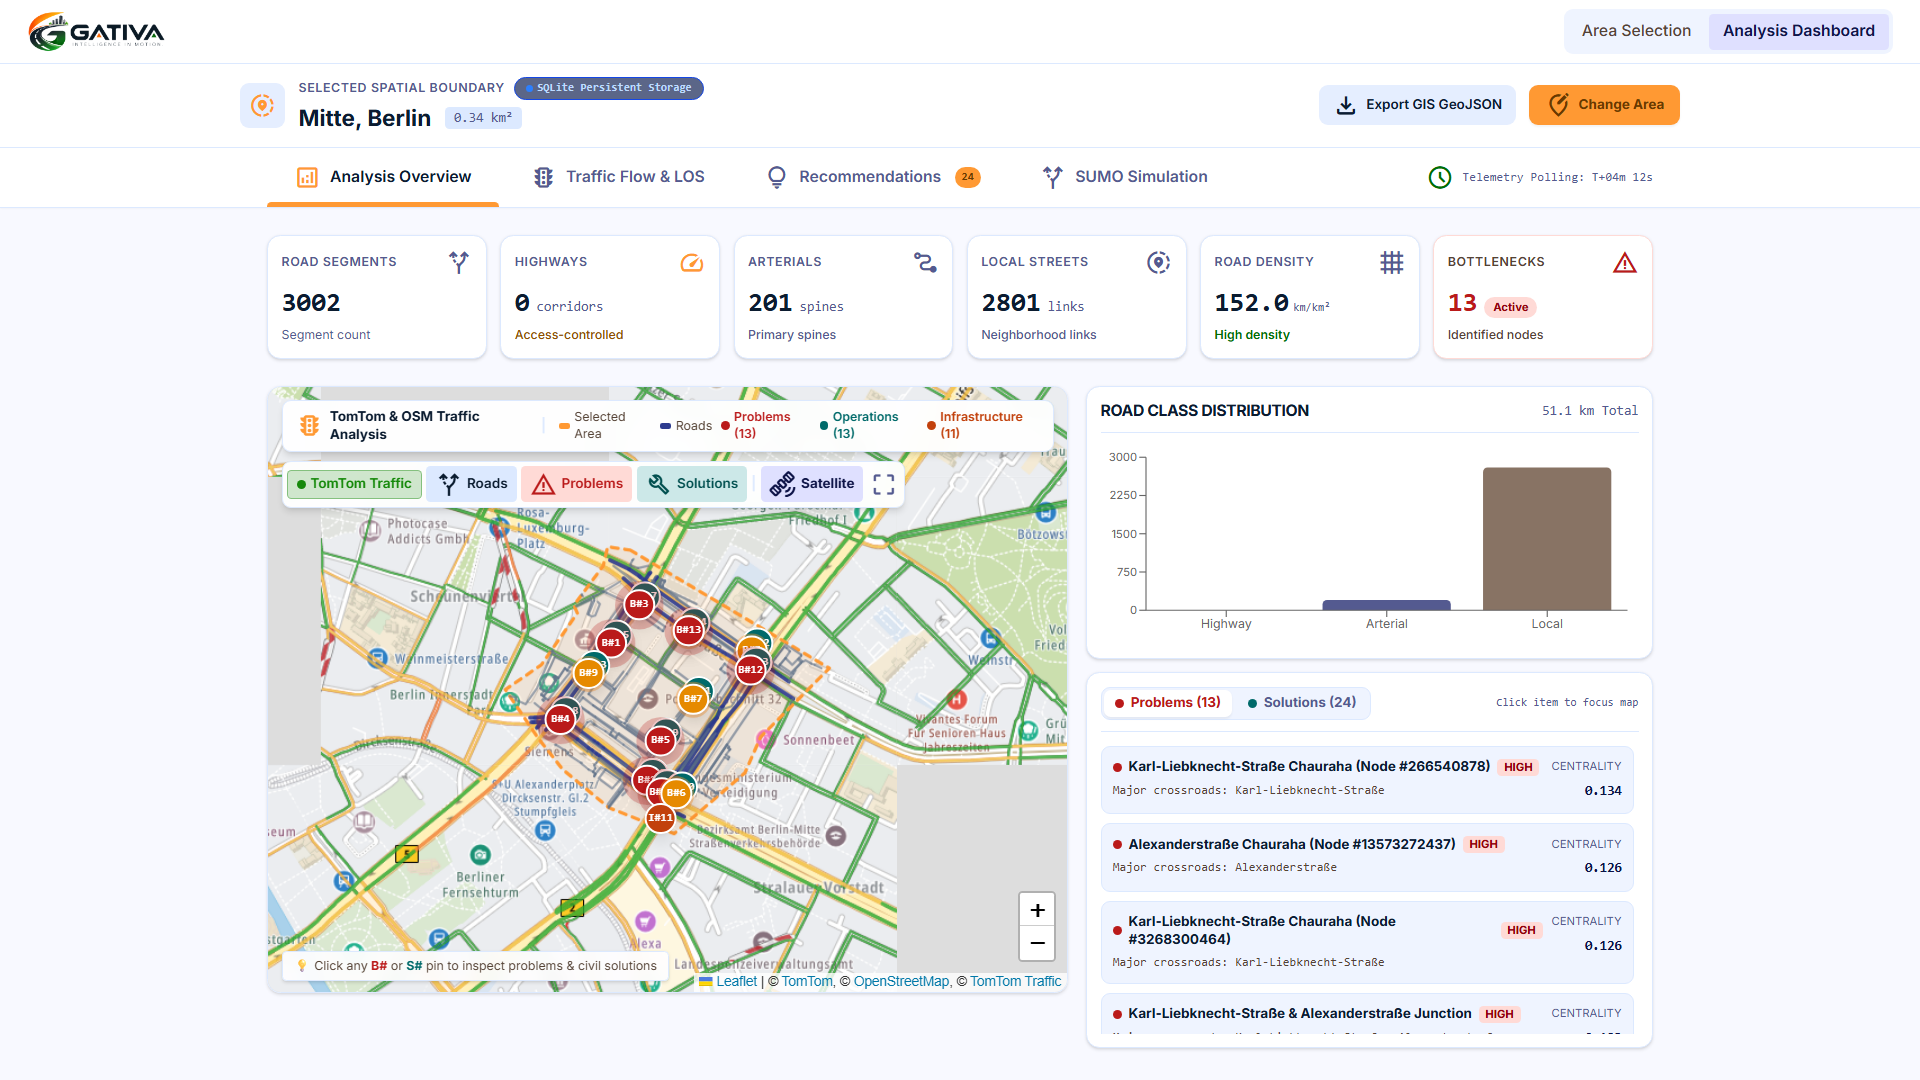
Analysis Dashboard Overview
-
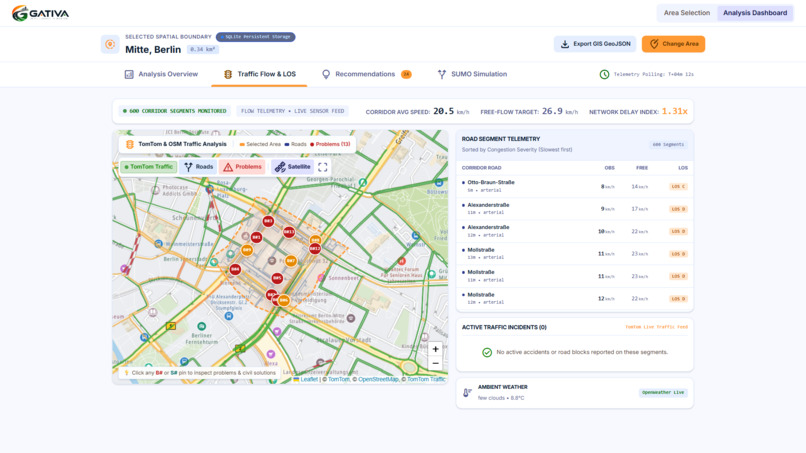
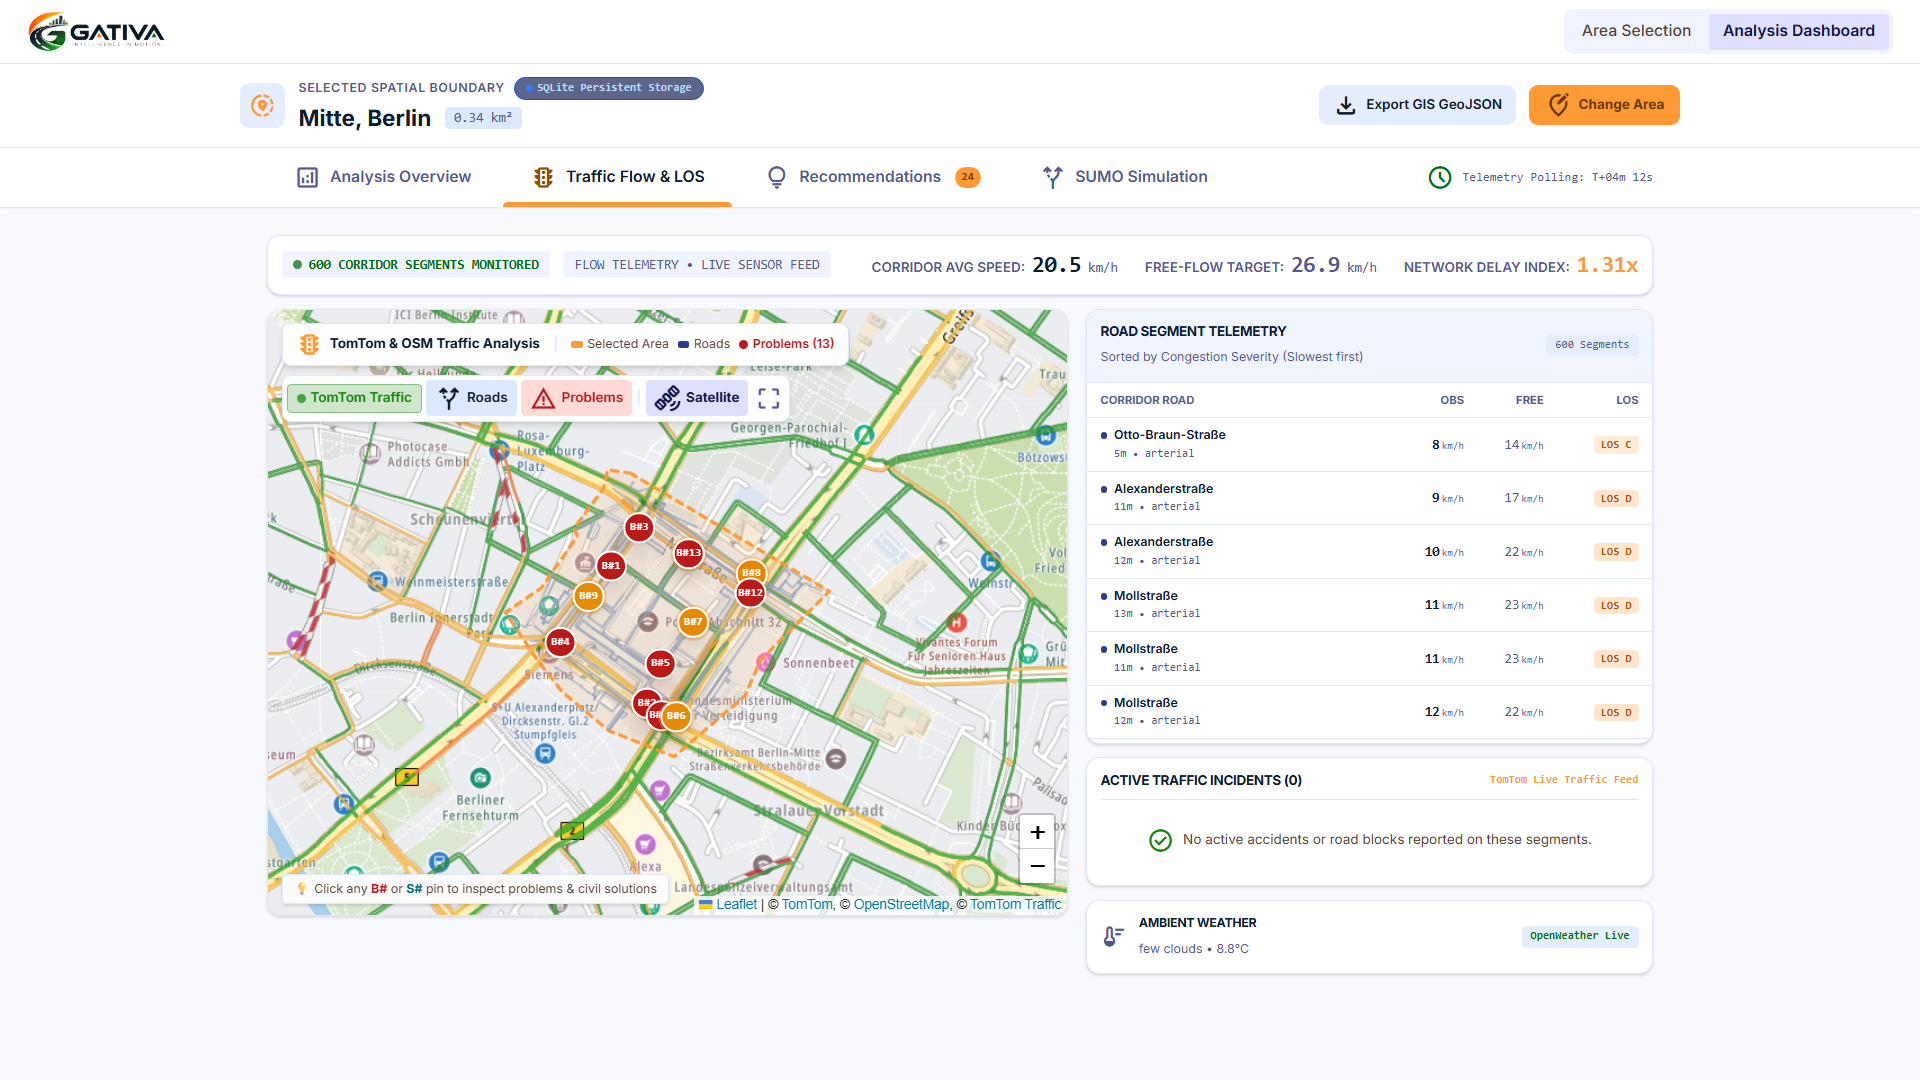
Traffic Flow in the Area
-
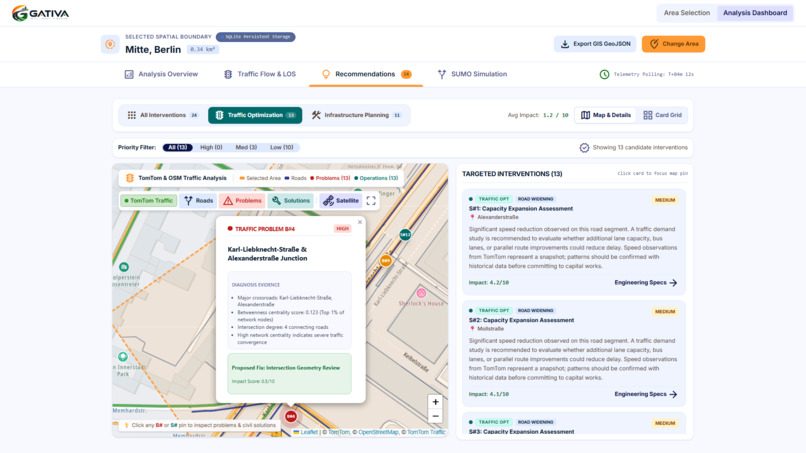
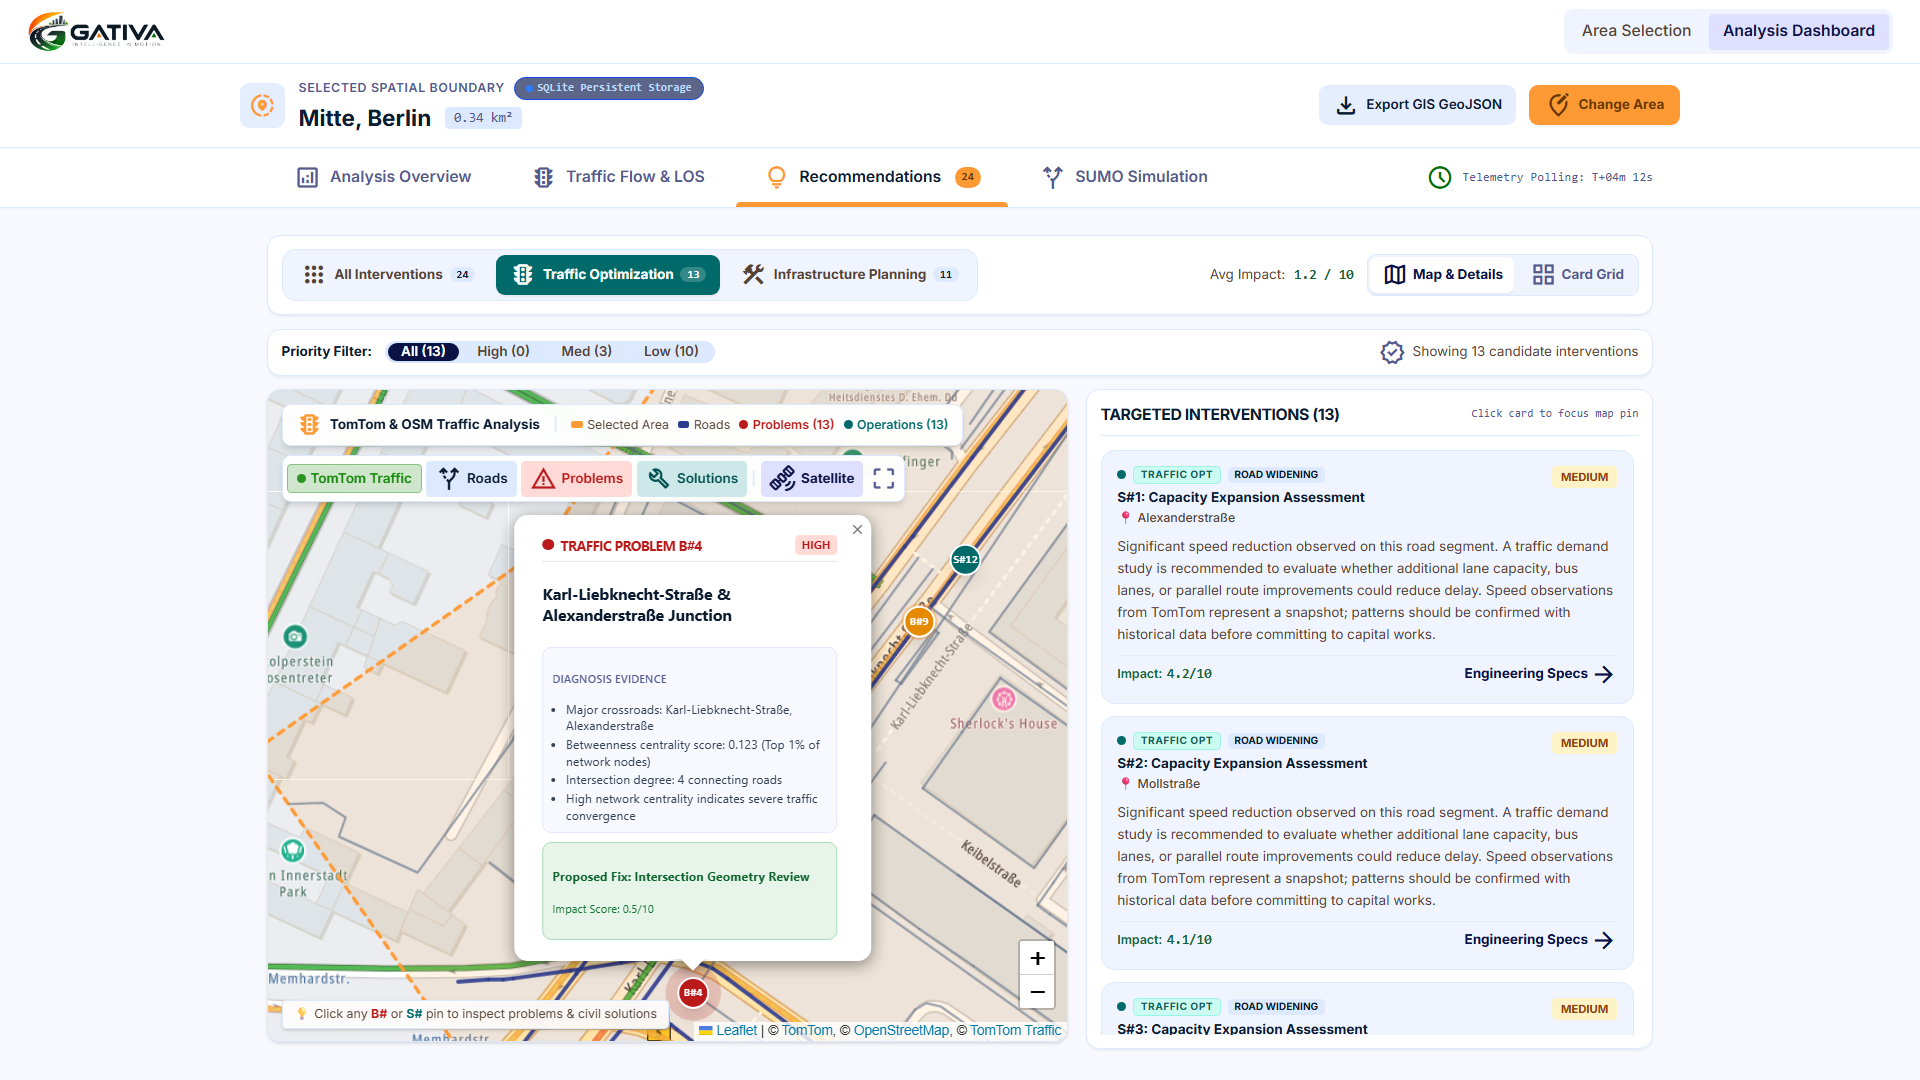
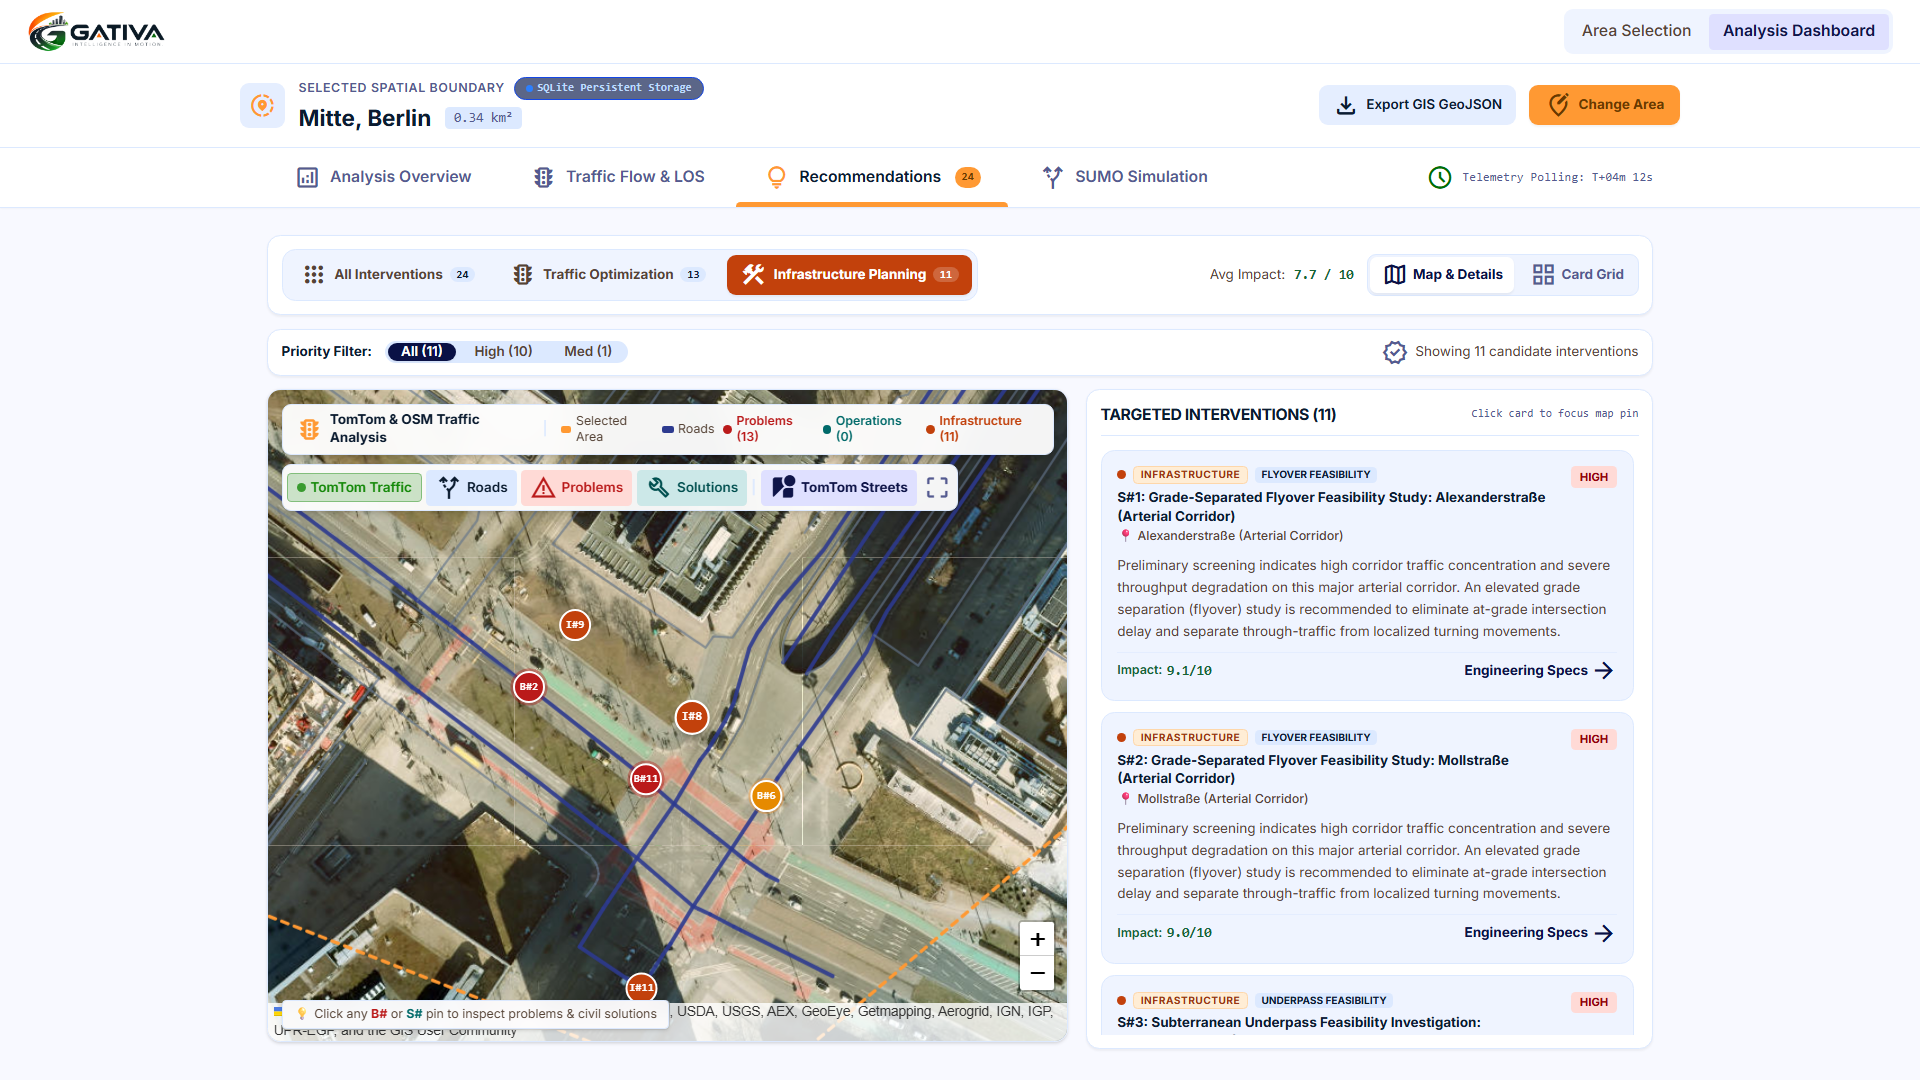
Recommendation page
-
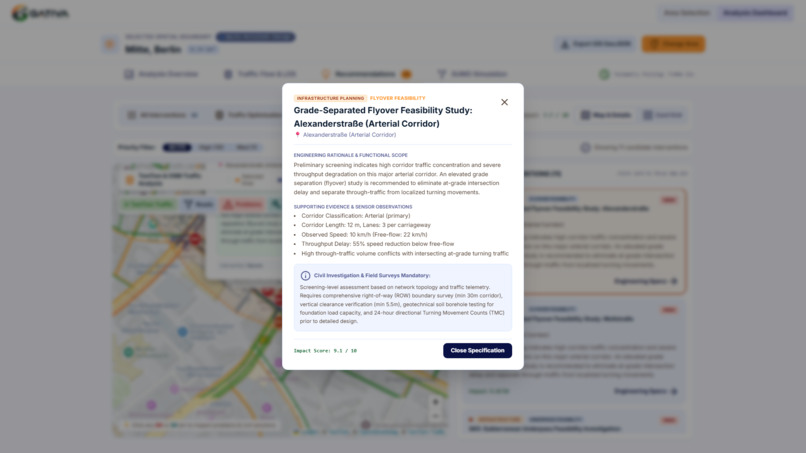
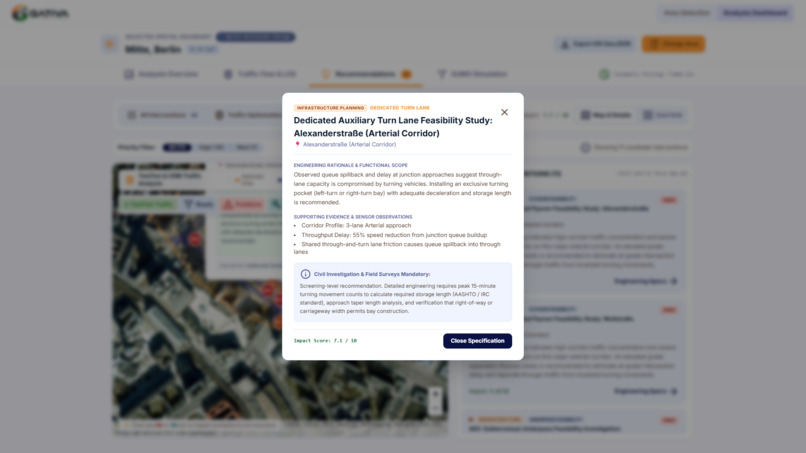
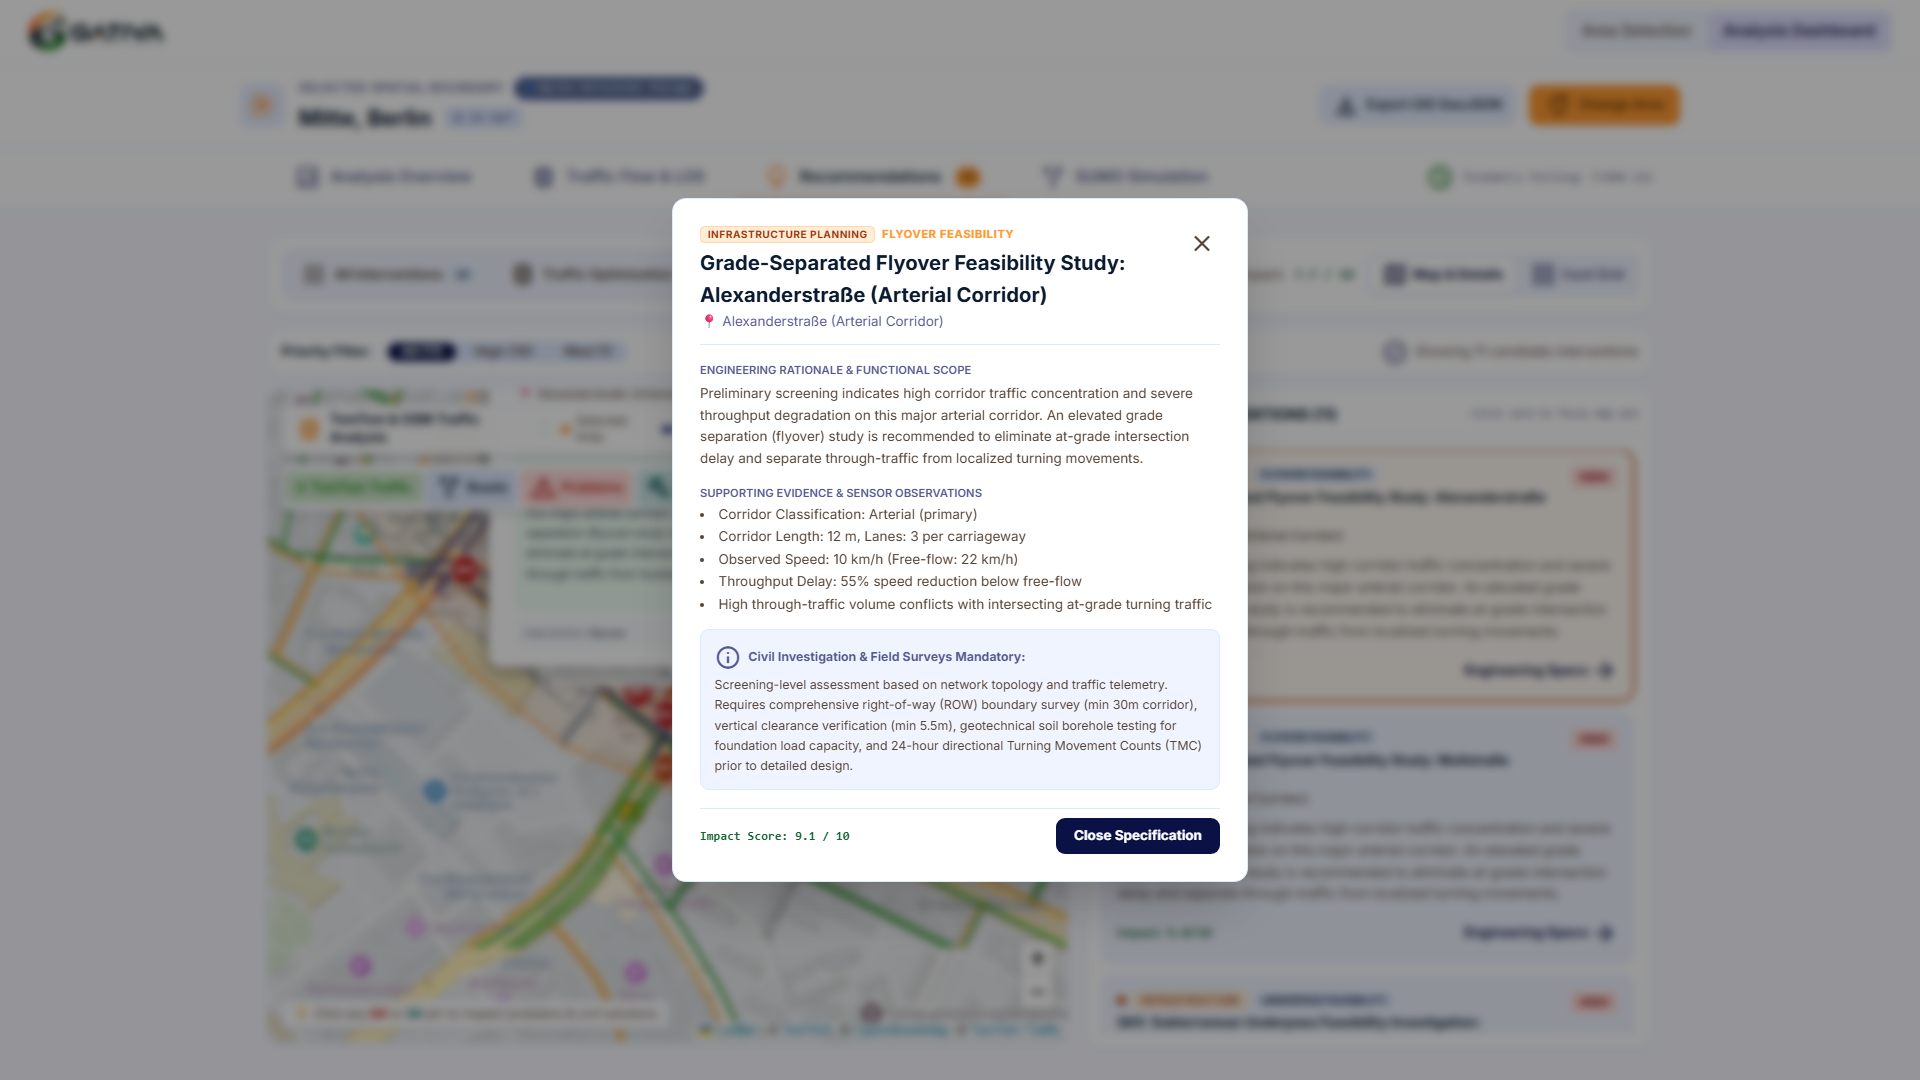
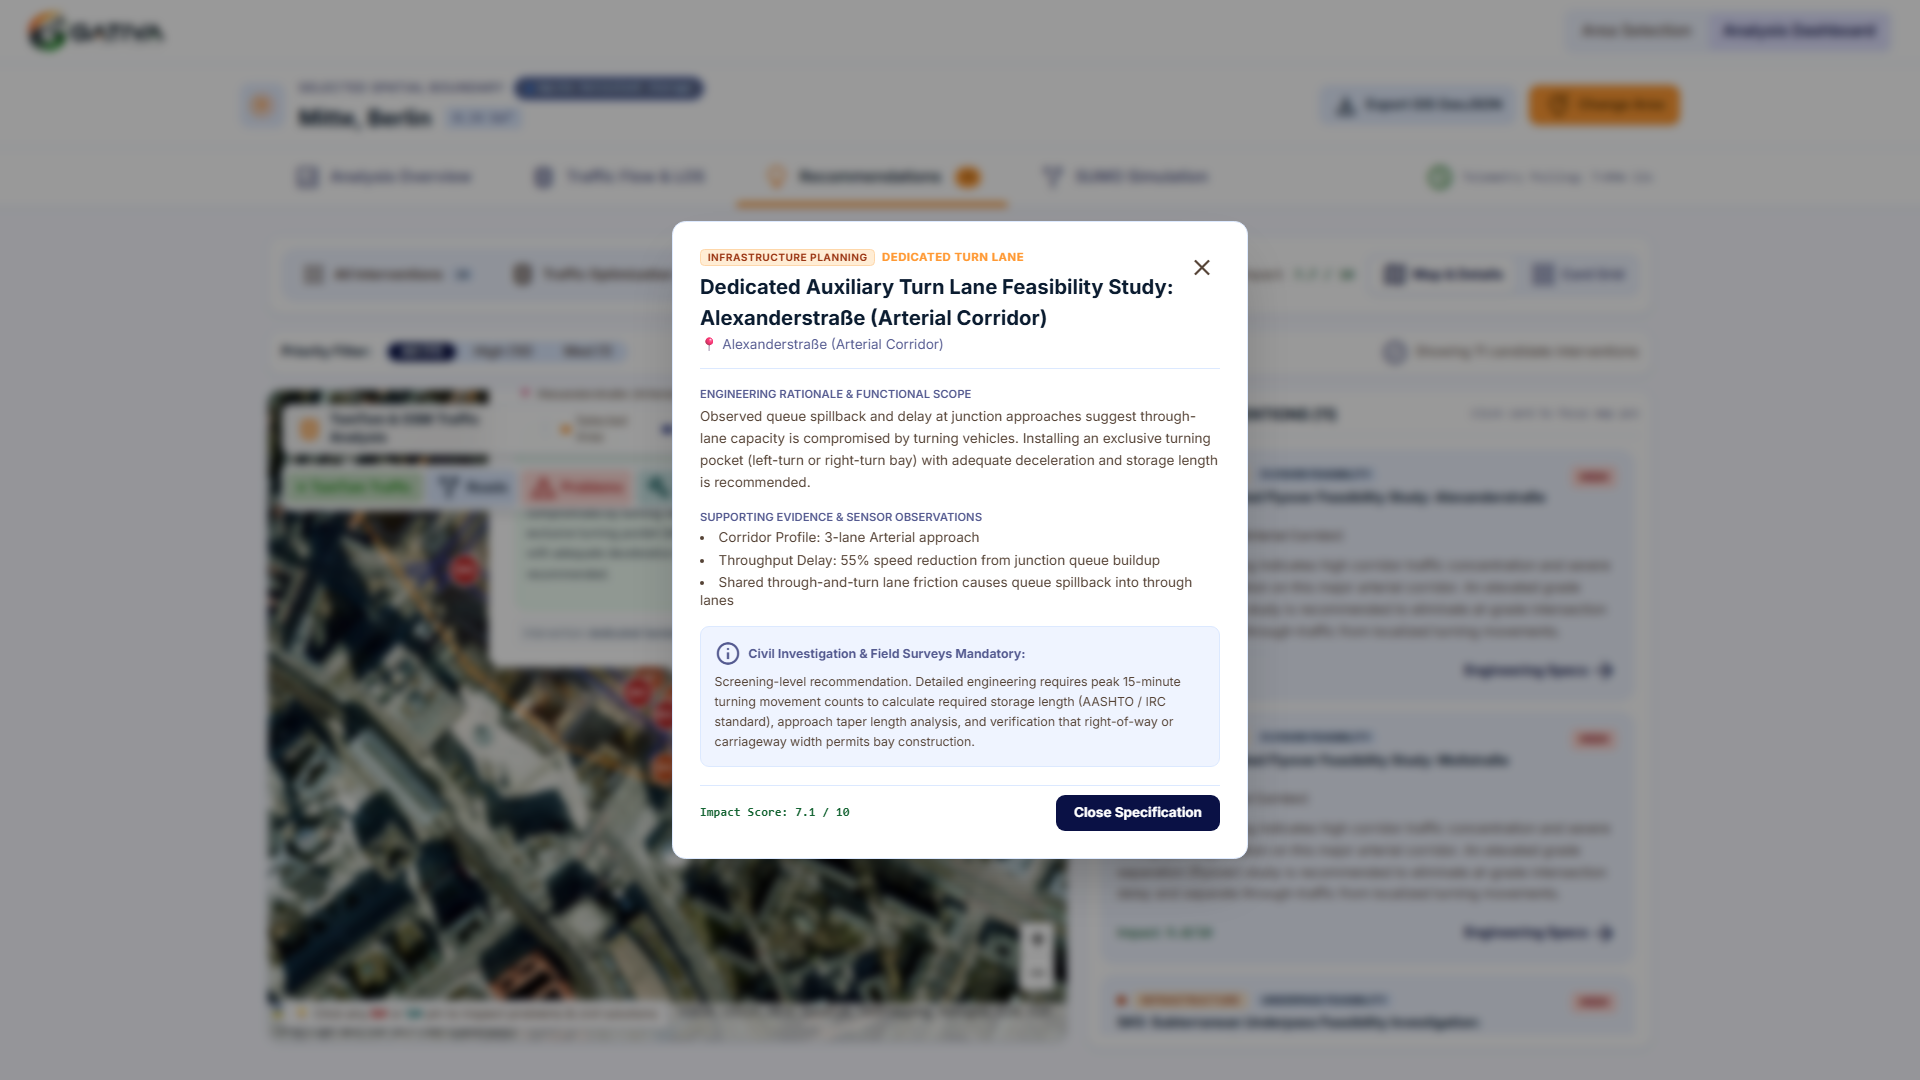
Recommendation page , The issues of that particular area will be listed on the mini map
-
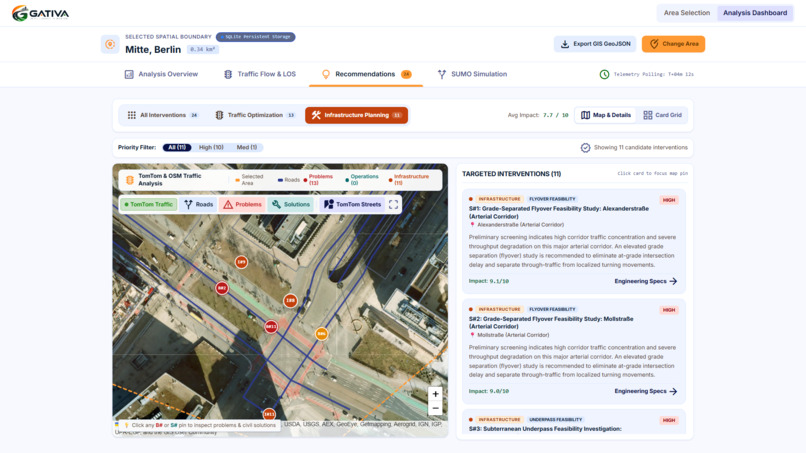
Recommendation page with satellite view for better analysis
-
-
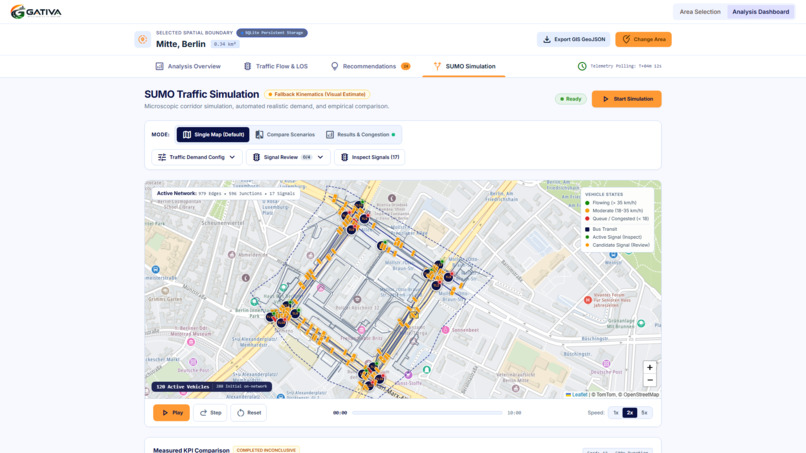
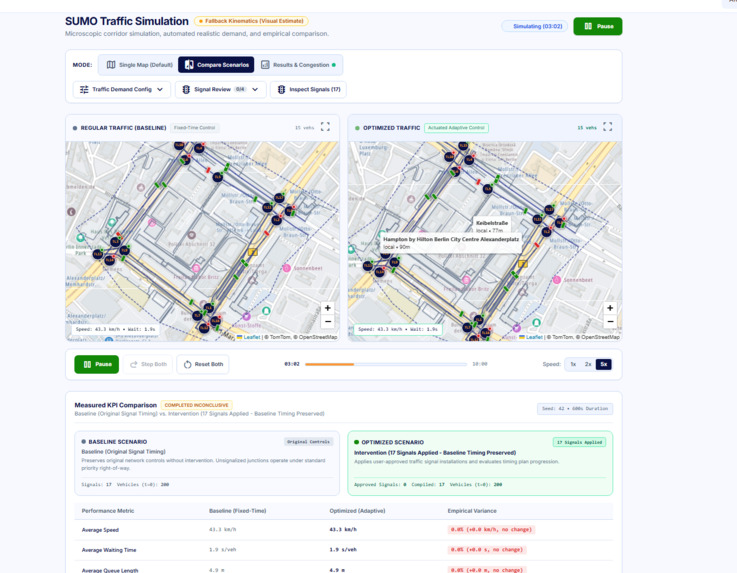
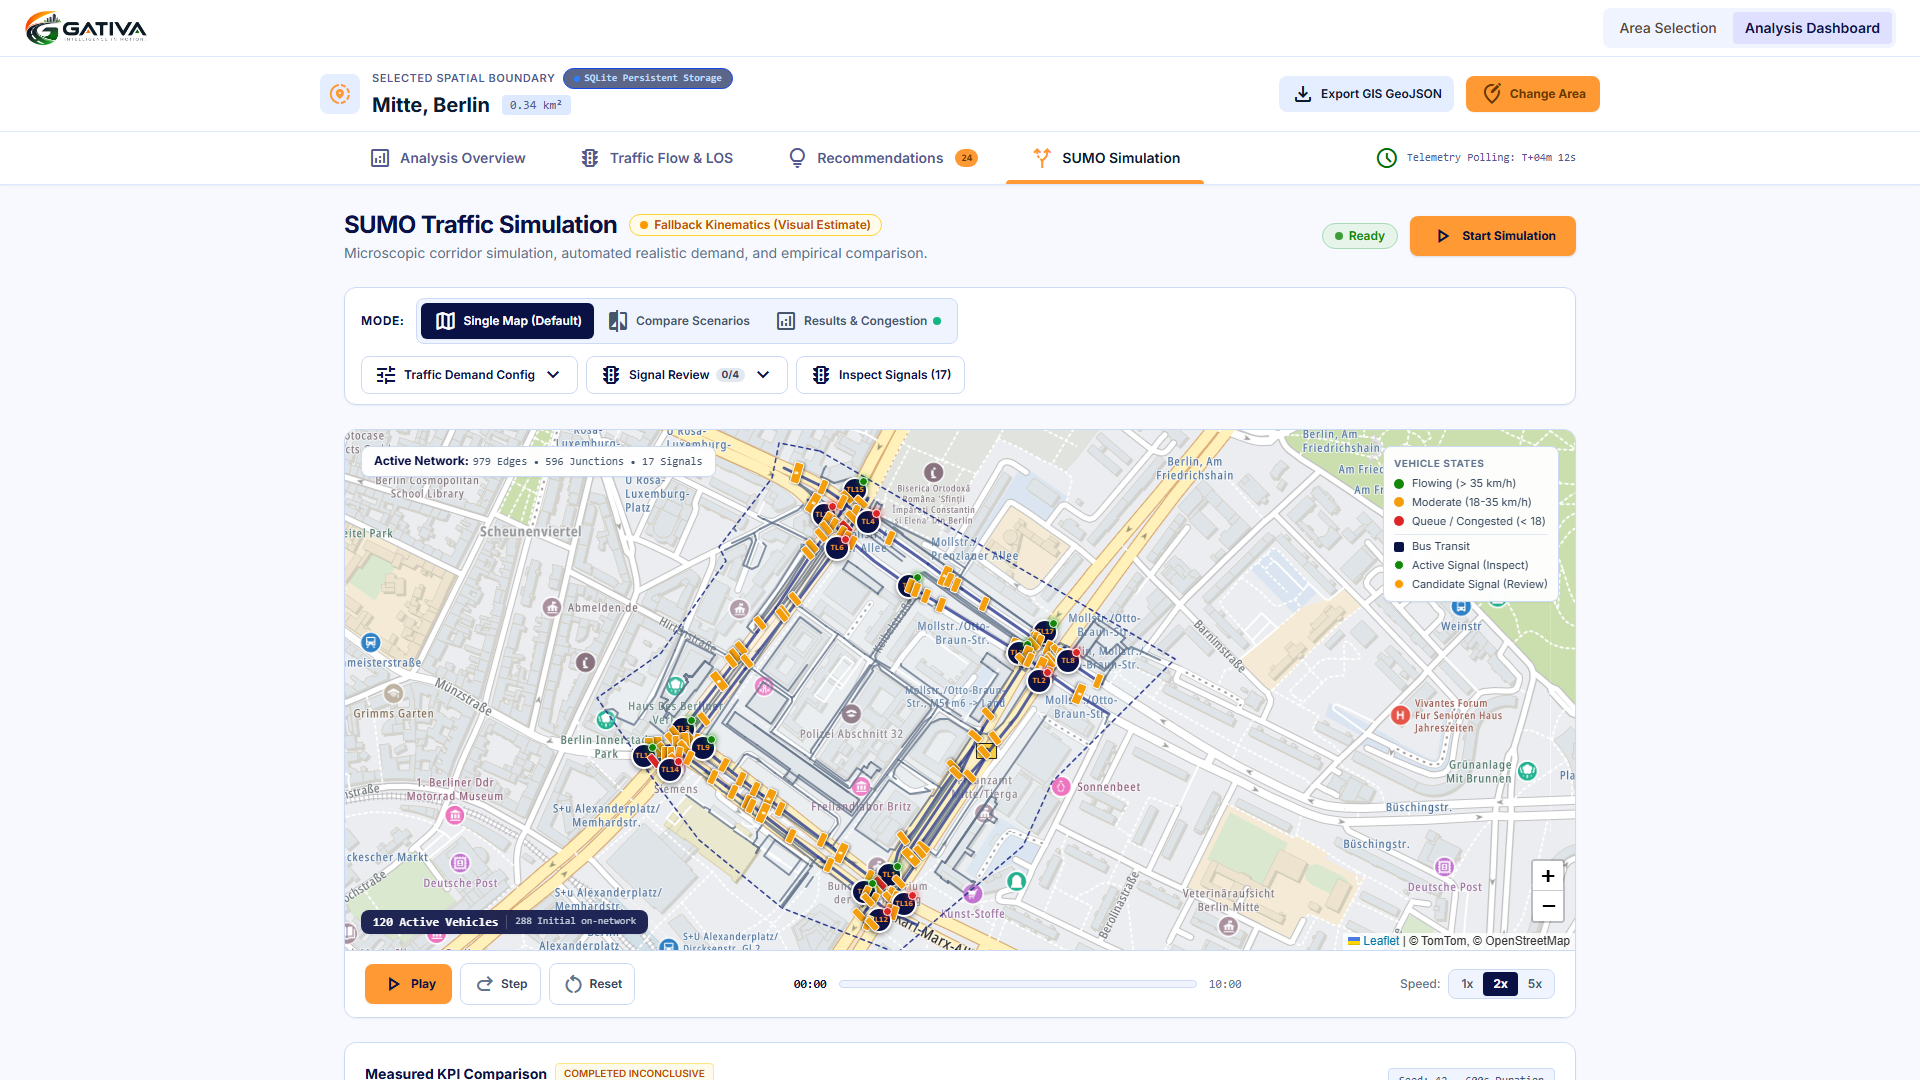
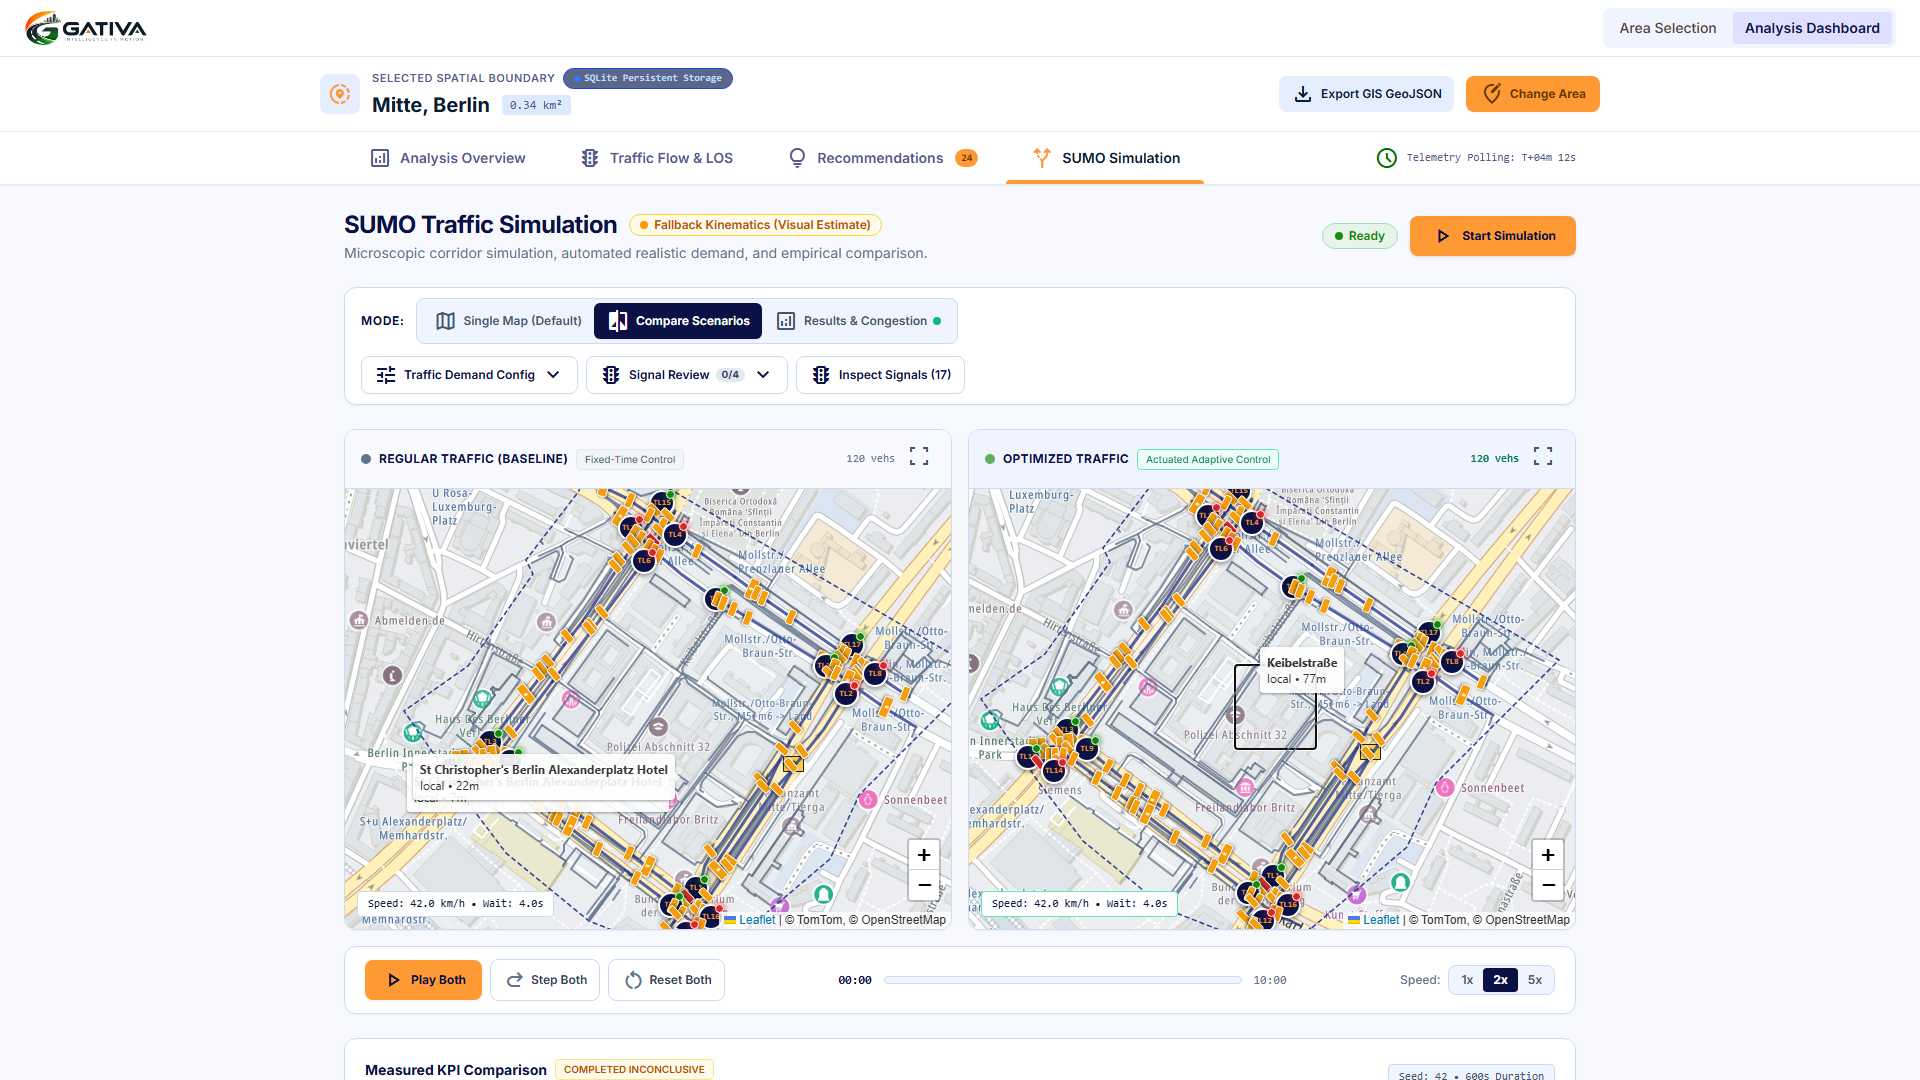
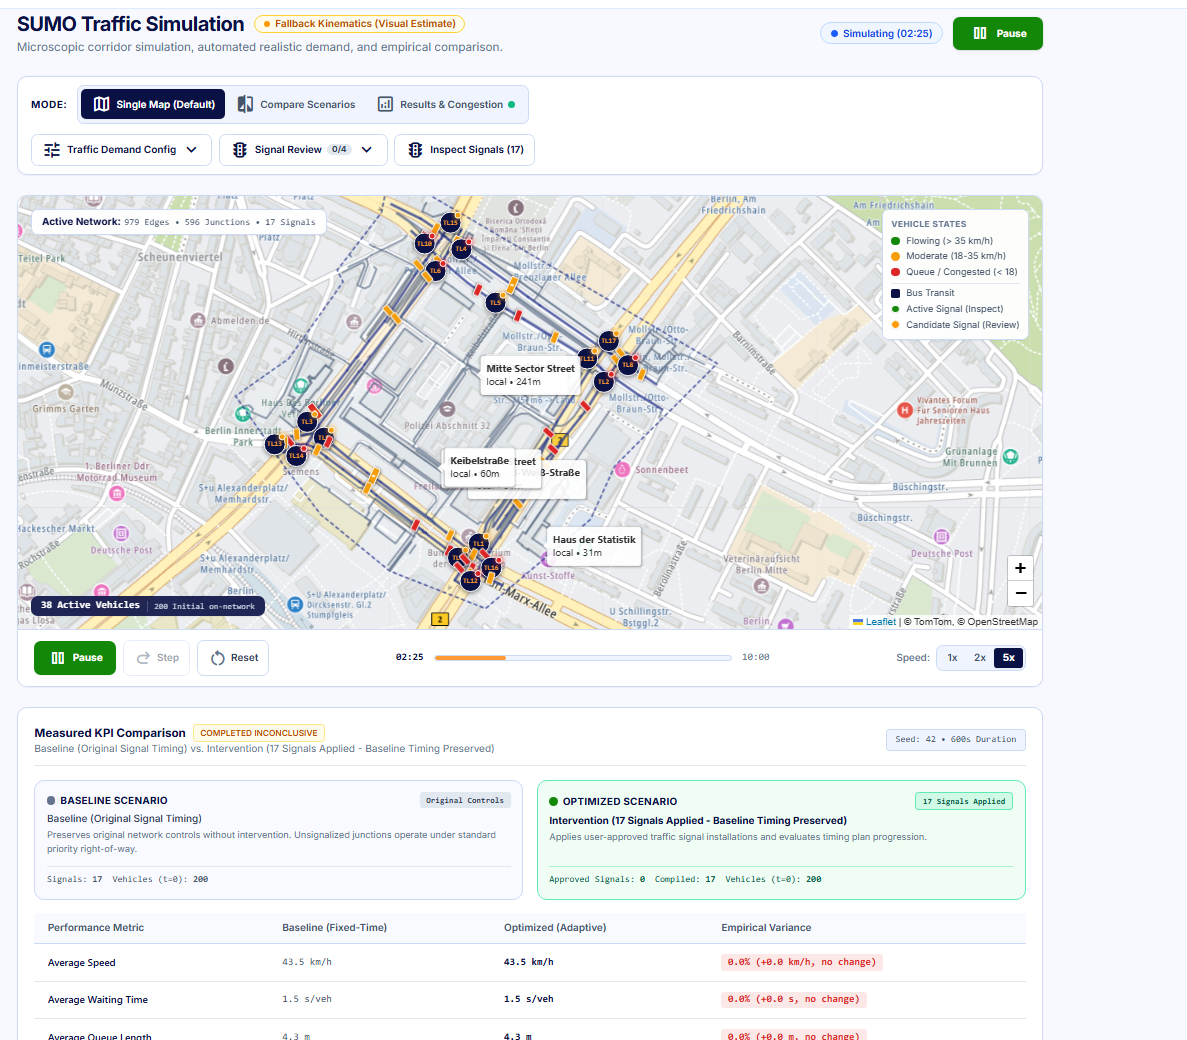
The Sumo Simulation , for analysis of that area with the configuration we want
-
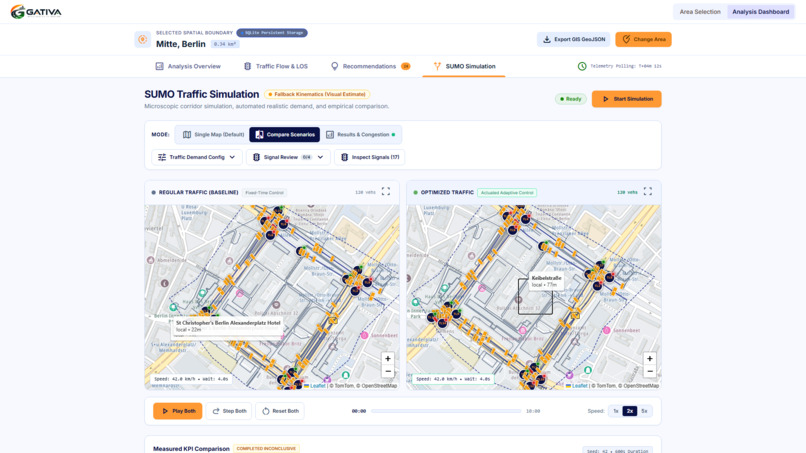
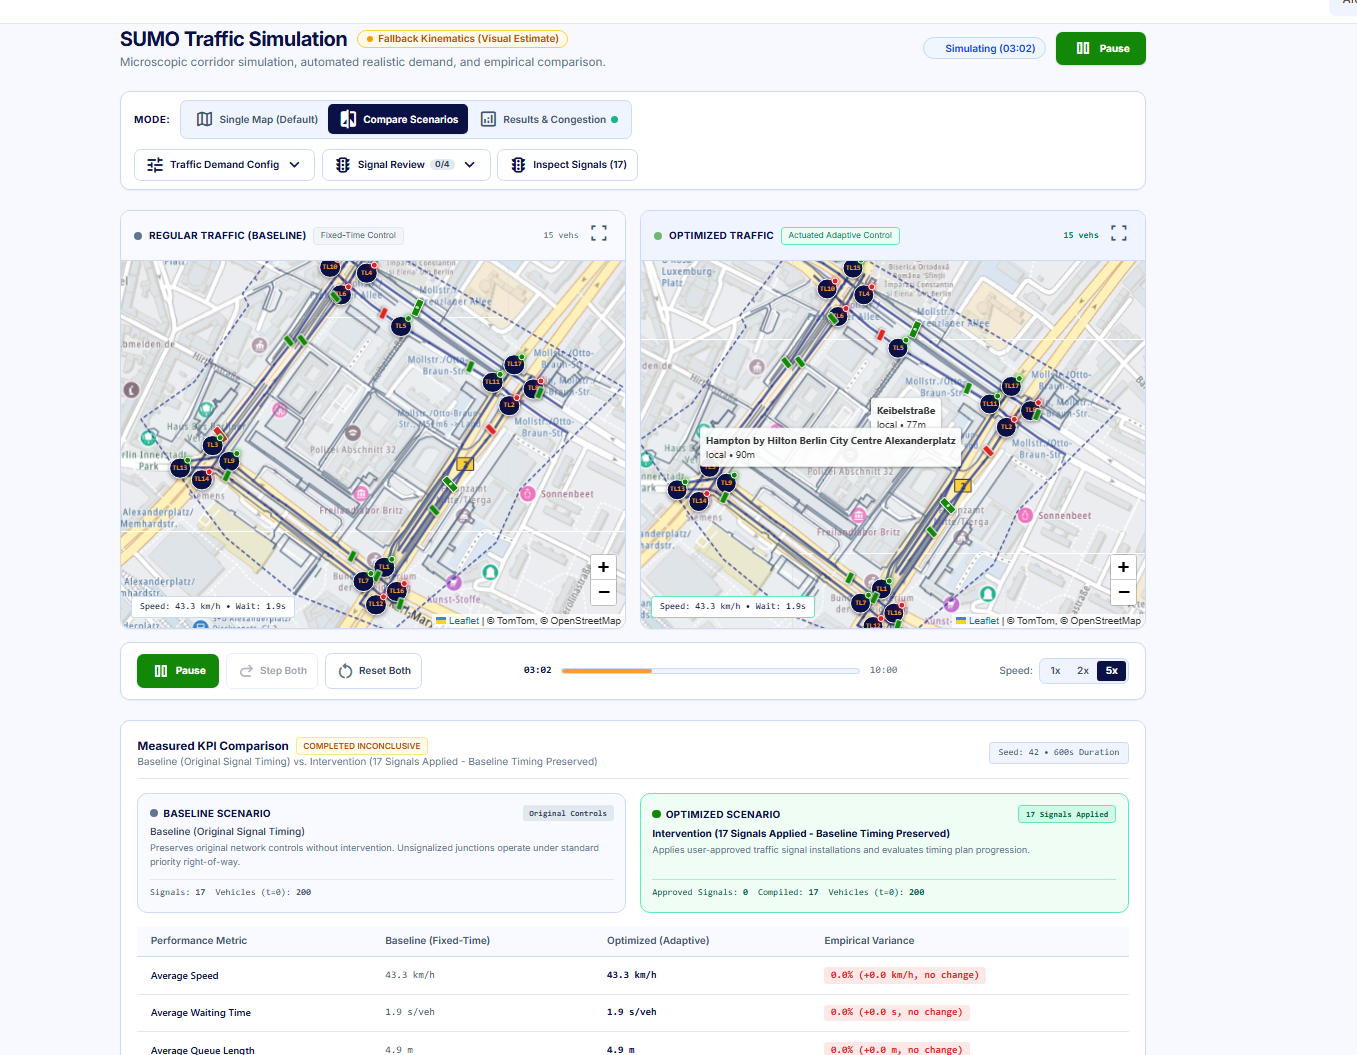
The comparison of the original area traffic flow analysis and the Optimized version
-
-
-
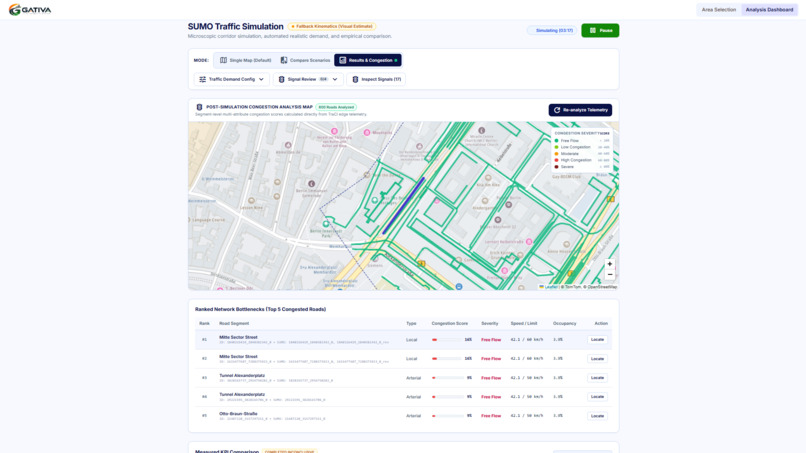
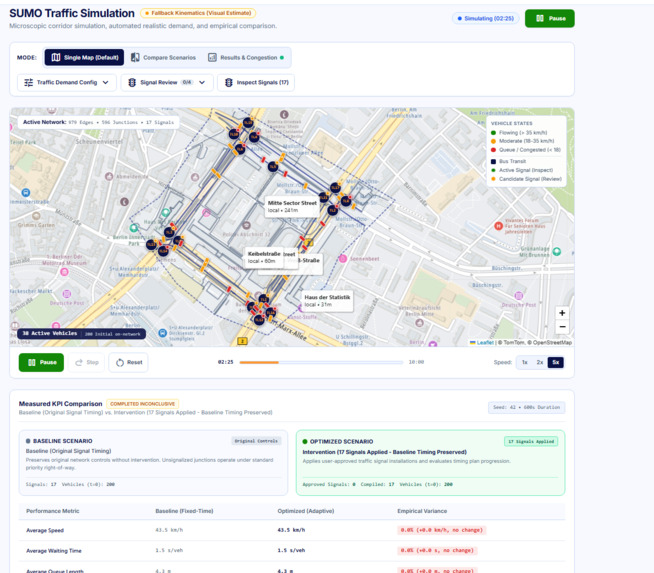
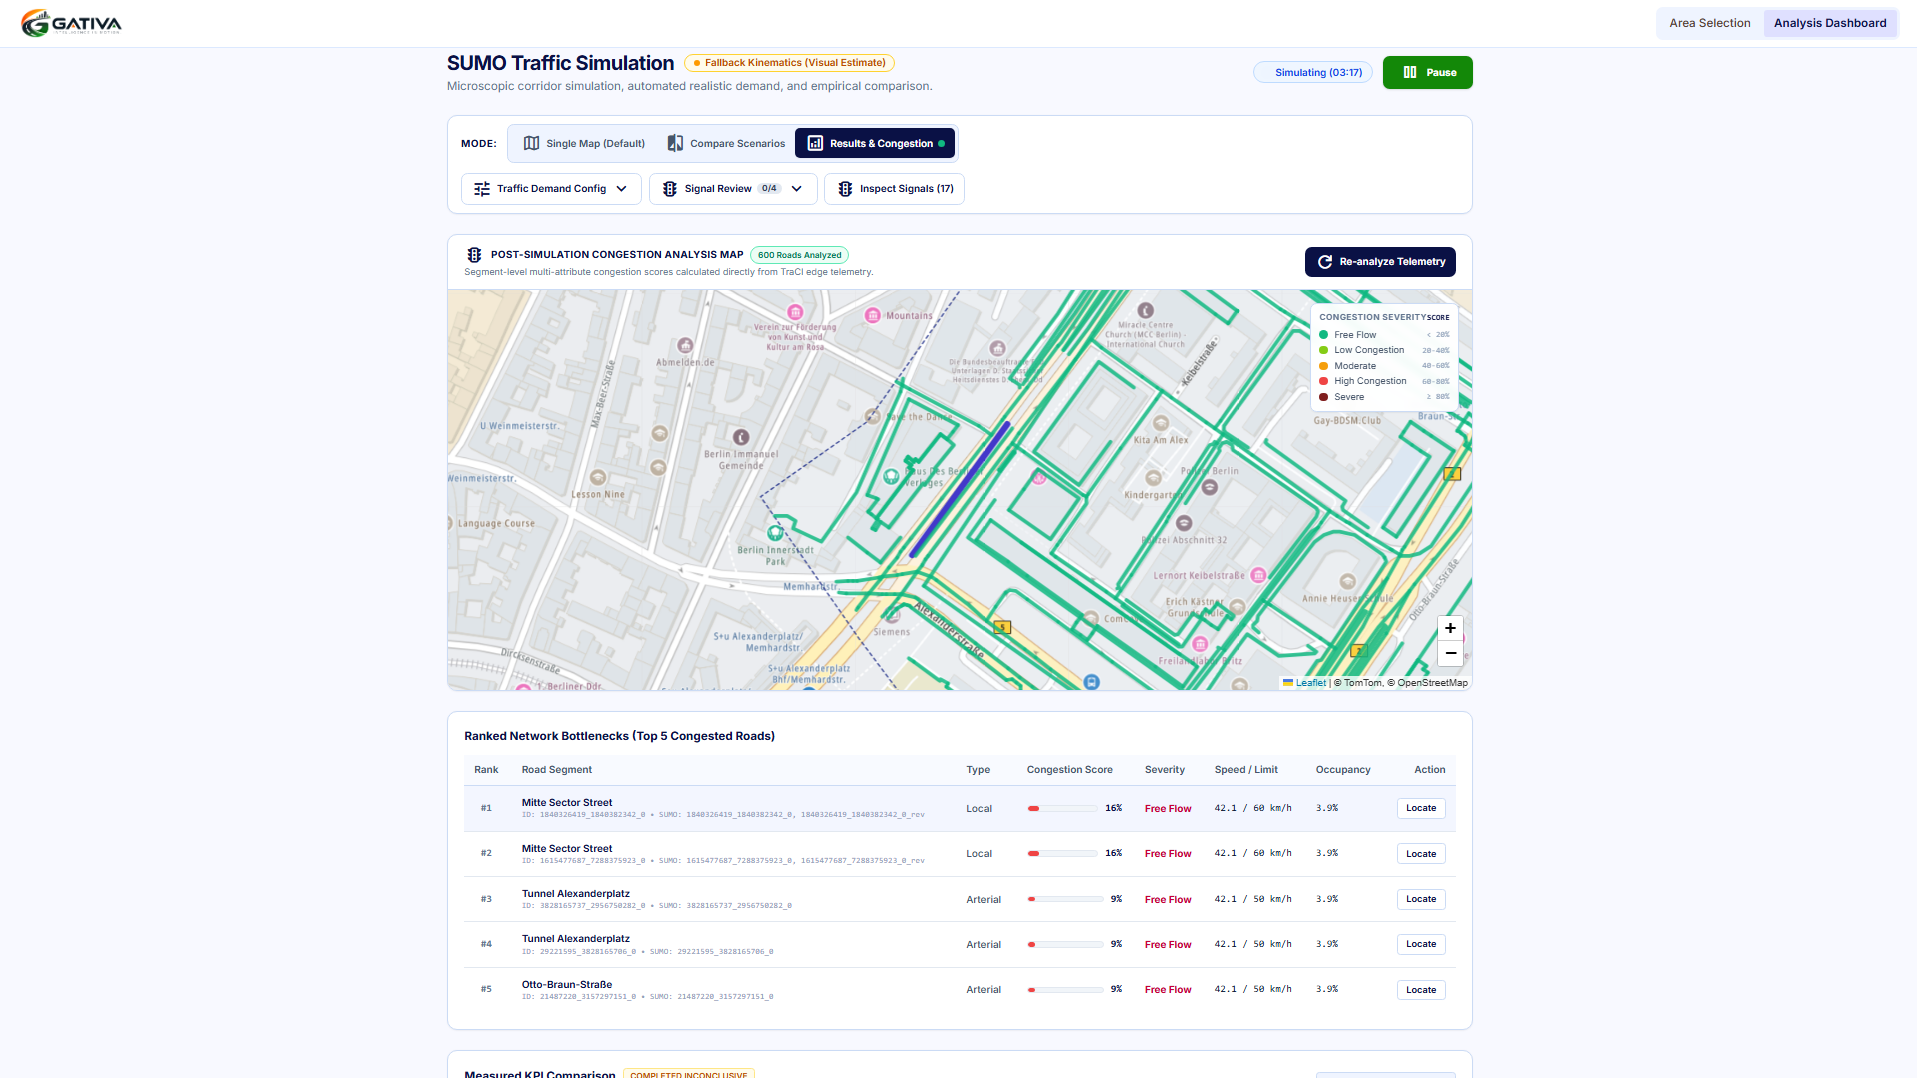
After the simulation ends we can analyze which area there is high level of congestion
Inspiration
Traffic congestion is more than an inconvenience. It wastes commuters’ time, increases fuel consumption, and makes cities less efficient. Yet, understanding where congestion occurs and how traffic flow can be improved is not always straightforward. We built Gativa to address this challenge by turning road-network and traffic information into insights that can help identify bottlenecks and explore smarter traffic-management strategies.
What it does
Gativa is a Smart Traffic Optimization System that helps users analyze traffic conditions across a selected urban area. It visualizes the road network, highlights potential bottlenecks, presents traffic-flow metrics, and generates recommendations for improving traffic movement. Its simulation capabilities also allow users to compare baseline traffic conditions with an optimized scenario, helping them understand how proposed changes could affect the network.
How we built it
We built Gativa as a full-stack web application using React and TypeScript for the interactive interface, FastAPI for backend services, and OpenStreetMap-based road-network data processed with OSMnx and NetworkX. We incorporated traffic analysis and SUMO-based simulation capabilities to examine road-network behavior and compare traffic scenarios. The dashboard brings these results together through interactive maps, traffic metrics, and actionable recommendations.
Challenges we ran into
One of our main challenges was translating a complex road network into useful, understandable insights. Identifying potential bottlenecks requires more than displaying roads on a map; it requires analyzing network structure, interpreting traffic indicators, and presenting the results clearly. We also had to connect the frontend, backend, and simulation components while keeping the interface consistent and the analysis workflow reliable.
Accomplishments that we're proud of
We are proud to have built more than a traffic visualization tool. Gativa brings together road-network analysis, bottleneck identification, traffic metrics, recommendations, and simulation-based comparisons in one platform. Instead of leaving users to interpret raw traffic information themselves, it aims to make potential problems easier to identify and possible improvements easier to explore.
What we learned
Building Gativa taught us that solving a real-world traffic problem requires more than choosing an algorithm or integrating a map. The quality of the underlying data, the reliability of the analysis, and the clarity of the results are equally important. We also learned how to bring mapping, backend processing, network analysis, and simulation together into a single application.
What's next for Gativa
Our next goal is to make Gativa more adaptive and data-driven. We plan to strengthen real-time traffic integration, improve congestion prediction using historical traffic patterns, and develop more robust optimization strategies. We also want to validate simulated improvements against real traffic observations and evaluate outcomes such as travel time, congestion levels, and traffic flow. Ultimately, we aim to help urban planners and traffic-management teams make better-informed decisions about building smarter, more efficient cities.
Built With
- fastapi
- networkx
- openstreetmap
- osmnx
- python
- react
- restapi
- sumo
- typescript

