Inspiration
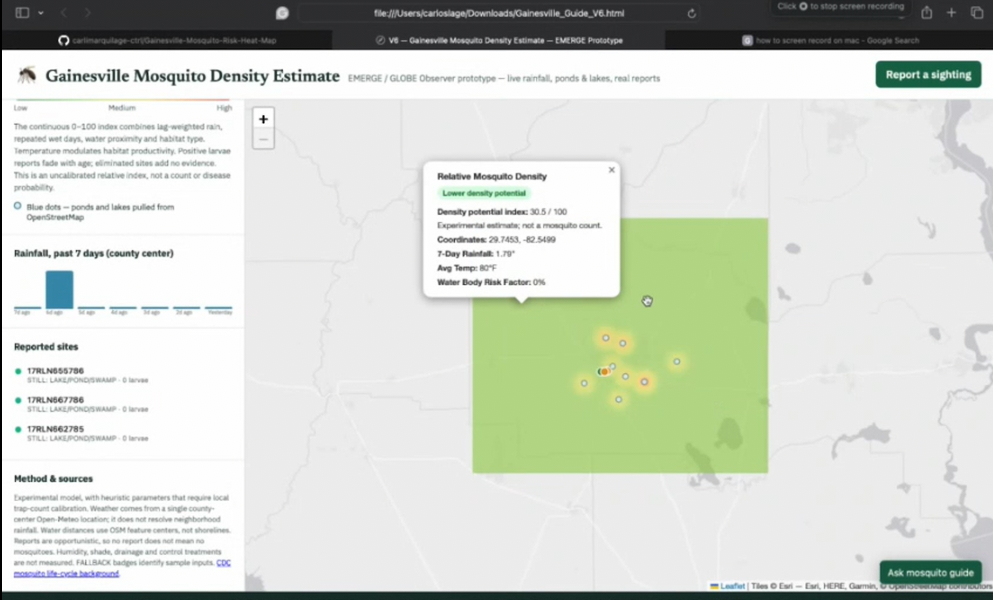
Dengue is a viral infection that has generated rising concern on Florida, and has also affected the city of Gainesville. With the help of NASA's GLOBE Observer database, we decided to create an interactive map that tracks heat zones of mosquito populations, distance to water zones, rainfall, and other factors such as temperature, and user reports. This mechanic is designed to help users identify spots where risk may be higher, generate awareness, and prevent dengue and other infections carried by mosquitoes.
What it does
Our algorithm estimates relative mosquito density using rainfall and from the past week, proximity to water, temperature suitability, and recent larvae observations. It also considers repeated wet days, water-feature type, and report age.
We calculate scores across a geographic grid and smoothly interpolate between them to create a continuous green-to-red surface. Unlike overlapping heat map dots, this approach avoids artificially increasing intensity when zooming out.
We included labeled sample data when live sources are unavailable and tested the model's behavior under different conditions. The prototype still needs browser troubleshooting and calibration against local mosquito counts before its estimates can be validated.
How we built it
We built our prototype using HTML, CSS, and JavaScript, with Leaflet for the interactive map. We added integrations for Open-Meteo rainfall and temperature data, OpenStreetMap water features and NASA GLOBE Observer mosquito habitat reports.
Challenges we ran into
We faced difficulties with incorporating the map's data and creating an interface that accurately reflects the data from our databases. The project still needs to be improved to make sure the data is validated and made in an even more user-friendly way.
Accomplishments that we're proud of
The map has a promising design, providing different measures to create awareness and have a better understanding of mosquito populations. We are proud of our teamwork when creating the website and we are glad that we could use NASA's database to identify the risk level of mosquito populations on Gainesville, creating a positive impact on our community, and providing the steps for improvements and next steps on mosquito-related infections.
What we learned
We learned that starting a project in a short time that creates a positive impact is possible, when done through teamwork and dedication.
What's next for Gainesville Mosquito Risk Map
We want to keep improving the project by validating the data, and adding more features such as prevention checklists, a "Check My Yard" feature that identifies possible risk increasing water spots, symptoms and emergency signs, and official source warnings.
Built With
- css
- github
- html
- javascript
- leaflet.js
- nasa-globe-observer
- open-meteo
- openstreetmap

Log in or sign up for Devpost to join the conversation.