-
-
Intro
-
Problem
-
Solution
-
What it does
-
Metrics
-
Why
-
Tech Stack
-
Future Plans
-
-
-
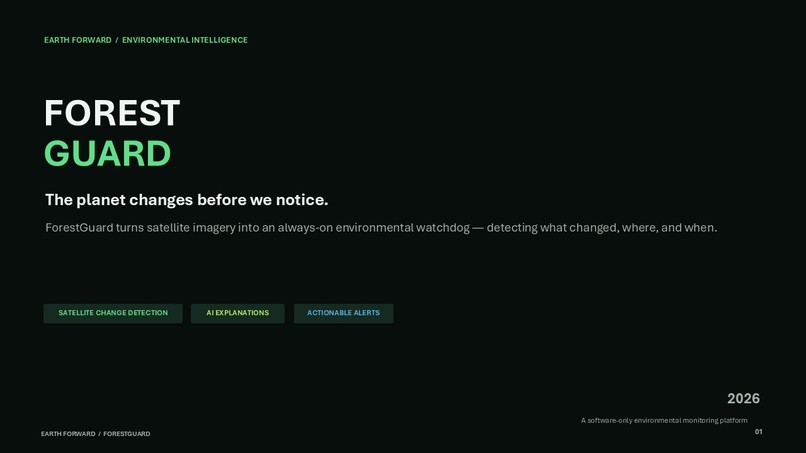
ForestGuard: Satellite-Powered Environmental Change Detection Platform
Inspiration
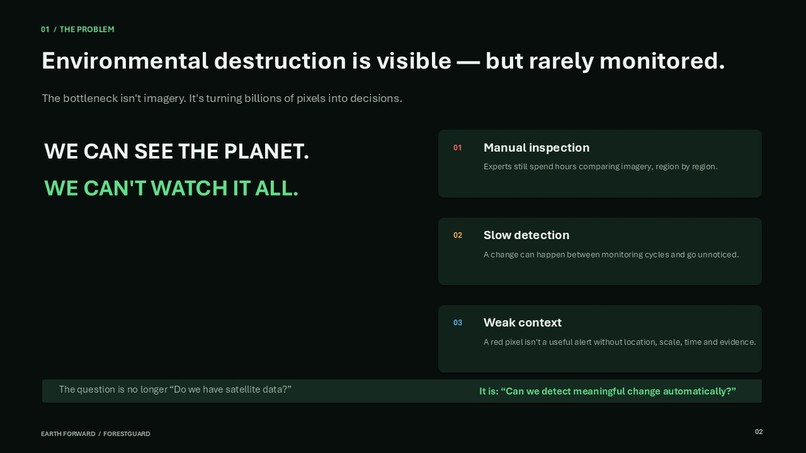
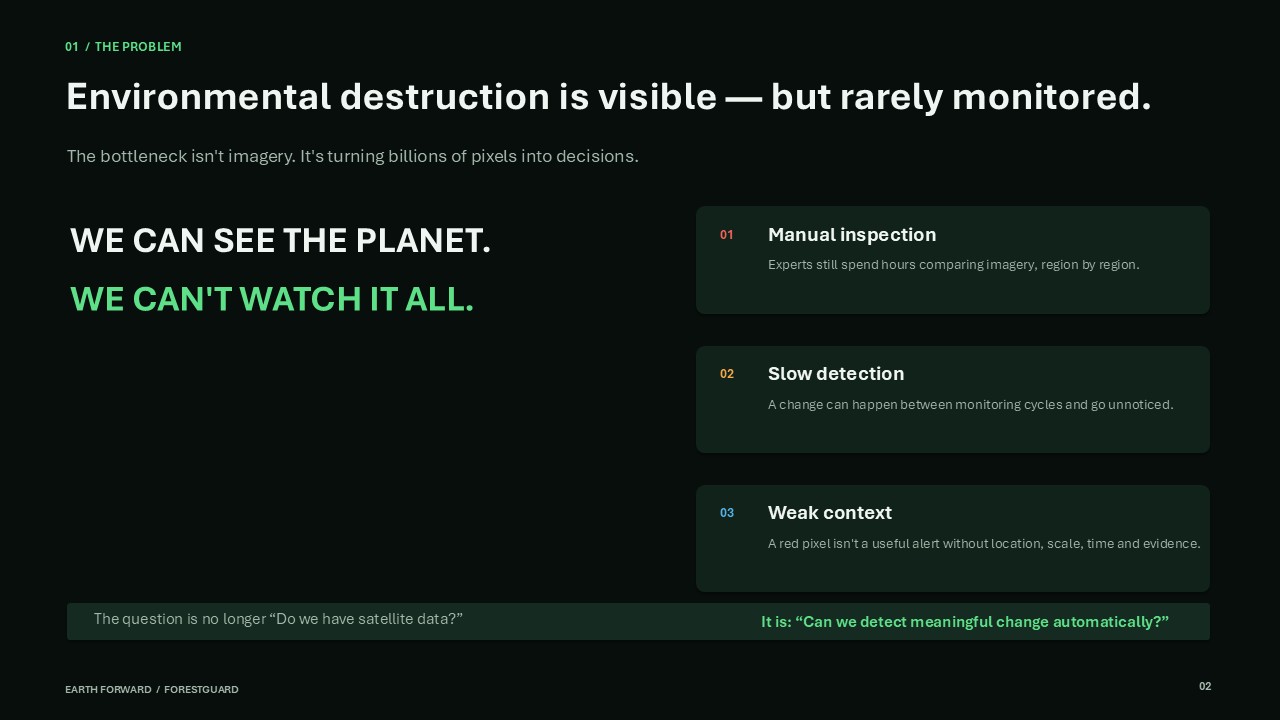
Climate change and deforestation move fast, but satellite data analysis stays slow. Environmental researchers, NGOs, and park rangers often lack the tools to rapidly process satellite imagery and detect meaningful changes on the ground. Raw Sentinel-2 data requires expertise in remote sensing, Python, and Google Earth Engine just to answer a simple question: What changed here?
ForestGuard started from a frustration: why can't a park ranger draw a polygon on a map, pick two dates, and immediately see where forest was cleared or water receded? We built the tool we wished existed — one that turns spectral indices into actionable intelligence without requiring a PhD in remote sensing.
The project was inspired by real-world monitoring gaps in the Amazon rainforest, drought-stricken reservoirs in the American Southwest, and rapid urbanization encroaching on green spaces. We wanted to democratize satellite analysis for the people who need it most: those protecting the land.
What It Does
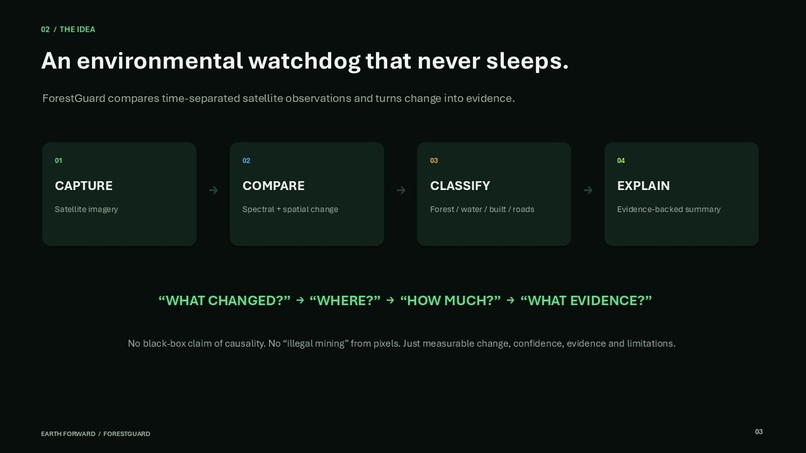
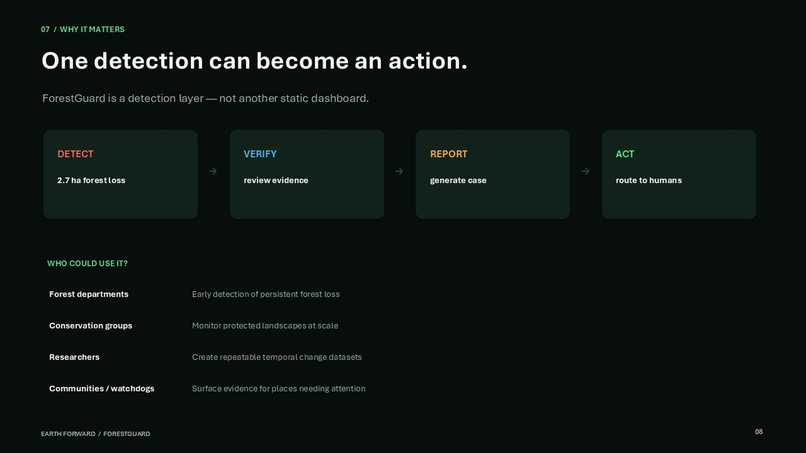
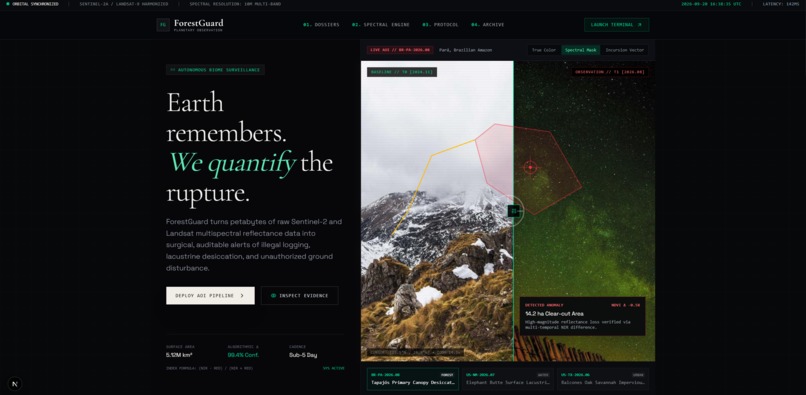
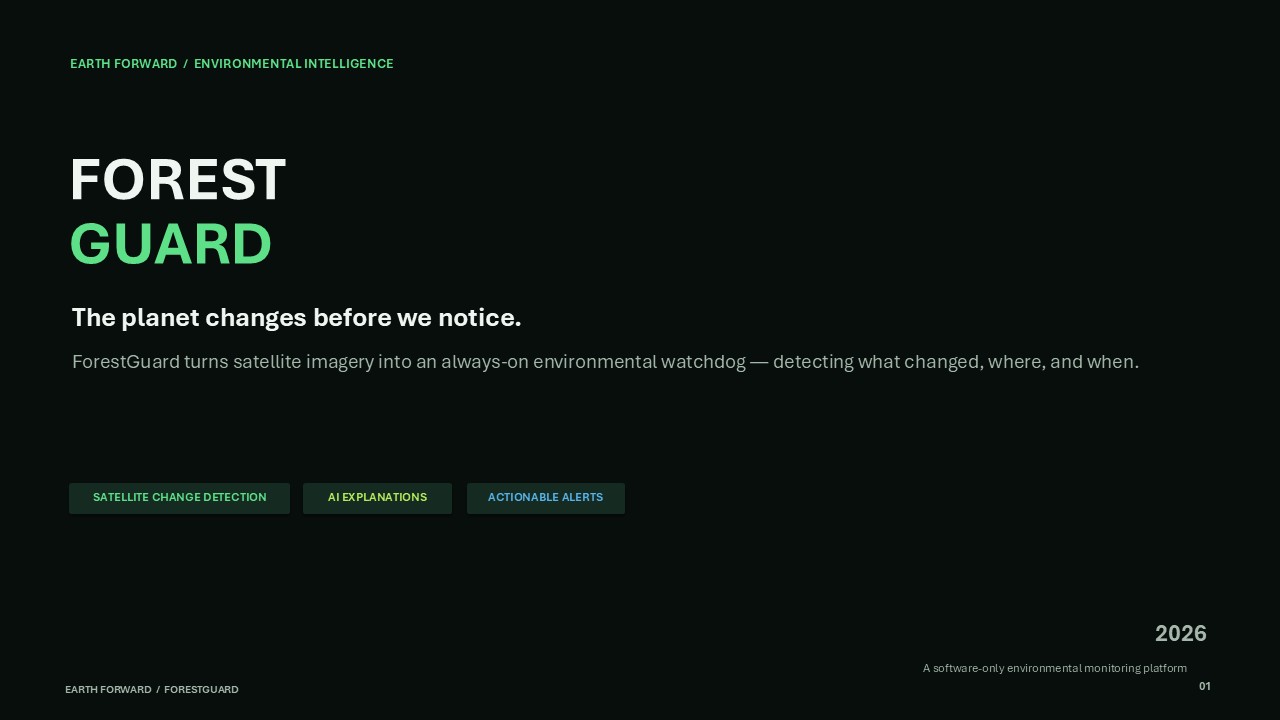
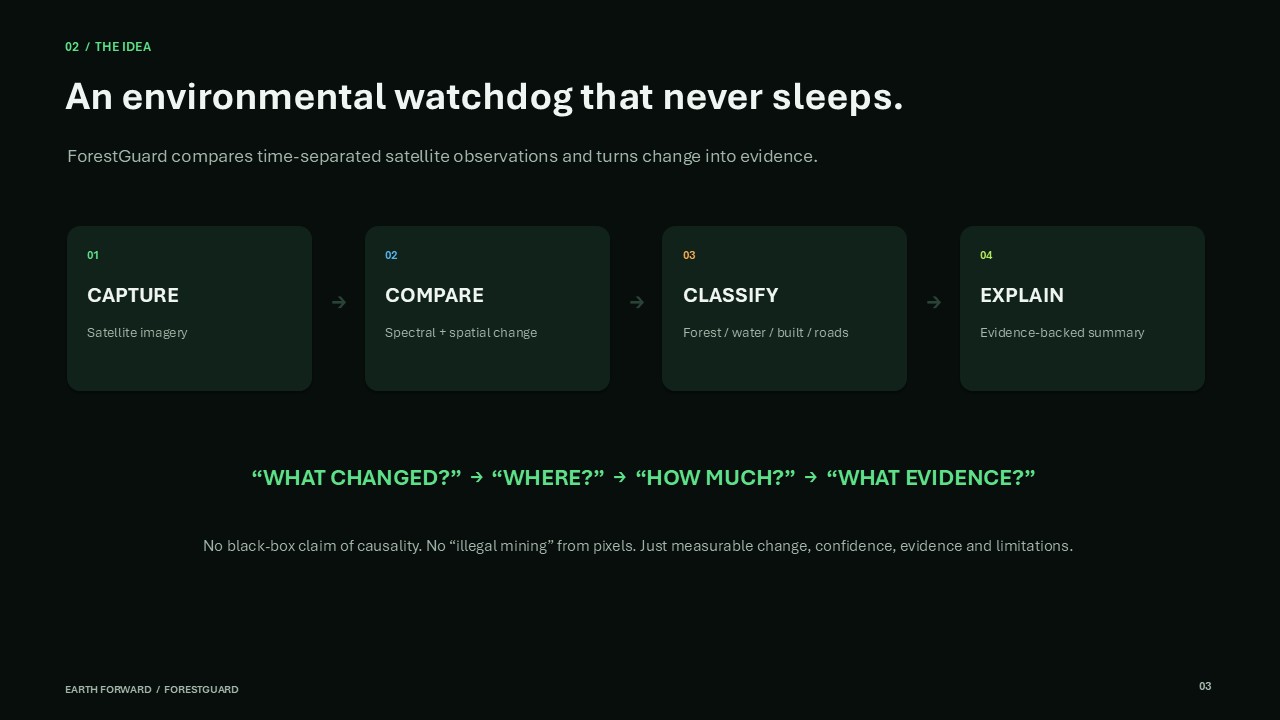
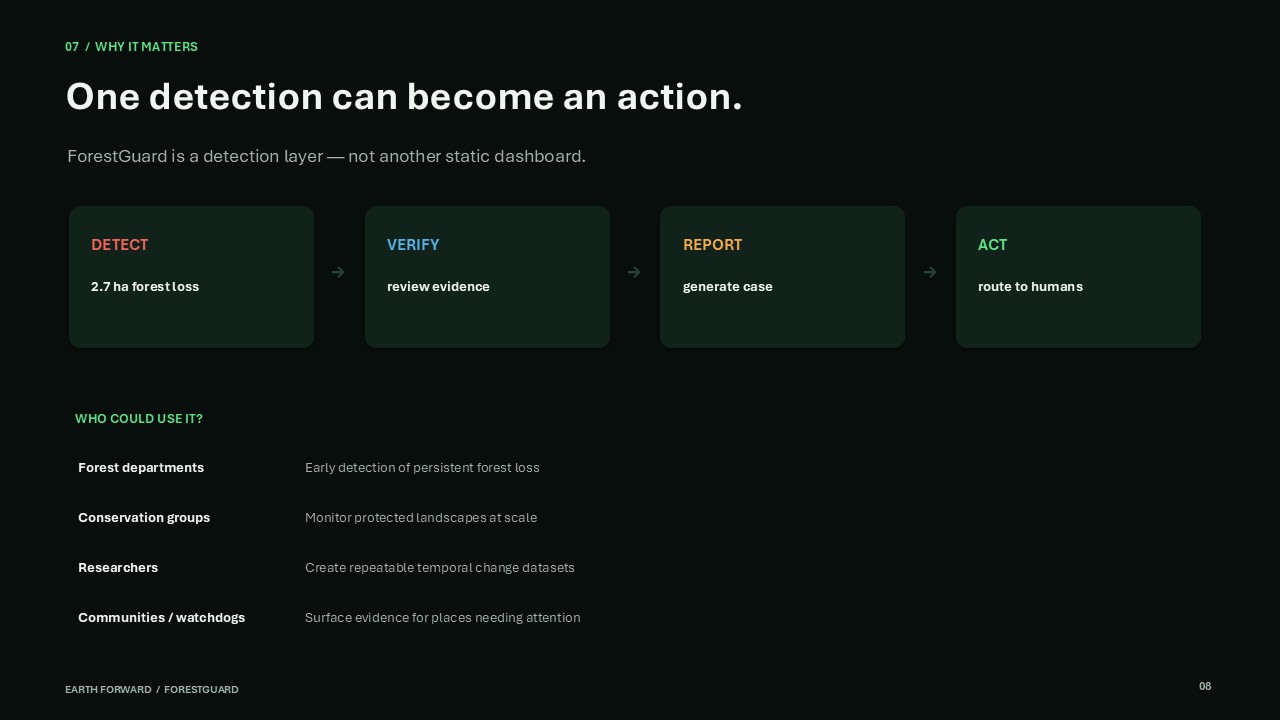
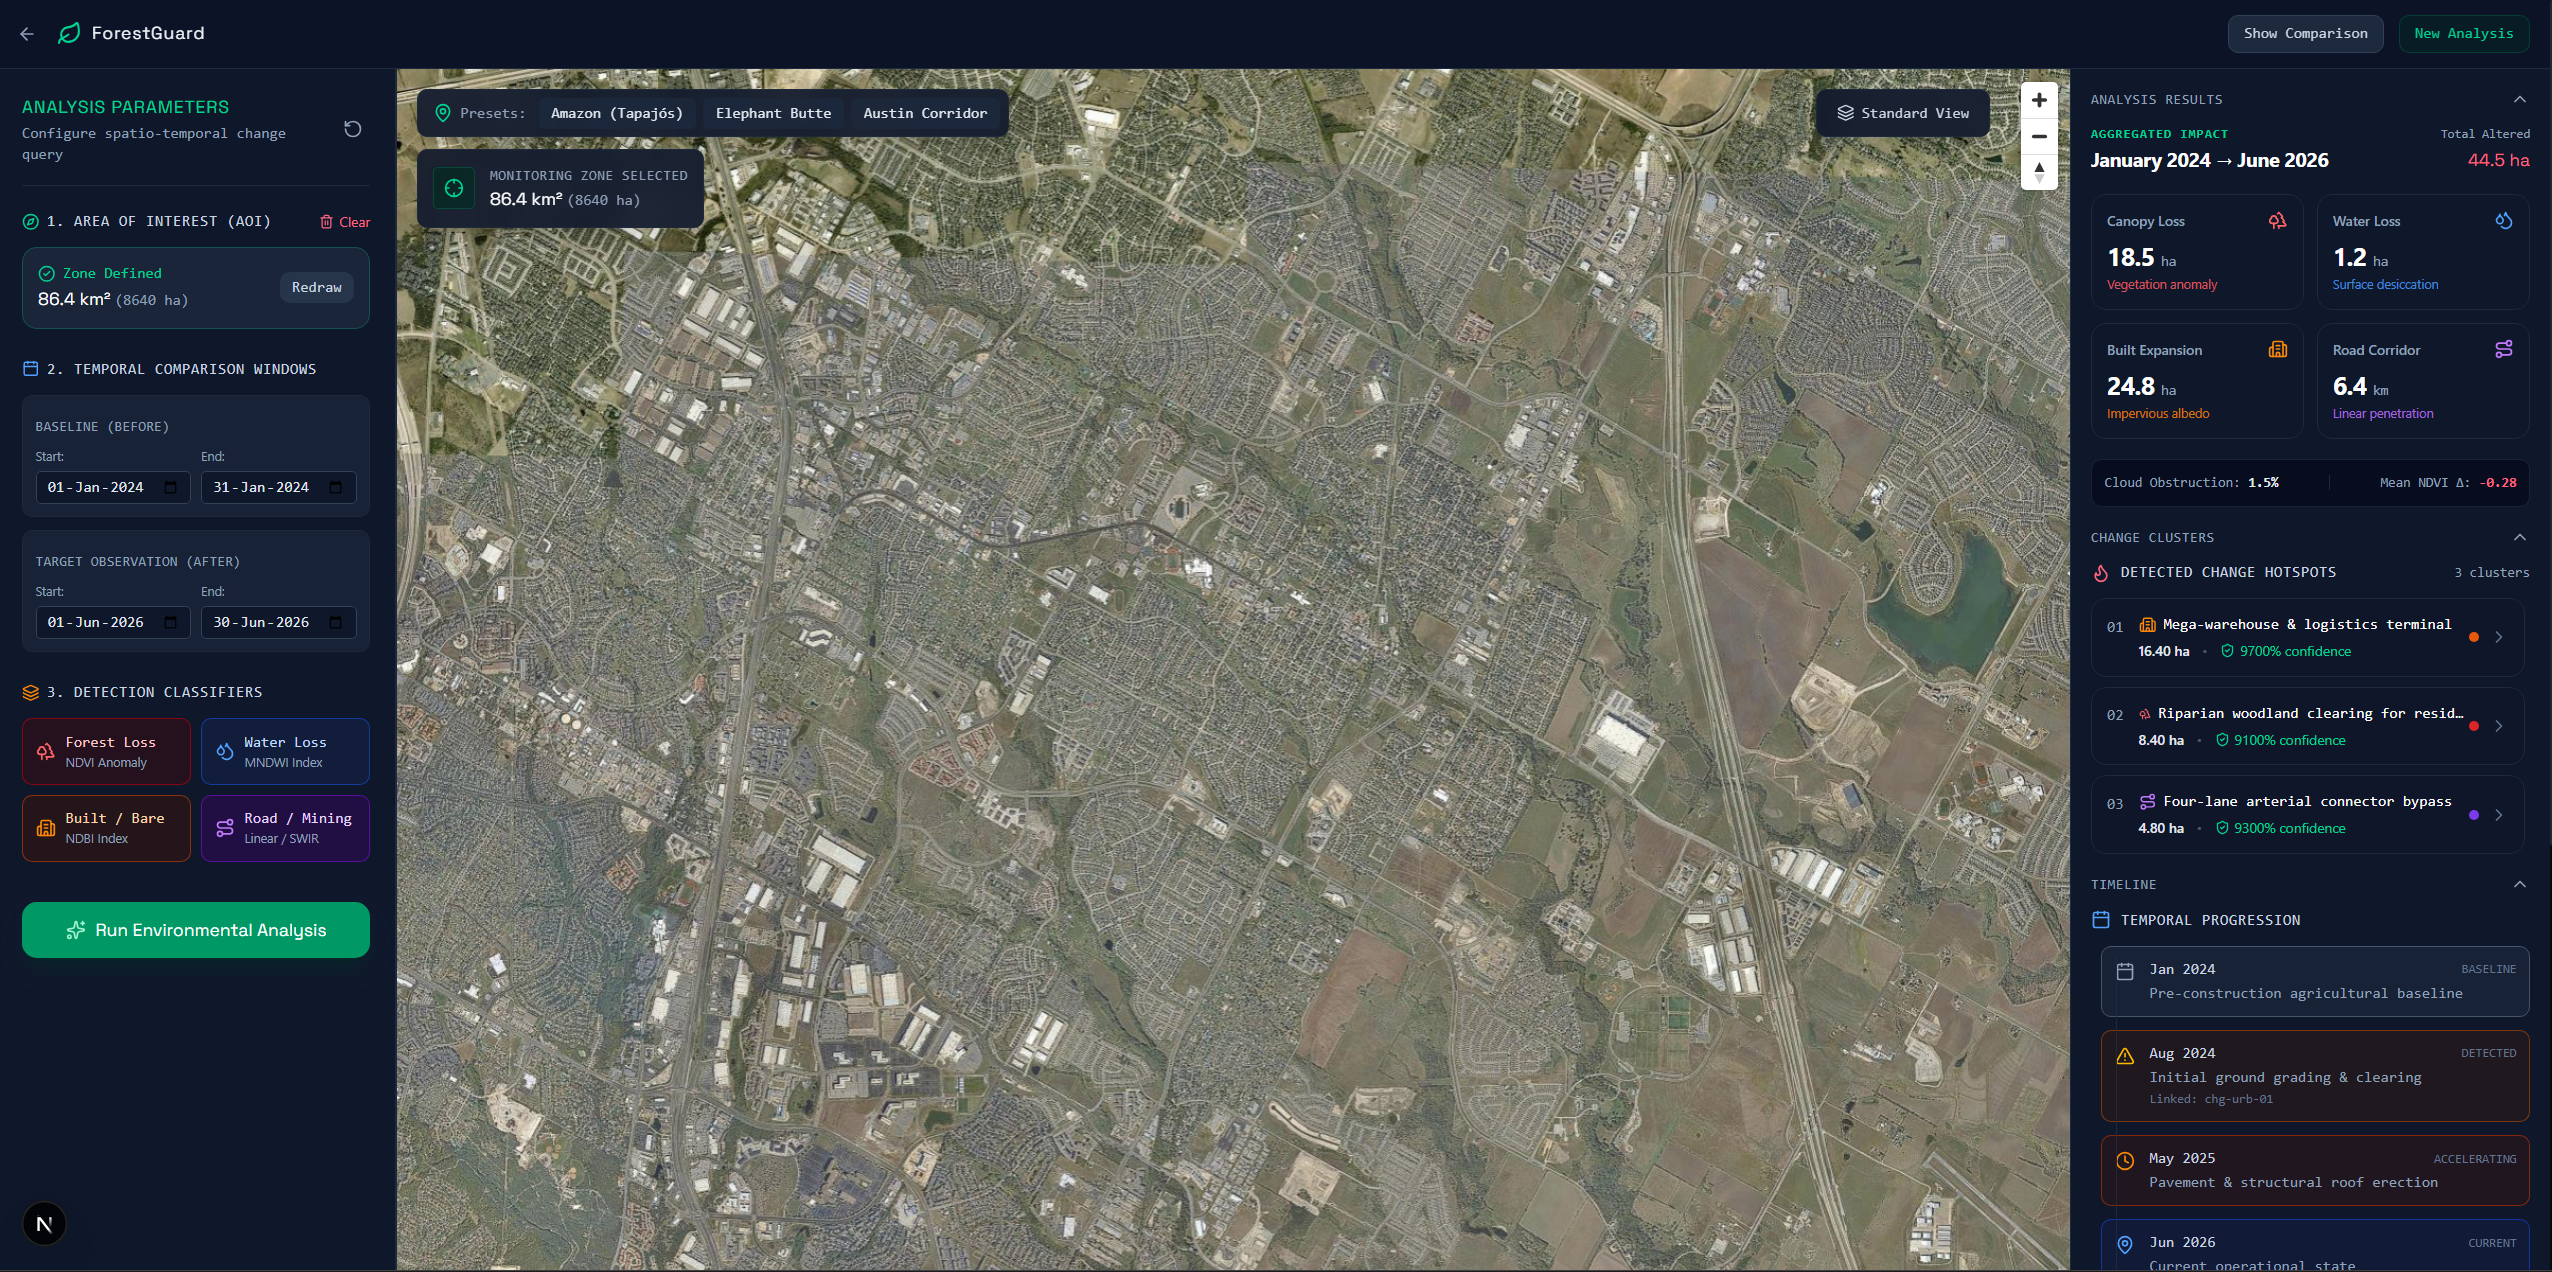
ForestGuard is a full-stack satellite monitoring and environmental change detection platform that transforms raw multispectral imagery into actionable insights.
Core capabilities:
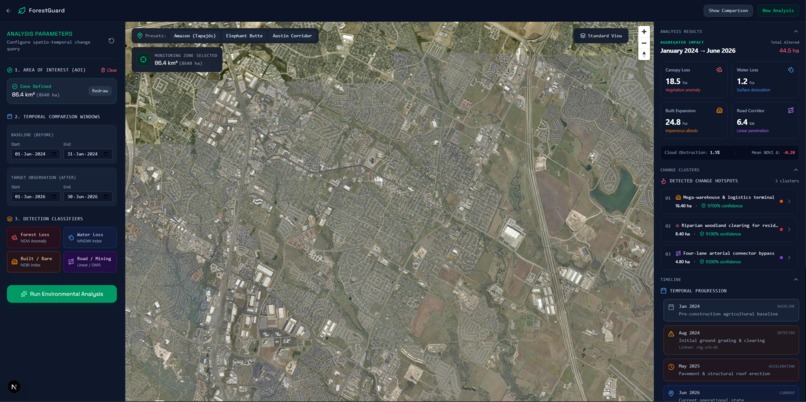
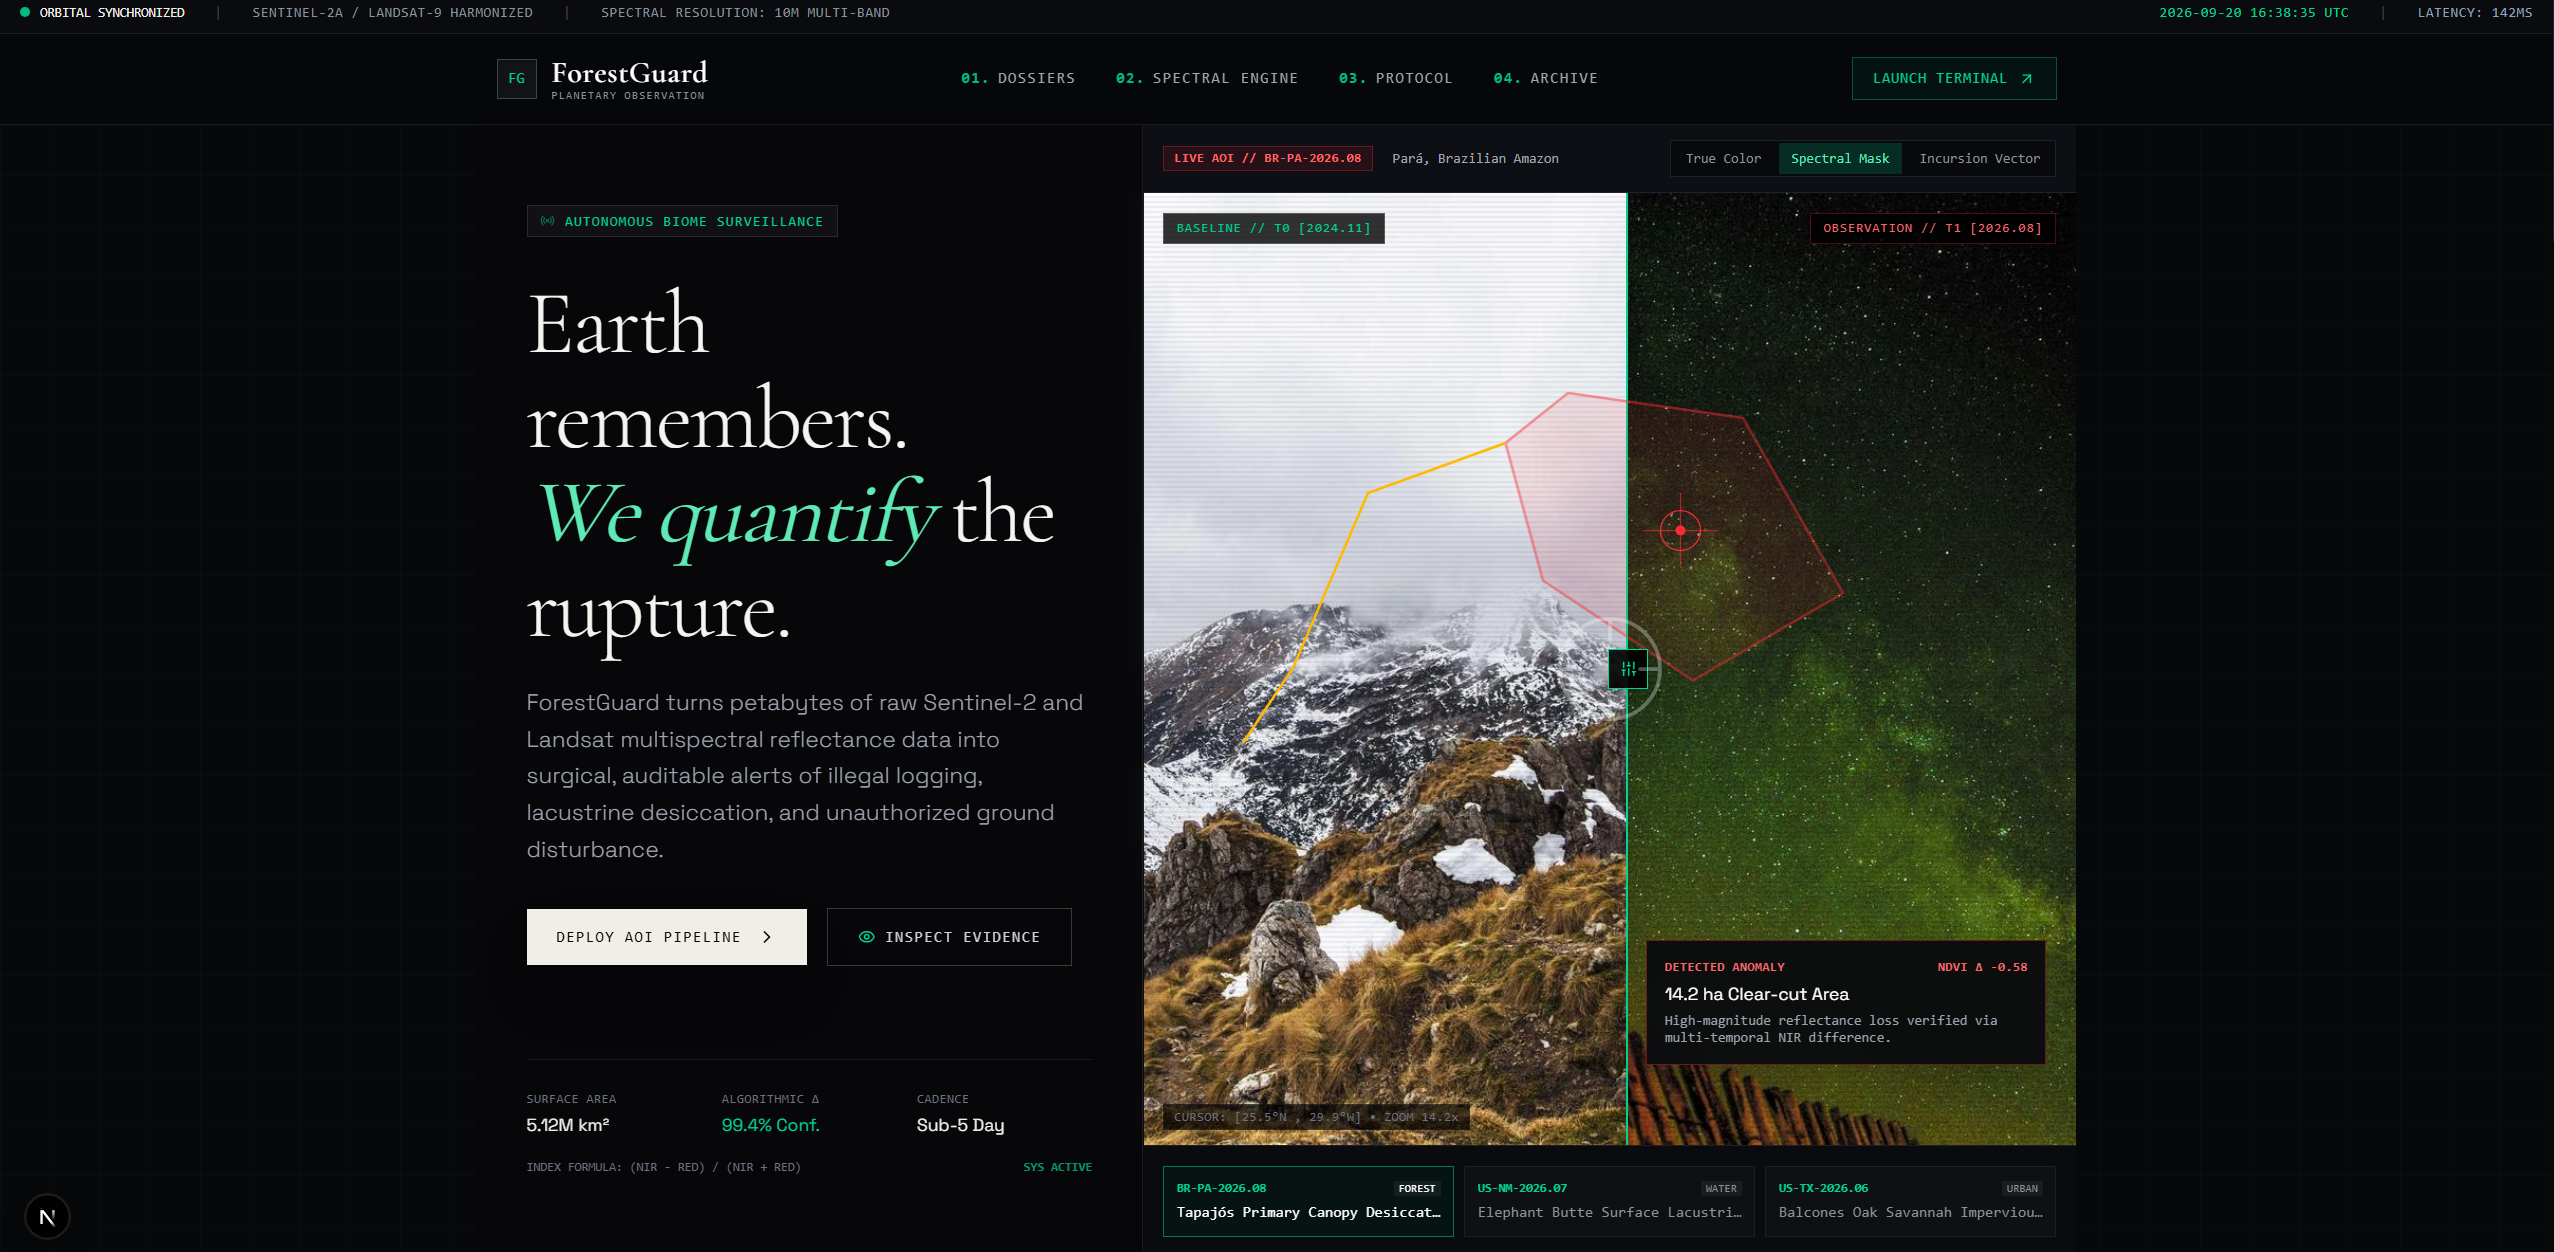
- Interactive AOI Selection: Draw arbitrary polygon boundaries on a MapLibre GL map or load pre-configured benchmark sites (Amazon deforestation, Elephant Butte Reservoir water loss, Austin urban expansion)
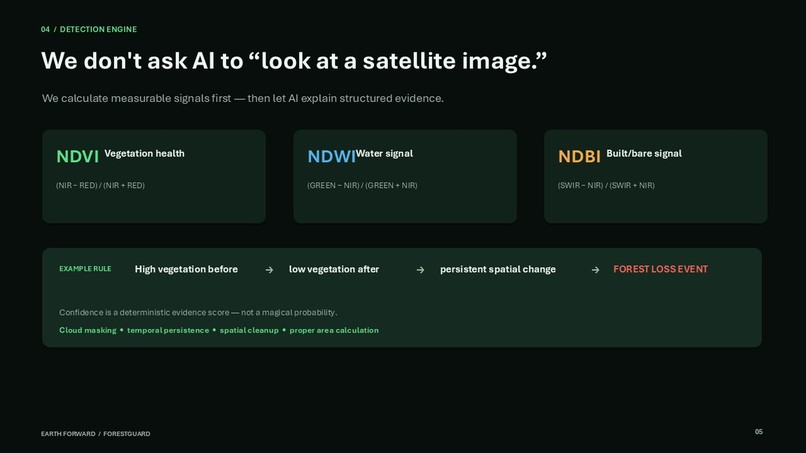
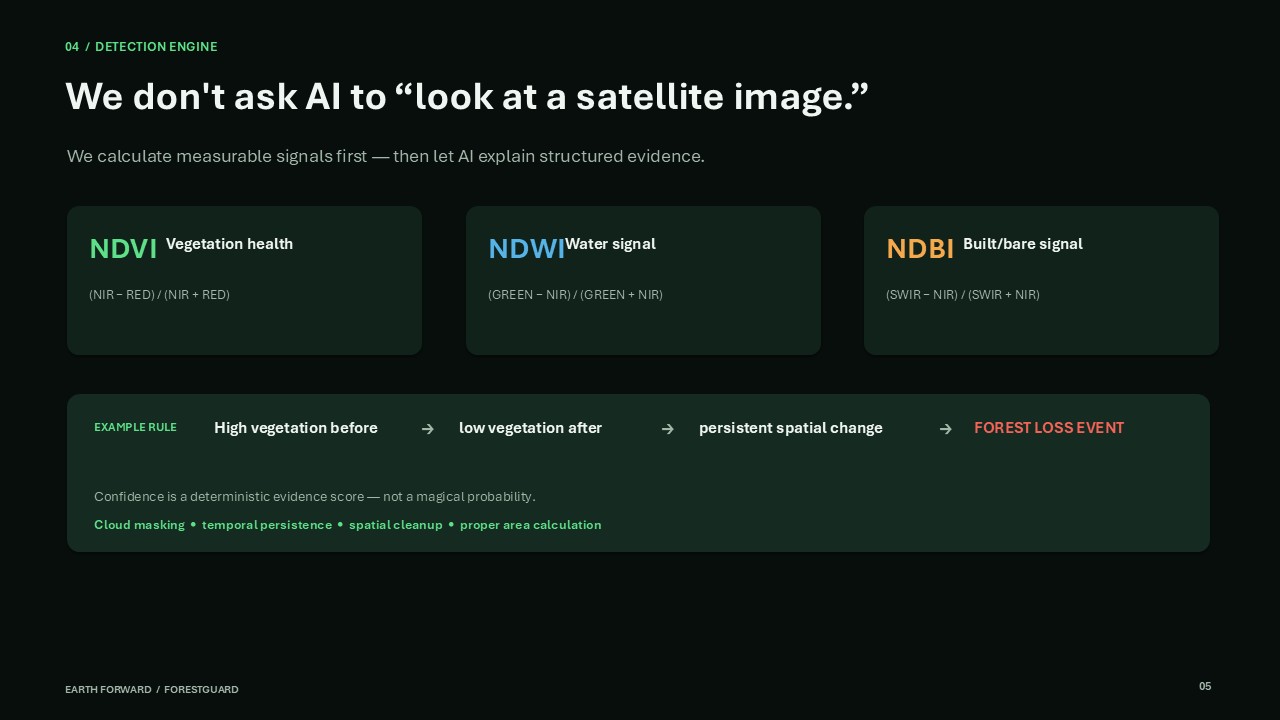
- Multi-Temporal Spectral Analysis: Compute pixel-level change masks across NDVI (vegetation health), MNDWI/NDWI (water extent), and NDBI (built/bare ground expansion)
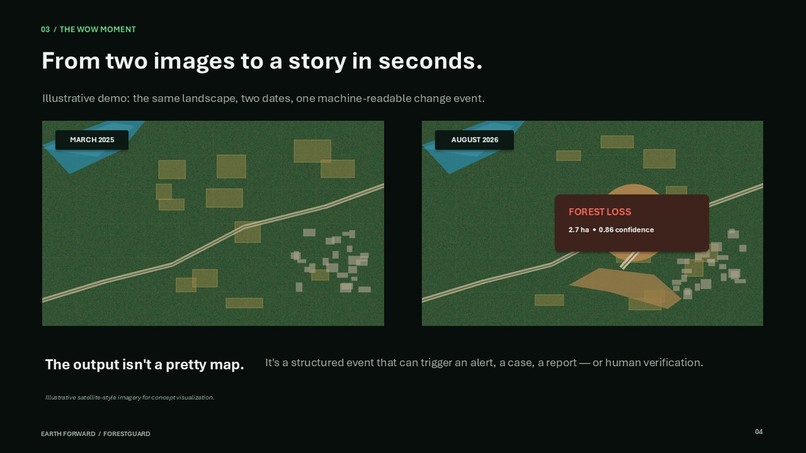
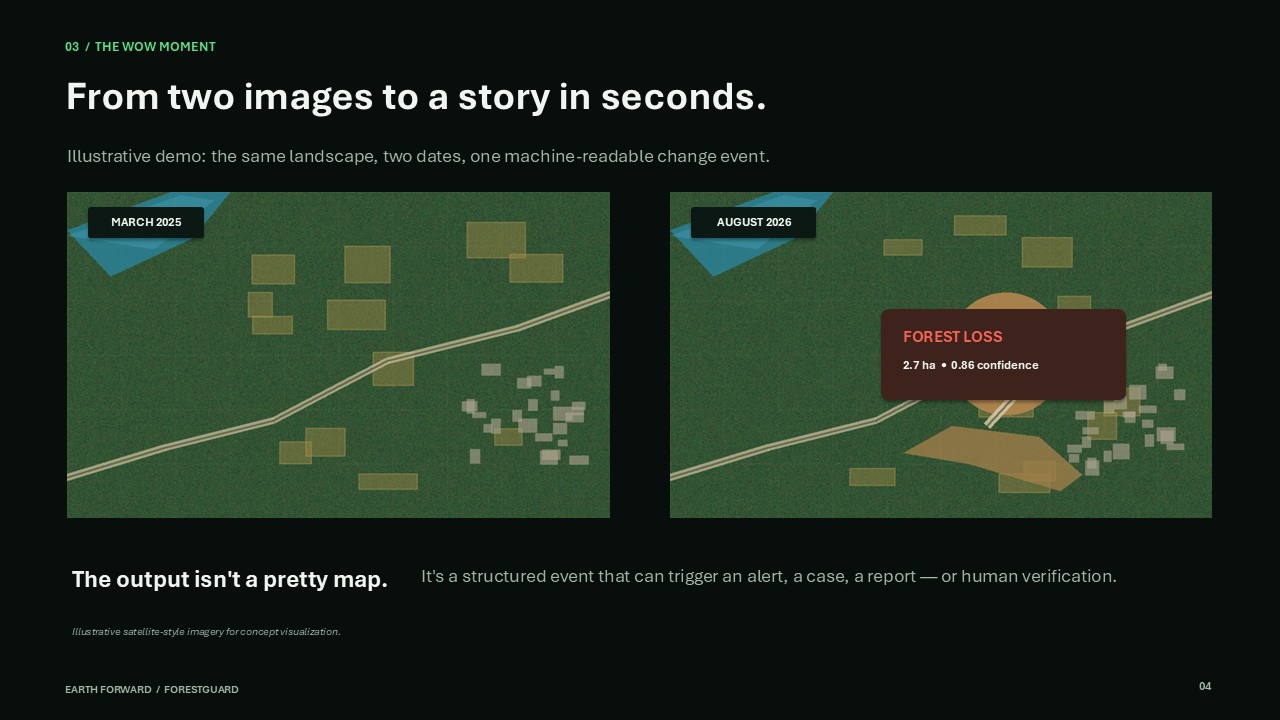
- Vectorized Hotspots: Convert raster change masks into GeoJSON polygons with geographic coordinates, centroids, and hectare-scale area measurements
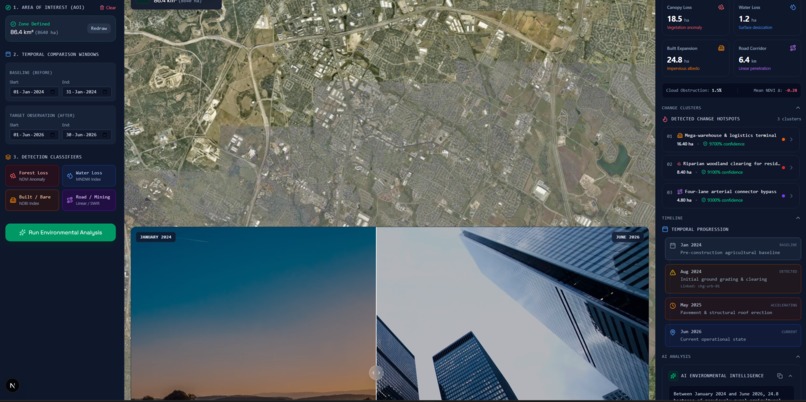
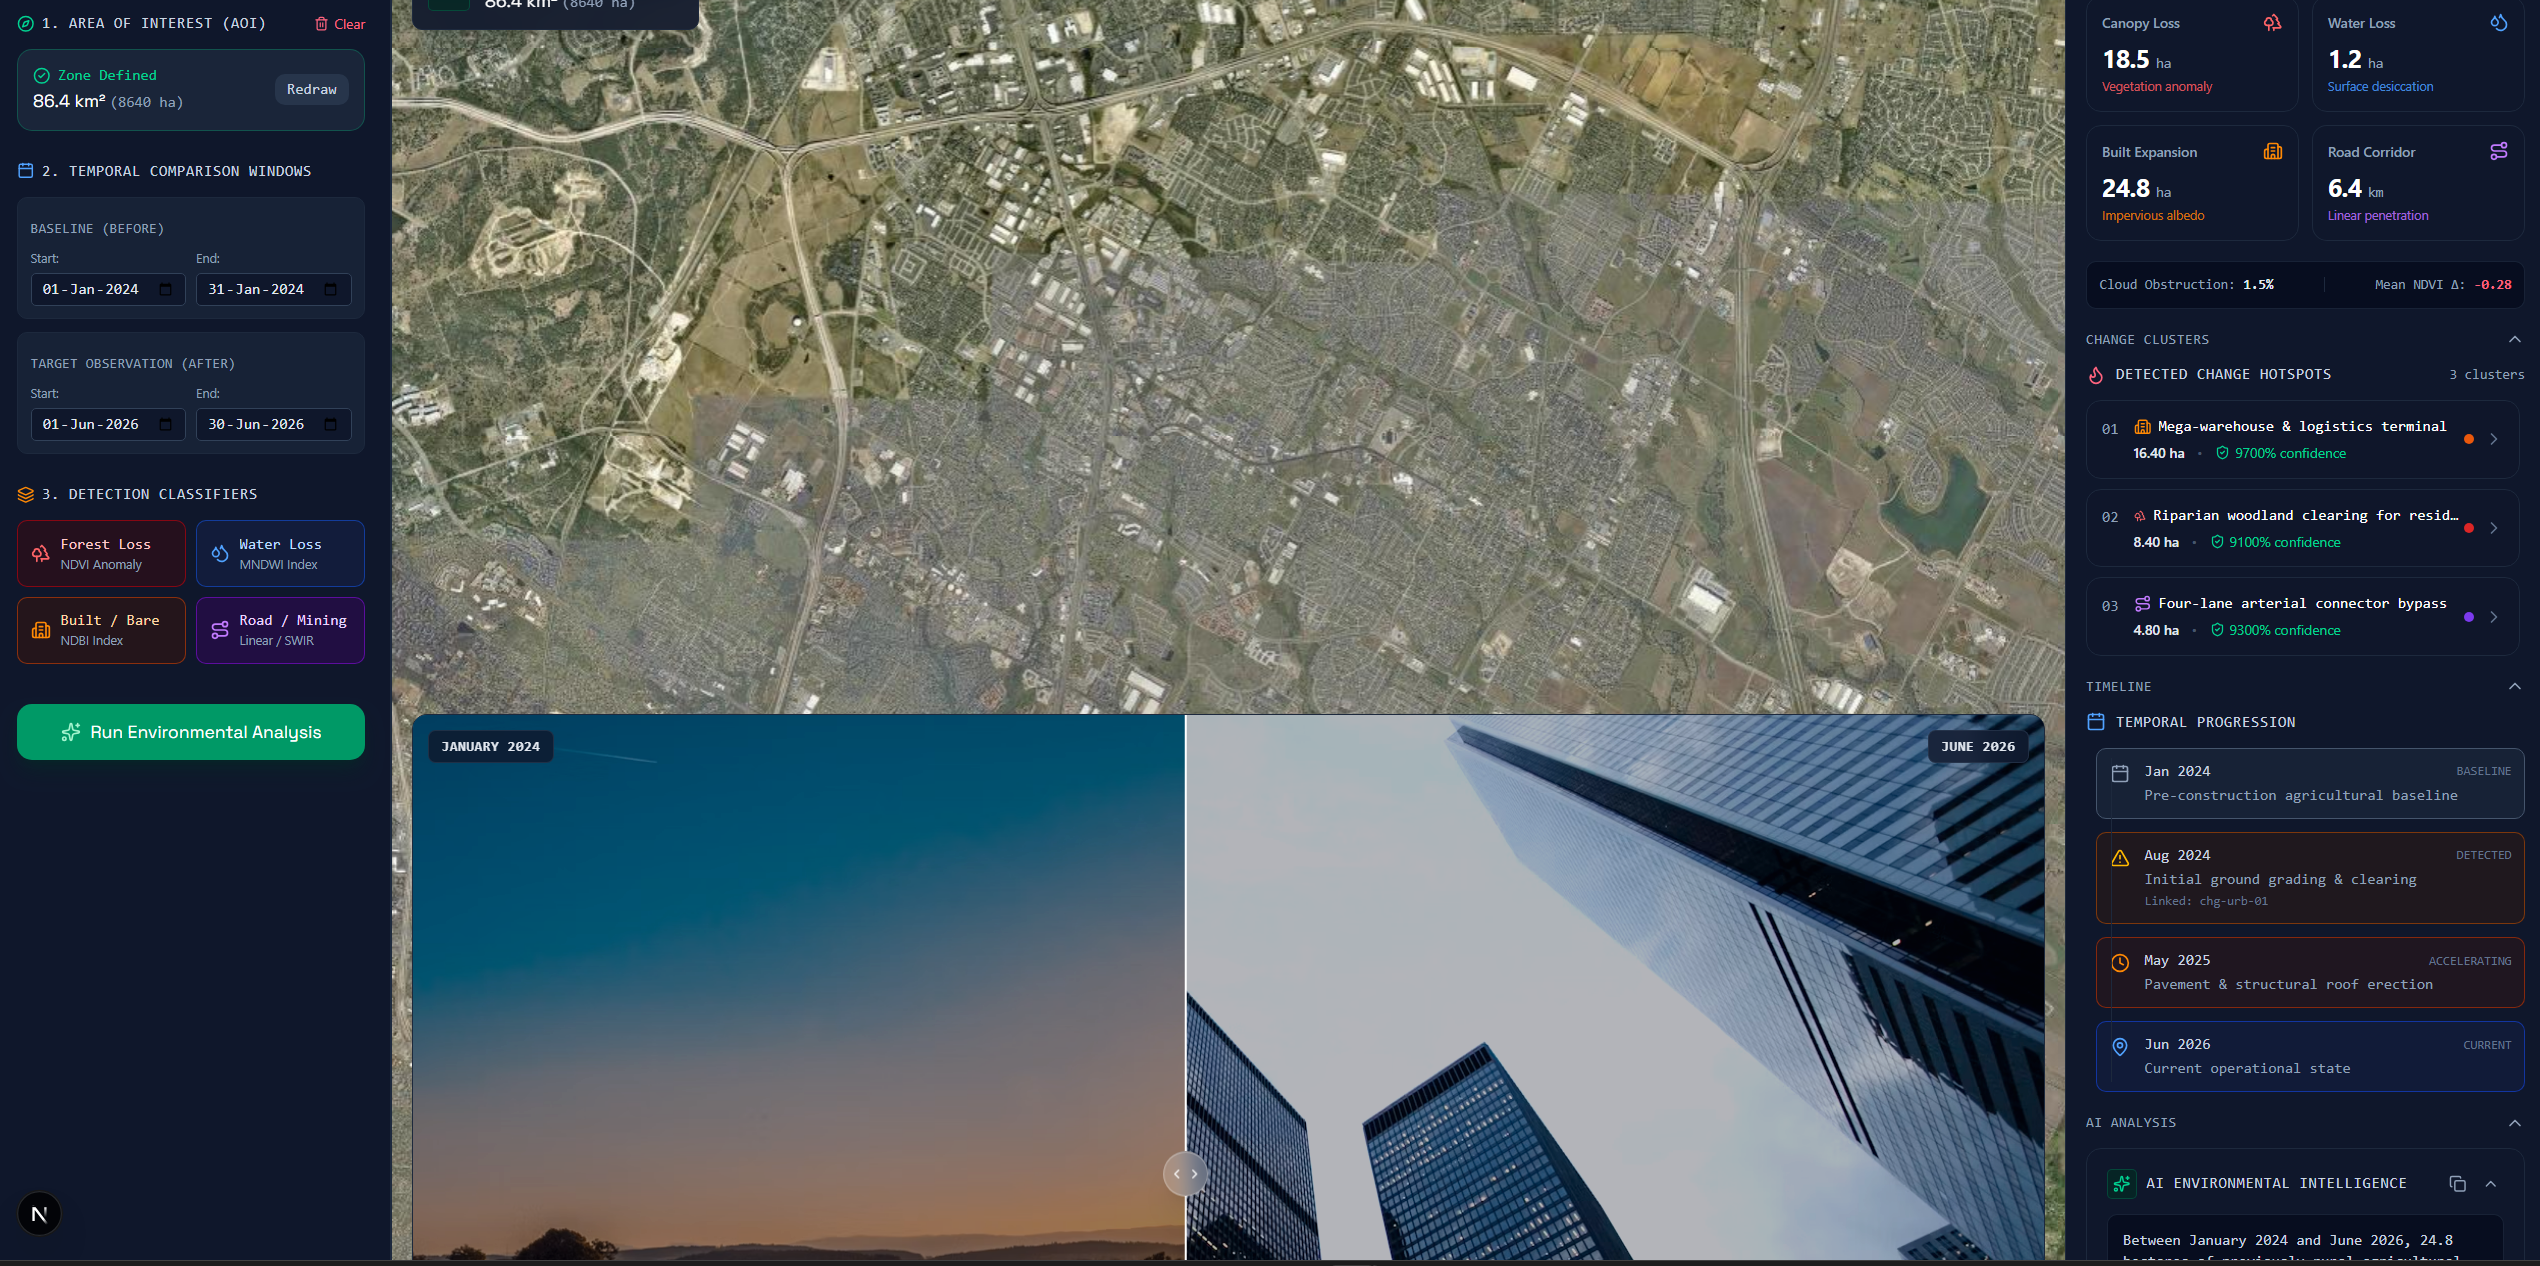
- Before/After Split Slider: Real-time interactive wipe comparison of satellite composites
- Chronological Timeline: Visualize historical NDVI trajectories, event severity, and state transitions
- AI-Powered Synthesis: Generate structured executive summaries grounded strictly in calculated metrics, not hallucinations
- Exportable Reports: Produce standalone HTML environmental audit reports with KPI breakdowns, change catalogs, and verification recommendations
- Offline Resilience: Graceful fallback to synthetic benchmark datasets when backend services or satellite APIs are unreachable
How We Built It
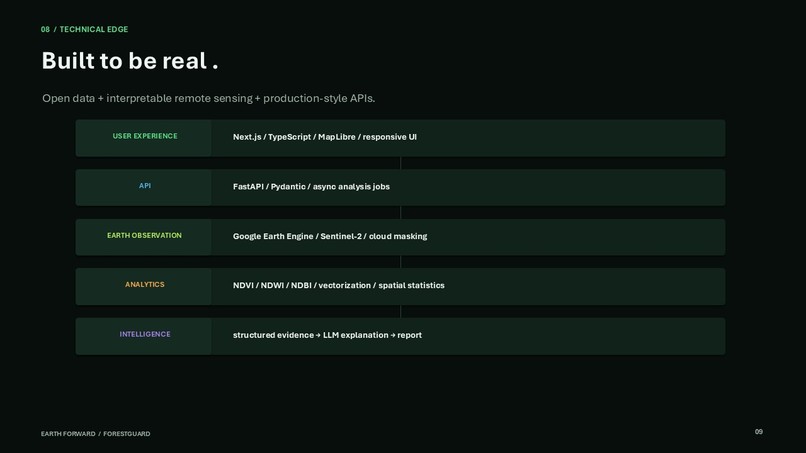
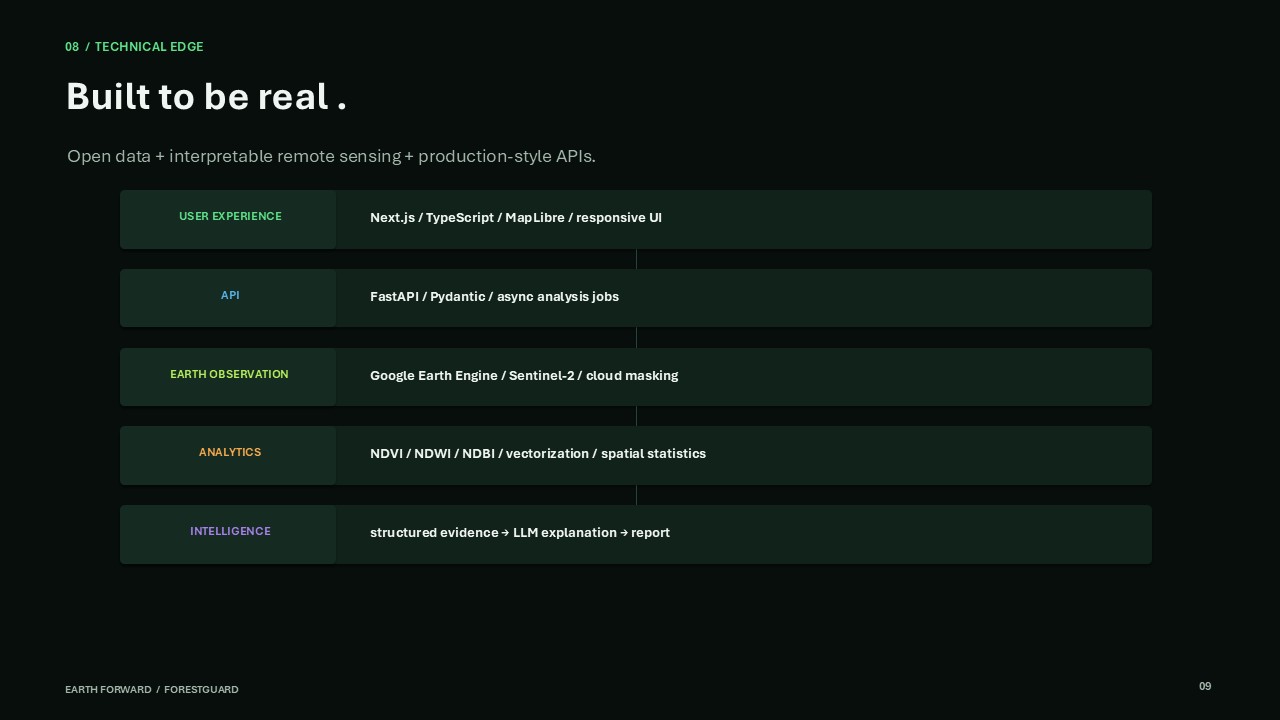
Tech Stack
Frontend:
- Next.js 16 (App Router, Turbopack) — Server-side rendering, file-based routing
- React 19 — Concurrent rendering, component architecture
- MapLibre GL — GPU-accelerated vector map rendering
- Tailwind CSS — Utility-first styling
- Lucide React — Icon set
Backend:
- FastAPI (Python 3.10+) — Async REST framework with automatic OpenAPI docs
- Pydantic v2 — Data validation and serialization
- NumPy / SciPy — Array operations, connected component labeling (
ndimage.label) - Shapely — Polygon geometry, area calculations, coordinate transformations
- Google Earth Engine — Sentinel-2 Surface Reflectance Harmonized imagery
- Gemini API — Structured JSON synthesis for environmental summaries
Geospatial Pipeline:
- Acquisition: Query Sentinel-2 SR Harmonized collection via Earth Engine, filter by AOI and date range
- Preprocessing: Cloud masking using QA60 band, median compositing to reduce atmospheric noise
- Index Computation: Calculate NDVI, MNDWI, NDWI, NDBI from spectral bands
- Temporal Differencing: Subtract baseline from target index arrays, apply adaptive thresholds
- Classification: Categorize pixels by change type (forest loss, water loss, built expansion)
- Vectorization: Convert raster masks to GeoJSON polygons using
scipy.ndimage.labeland Shapely polygonization - Summarization: Compute area statistics, generate AI synthesis, assemble HTML report
Challenges We Ran Into
1. Cloud Masking Reliability
Sentinel-2's QA60 cloud band is binary and often misses thin cirrus or bright surfaces. We implemented a composite approach: QA60 masking + NDVI outlier filtering + median compositing across the date window. This reduced false positives but introduced latency. Future work: integrate s2cloudless for probabilistic cloud scoring.
2. Vectorization of Noisy Raster Masks
Raw change masks contain scattered pixels and jagged boundaries. Direct polygonization produced thousands of tiny polygons. We added morphological opening/closing and minimum area filtering. The trade-off: smaller clearings may be missed. We expose min_mapping_area_ha as a configurable threshold.
3. Earth Engine Authentication in Production
Service account authentication requires a private key file and project ID. We couldn't hardcode credentials. Solution: environment variable injection at runtime, with graceful fallback to mock provider if auth fails. Local development uses gcloud application-default credentials when available.
4. LLM Hallucination in Summaries
Initial prompts produced confident but fabricated statistics ("Approximately 340 hectares of primary forest..."). We switched to strict grounding: pass only computed metrics to the prompt, instruct the model to respond with JSON matching an exact schema, and validate the response with Pydantic. If synthesis fails, we fall back to template-based summaries derived directly from statistics.
5. Frontend Map Performance with Large GeoJSON
Early versions loaded full-resolution change polygons (10k+ vertices). MapLibre choked on zoom/pan. We implemented server-side simplification using Shapely's simplify() with topology preservation, plus client-side GeoJSON source updates only when the analysis changes.
Accomplishments That We're Proud Of
- End-to-End Pipeline: From raw Sentinel-2 pixels to styled GeoJSON overlay to AI summary in under 60 seconds for typical AOIs
- Graceful Degradation: The entire system works offline with synthetic data — no external dependencies required for demo or testing
- Structured AI Output: Gemini generates strictly validated JSON, eliminating hallucinated metrics
- Interactive Before/After Slider: Real-time wipe comparison without regenerating composites
- Hectare-Scale Measurements: Change polygons include computed geographic area using Shapely's geodesic area calculation (correct for non-projected coordinates)
- Test Coverage: Backend unit tests for change detection algorithms and API endpoints
What We Learned
- Remote Sensing is Noisy: Satellite data is messy. Clouds, sensor artifacts, atmospheric scattering, and seasonal variation all confound simple differencing. Robust change detection requires multi-step pipelines and careful thresholding.
- UX Matters for Technical Tools: A powerful geospatial backend is useless if only GIS experts can operate it. We invested heavily in the draw-polygon UI, split-slider interaction, and one-click benchmark sites.
- LLMs Need Scaffolding: Unstructured prompts produce unreliable outputs for quantitative tasks. Schema-validated JSON generation with explicit constraints ("respond with only valid JSON") dramatically improves reliability.
- Mock Data is Undervalued: Building a realistic synthetic provider upfront accelerated frontend development and allowed testing without hitting Earth Engine rate limits.
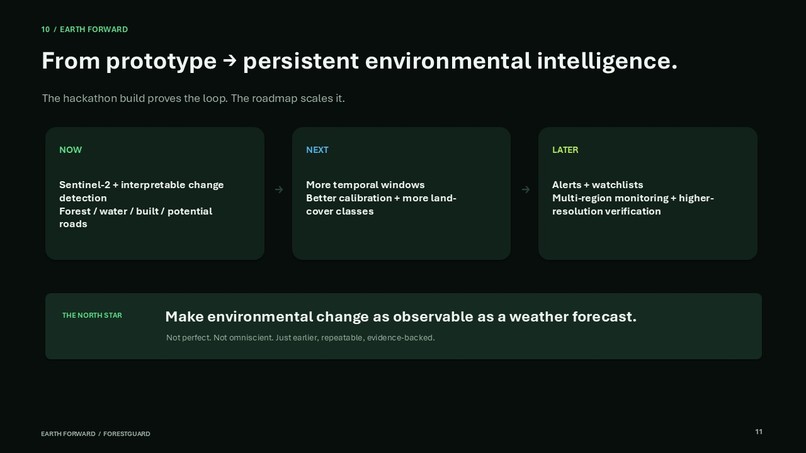
What's Next
Short-Term
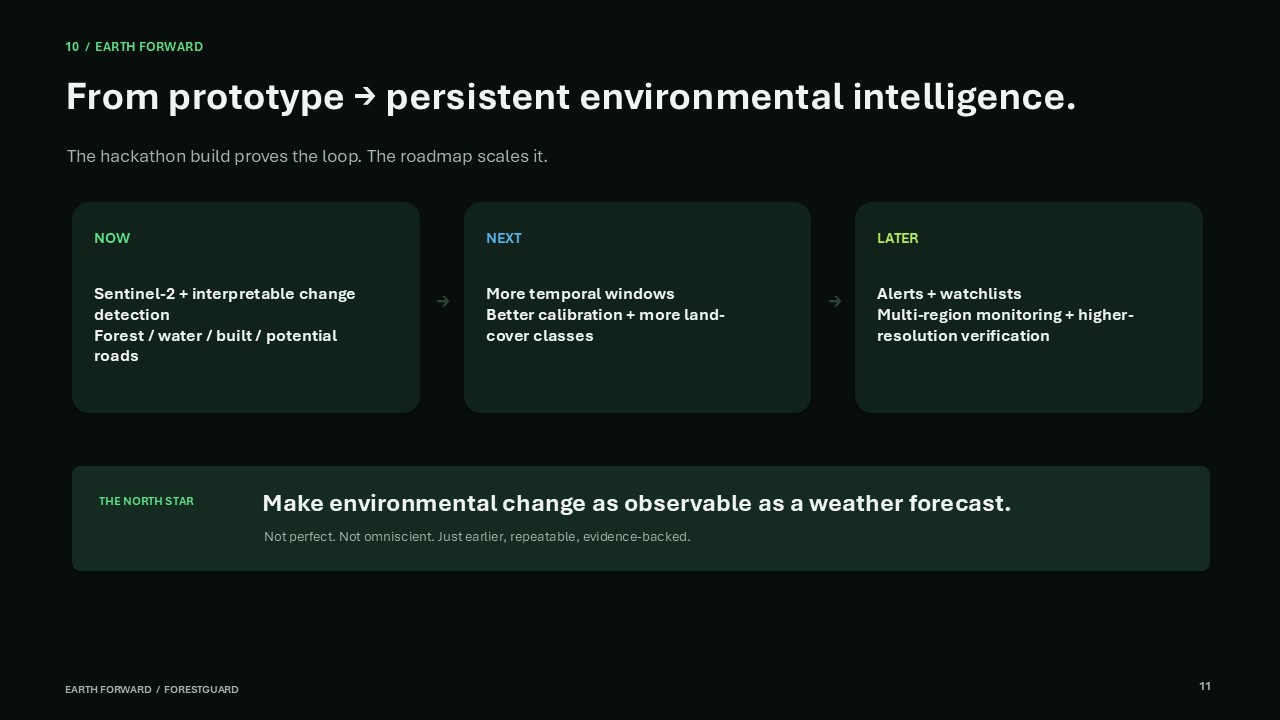
- Time-Series Analysis: Extend beyond two-date comparison to full temporal series (e.g., 12-month NDVI trends)
- Alert System: Notify users when change exceeds configurable thresholds in monitored AOIs
- User Accounts: Save AOI configurations and analysis history to a database
- Export Formats: GeoPackage, Shapefile, and PDF report generation in addition to HTML
Medium-Term
- Additional Sensors: Integrate Landsat 8/9 for historical depth, Sentinel-1 SAR for cloud-penetrating observation
- Mobile App: Field verification companion app with GPS-tagged photo uploads
- Multi-Language Support: Localize UI and AI summaries for regional NGOs and government agencies
- API Access: Expose backend as a public API for third-party integrations
Long-Term
- Machine Learning Classification: Train semantic segmentation models on labeled change data to improve detection accuracy
- Planetary Scale: Deploy on cloud infrastructure with auto-scaling to handle continental-scale monitoring
- Partnerships: Collaborate with conservation organizations to deploy real-world monitoring programs
Try It Locally
# Backend
cd backend
python -m venv .venv
source .venv/bin/activate  # Windows: .venv\Scripts\Activate.ps1
pip install -e .
uvicorn app.main:app --reload --port 8000

# Frontend (new terminal)
npm install
npm run dev
Open http://localhost:3000 and click "Launch Monitor."
Try out the hosted version (MOCK backend)- https://forestguard-ashy.vercel.app/
License
MIT License. See LICENSE for details.
Built with Next.js, FastAPI, Google Earth Engine, Gemini API, MapLibre GL, NumPy, SciPy, Shapely, and Tailwind CSS.
Built for the rangers, researchers, and communities protecting our planet's forests and waters.
Built With
- fastapi
- google-earth
- next.js
- python
- scikit


Log in or sign up for Devpost to join the conversation.