Inspiration
The inspiration for Foresight comes from the need for accessible and practical natural hazard education in an era defined by escalating climate risk.
- Climate-related disasters now cause over 90% of major global hazards
- True annual costs surpass $2.3 trillion when accounting for long-term economic and environmental disruption
- Understanding and preparing for these risks has become essential for everyone
While all communities face growing threats, the most vulnerable populations are disproportionately affected when information is not available. This includes nations like the Philippines and Bangladesh, as well as individuals with fewer resources.
This knowledge gap is critical for anyone in a high-risk zone or relocating to a new area, as a lack of awareness can lead to severe financial and personal losses from a single disaster.
Foresight directly bridges this gap. By providing clear, location-based information on hazards and actionable preparedness strategies, we equip every user with the knowledge to understand their specific risks, safeguard their homes, and build true resilience for an uncertain future.
What It Does
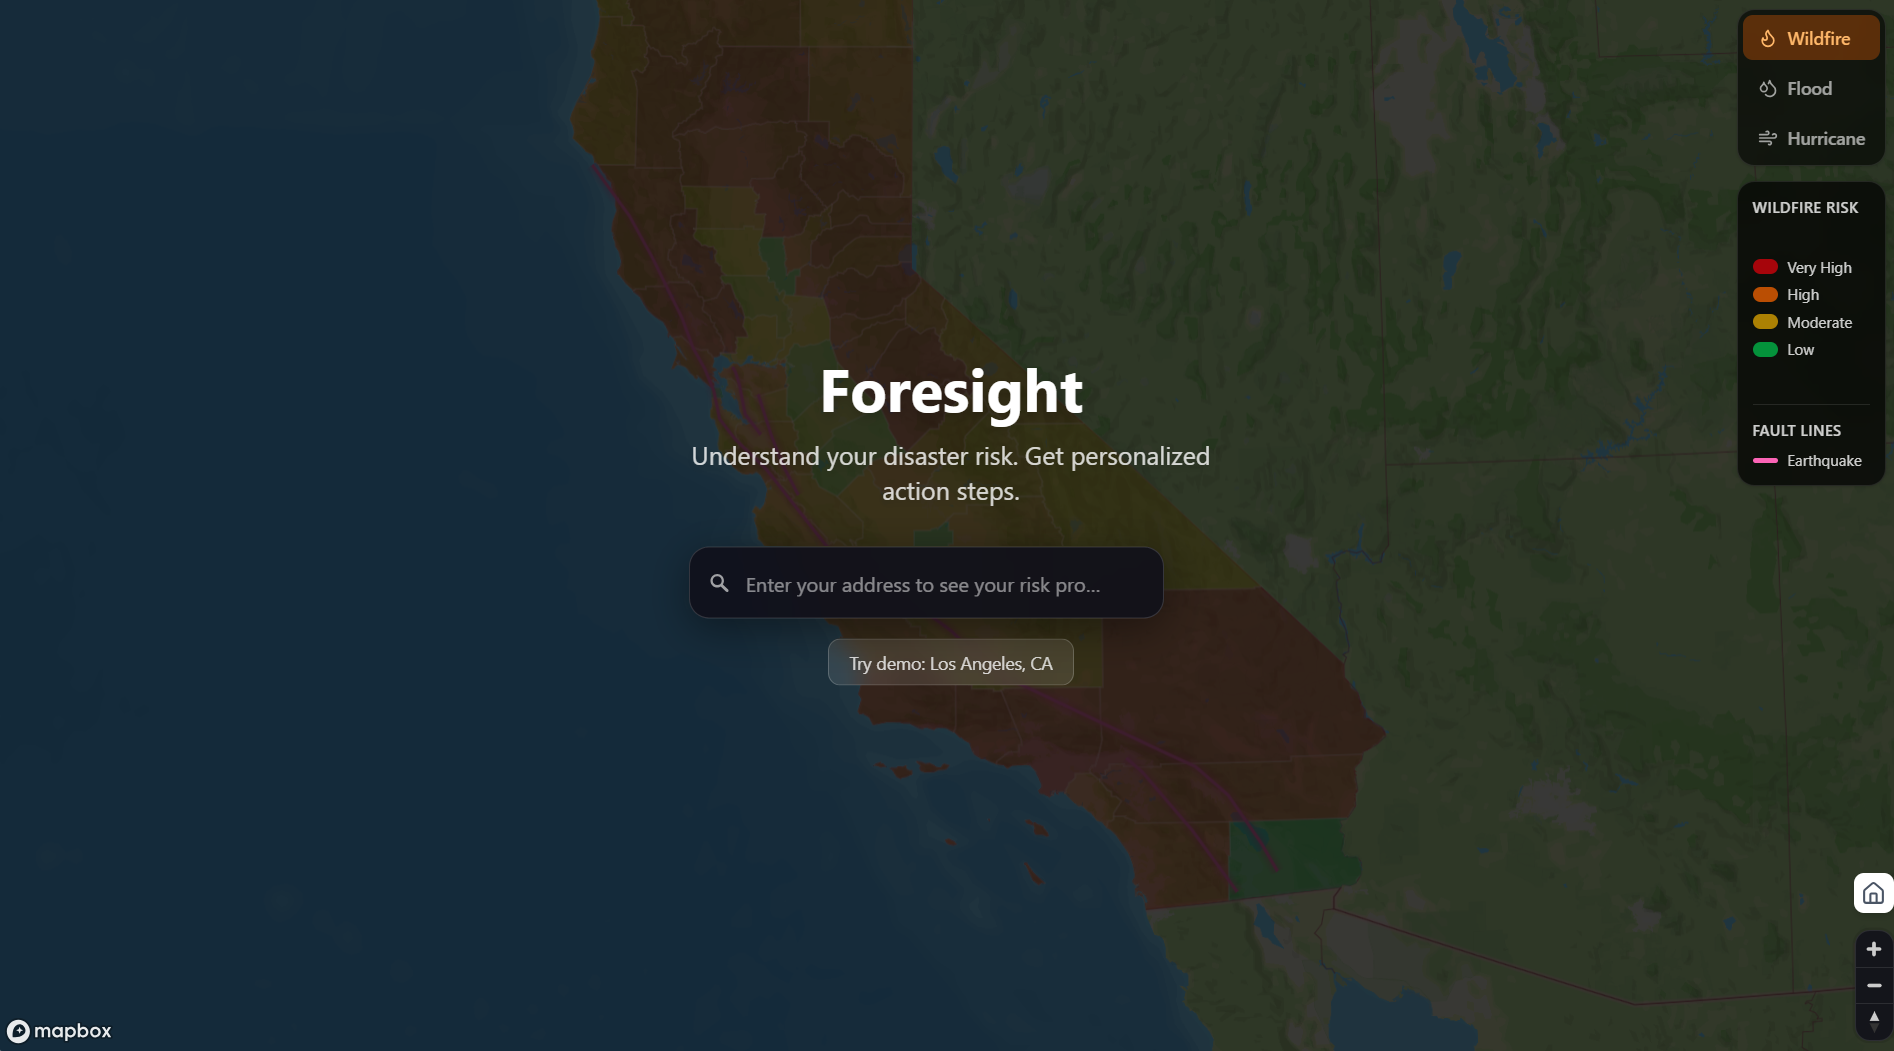
Foresight is an interactive map created to view and plan for natural disasters your home might face.
Data-Driven Risk Assessment:
- Pulls data from FEMA, USGS, and Cal Fire
- Creates an intuitive, color-coded risk map
- Type in any address to see ratings for wildfires, floods, earthquakes, and more
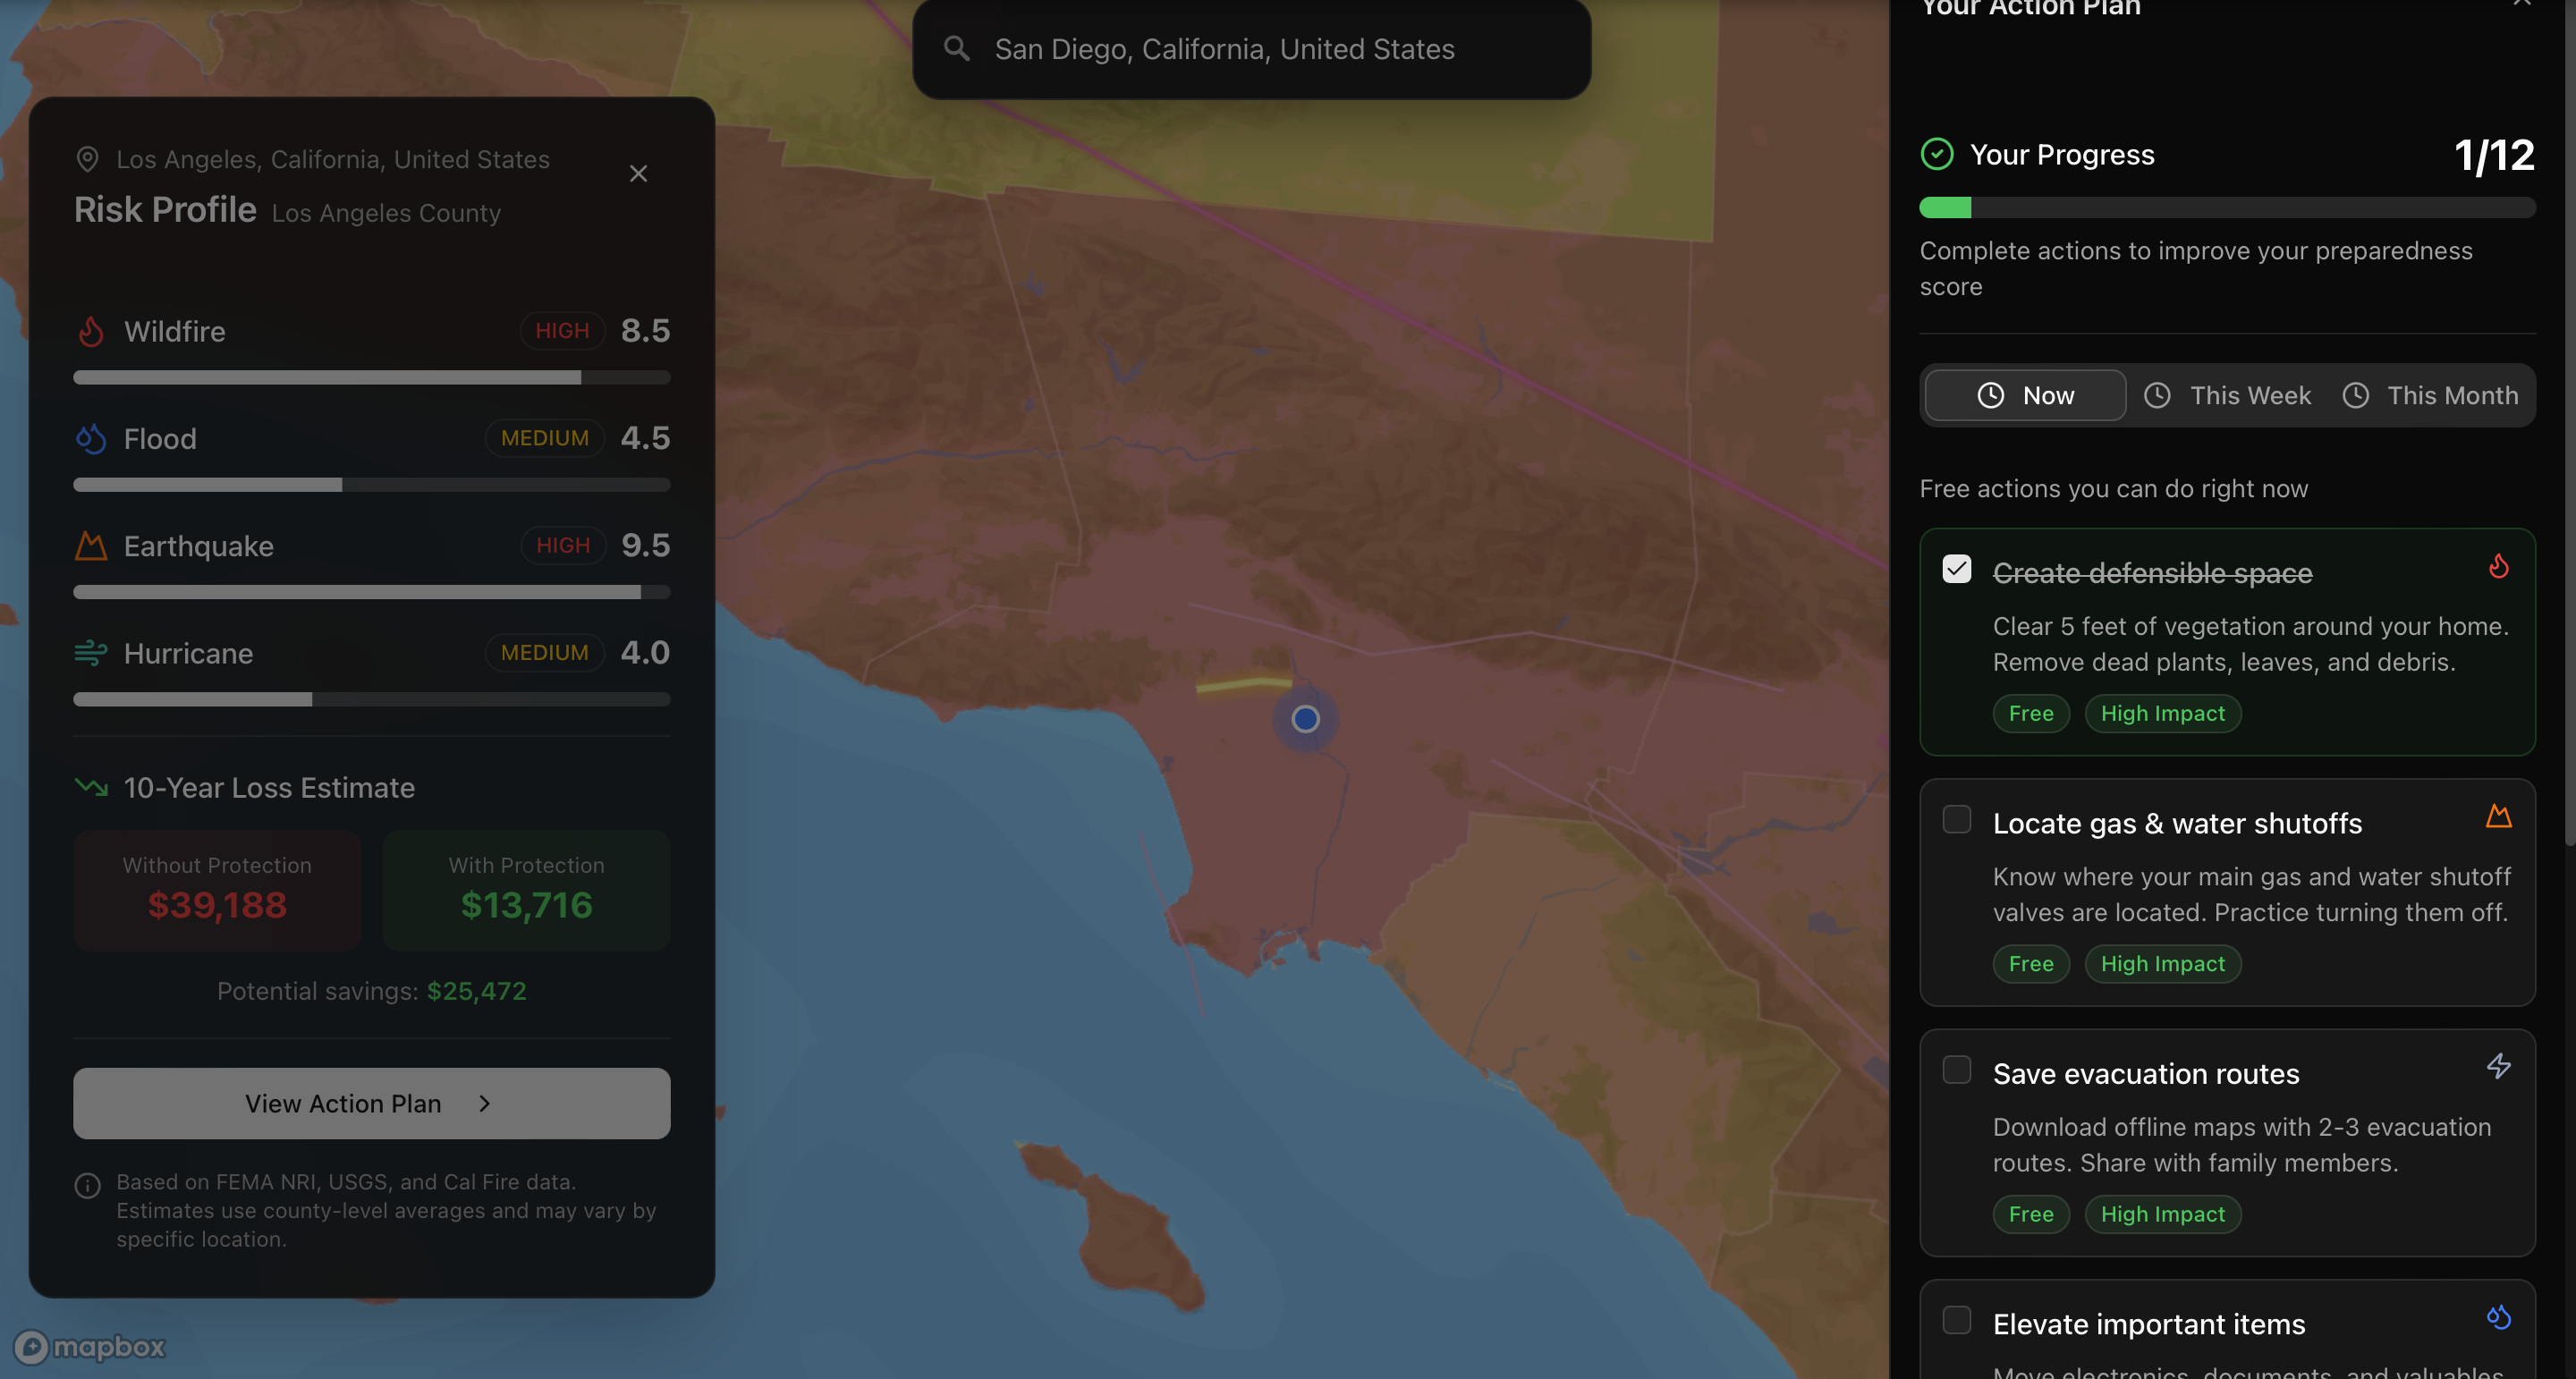
Personalized Action Plans:
- Based on your chosen area and historical statistics
- Breakdown of easy steps you can take right now
- Long-term prevention strategies
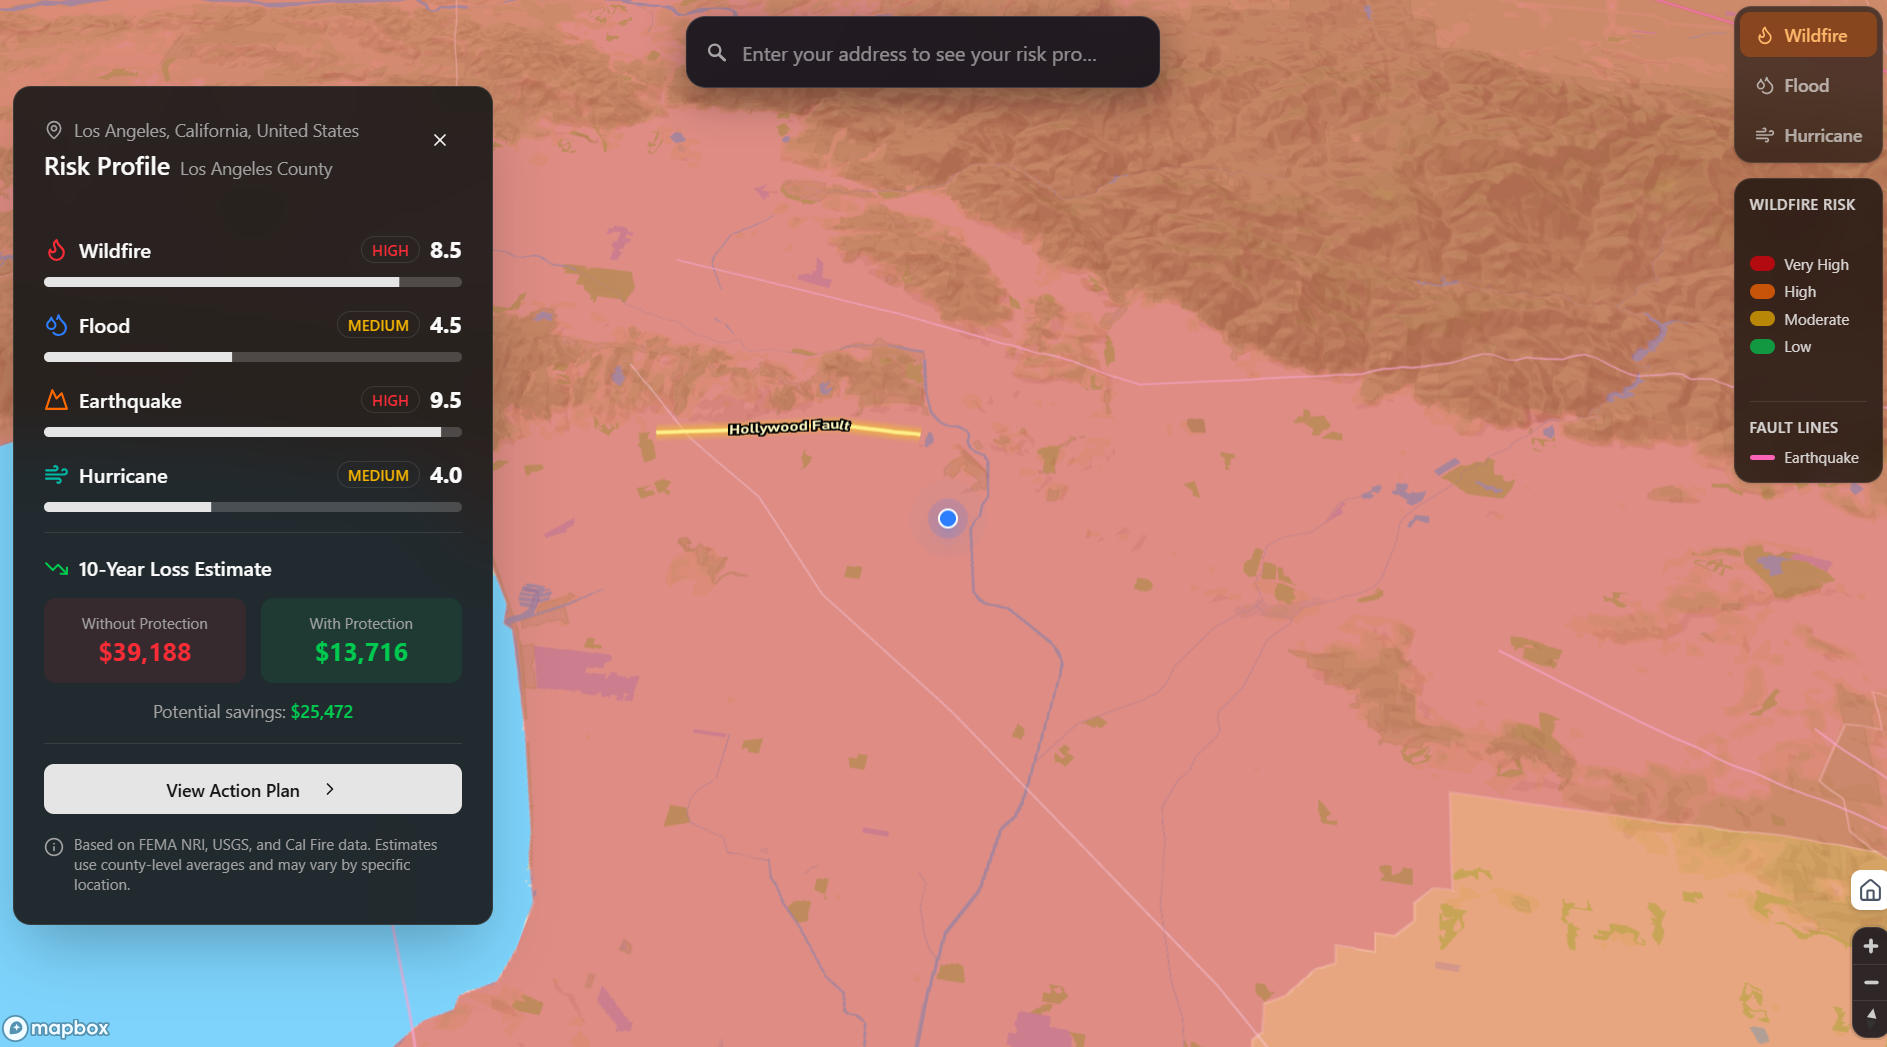
Real-World Stakes:
- Simple comparison of potential damage costs vs. money saved by being prepared
- Integrates visual insights and preparation strategies to help you protect what matters most
How We Built It
Foresight is built with Next.js 15 using the App Router and TypeScript for type safety. The UI is styled with Tailwind CSS and shadcn/ui components.
For mapping, we use Mapbox GL JS via react-map-gl to render an interactive 3D terrain map with multiple risk overlay layers. County boundaries and fault lines are stored as GeoJSON and rendered dynamically based on the selected risk type.
Turf.js powers our geospatial calculations:
- Point-in-polygon detection identifies which county the user is located in
- Nearest-point-on-line calculations determine distance to the closest fault line
- Distance measurements are converted to miles for intuitive display
Risk scores are pulled from county-level FEMA National Risk Index data, then adjusted based on proximity to fault lines (using USGS data), fire hazard severity zones (Cal Fire), and flood zones. The final scores are normalized to a 0 to 10 scale with clear risk level indicators.
| Data | Source |
|---|---|
| County Risk Scores | FEMA National Risk Index |
| Fault Lines | USGS Quaternary Fault Database |
| Fire Hazard Zones | Cal Fire FHSZ |
| Flood Zones | FEMA National Flood Hazard Layer |
All calculations run client-side with no backend server required. No user data is stored.
Challenges We Ran Into
Design Challenge
Creating an intuitive and accessible user experience from inherently complex and technical data.
Our core mission was making hazard maps and risk assessments understandable to everyone. This required us to think deeply about design:
- Experimented with color schemes to ensure visual distinction for different disaster types
- Ensured universal interpretability (for example, avoiding red-green reliance)
- Iterated on map shading, boundary shapes, and overlay transparency
- Presented multiple risk layers without overwhelming the user
Technical Challenge
Validating the app's accuracy:
- Manually reviewed risk outputs for 5+ distinct locations in California
- Cross-referenced findings with official FEMA and Cal Fire documentation
- Ensured backend data extraction and processing logic correctly translated raw data into reliable insights
The goal: Build trust by ensuring our clean, visual story of risk was not only clear but also scientifically precise.
Accomplishments We're Proud Of
- Successfully designed and launched an interactive platform that transforms complex government data from FEMA, USGS, and Cal Fire into clear, visual risk maps and personalized action plans
- Rigorously tested and validated our system across multiple locations
- Built a tool that is both reliable and highly accessible
- Created a practical solution that encourages individuals to understand their local hazards and take informed steps toward preparedness
What We Learned
The development of Foresight allowed us to gain an understanding in addressing a critical societal gap: the inaccessibility of life-saving and harm-reducing hazard information.
We learned to deeply analyze the root causes of this problem:
- Complex data hidden in government portals
- Lack of personalized guidance
- Visualizations that were technical but not actionable
This understanding directly shaped our mission to transform expert-level risk data into clear, visually intuitive maps and plain-language action plans anyone can use.
Key takeaways:
- Technical skill must be guided by a commitment to democratizing information
- Honed the ability to synthesize multi-source scientific data
- Design for clarity over complexity
- Validate tools against real-world scenarios to ensure reliability
Ultimately, we learned that true impact lies not just in building an app, but in bridging the gap between public data and public understanding.
What's Next for Foresight
Looking ahead, Foresight is evolving into a fully global resource for destruction prevention in response to worldwide natural disasters.
Globalization
Our next major step is expanding our map library and underlying databases to access countries and regions worldwide.
Why this matters:
- Reach more underprivileged communities
- These communities are often the most vulnerable to destruction caused by natural disasters
- They have the fewest resources to prepare
Localized Solutions
Anyone, whether they are in Hamilton or Tokyo, will be able to visually assess their local risks using the same trusted, data-driven maps.
Our platform will contextualize solutions based on user location, providing culturally relevant suggestions for preventative measures determined by:
- Government legislation or regulations
- Local companies or organizations
- Local infrastructure
Our aim: Incentivize a global community with the foresight to plan, prepare, and protect what matters most, their home.
Built With
- geojson
- javascript
- mapbox
- next.js
- tailwind
- turf.js
- typescript