
Inspiration
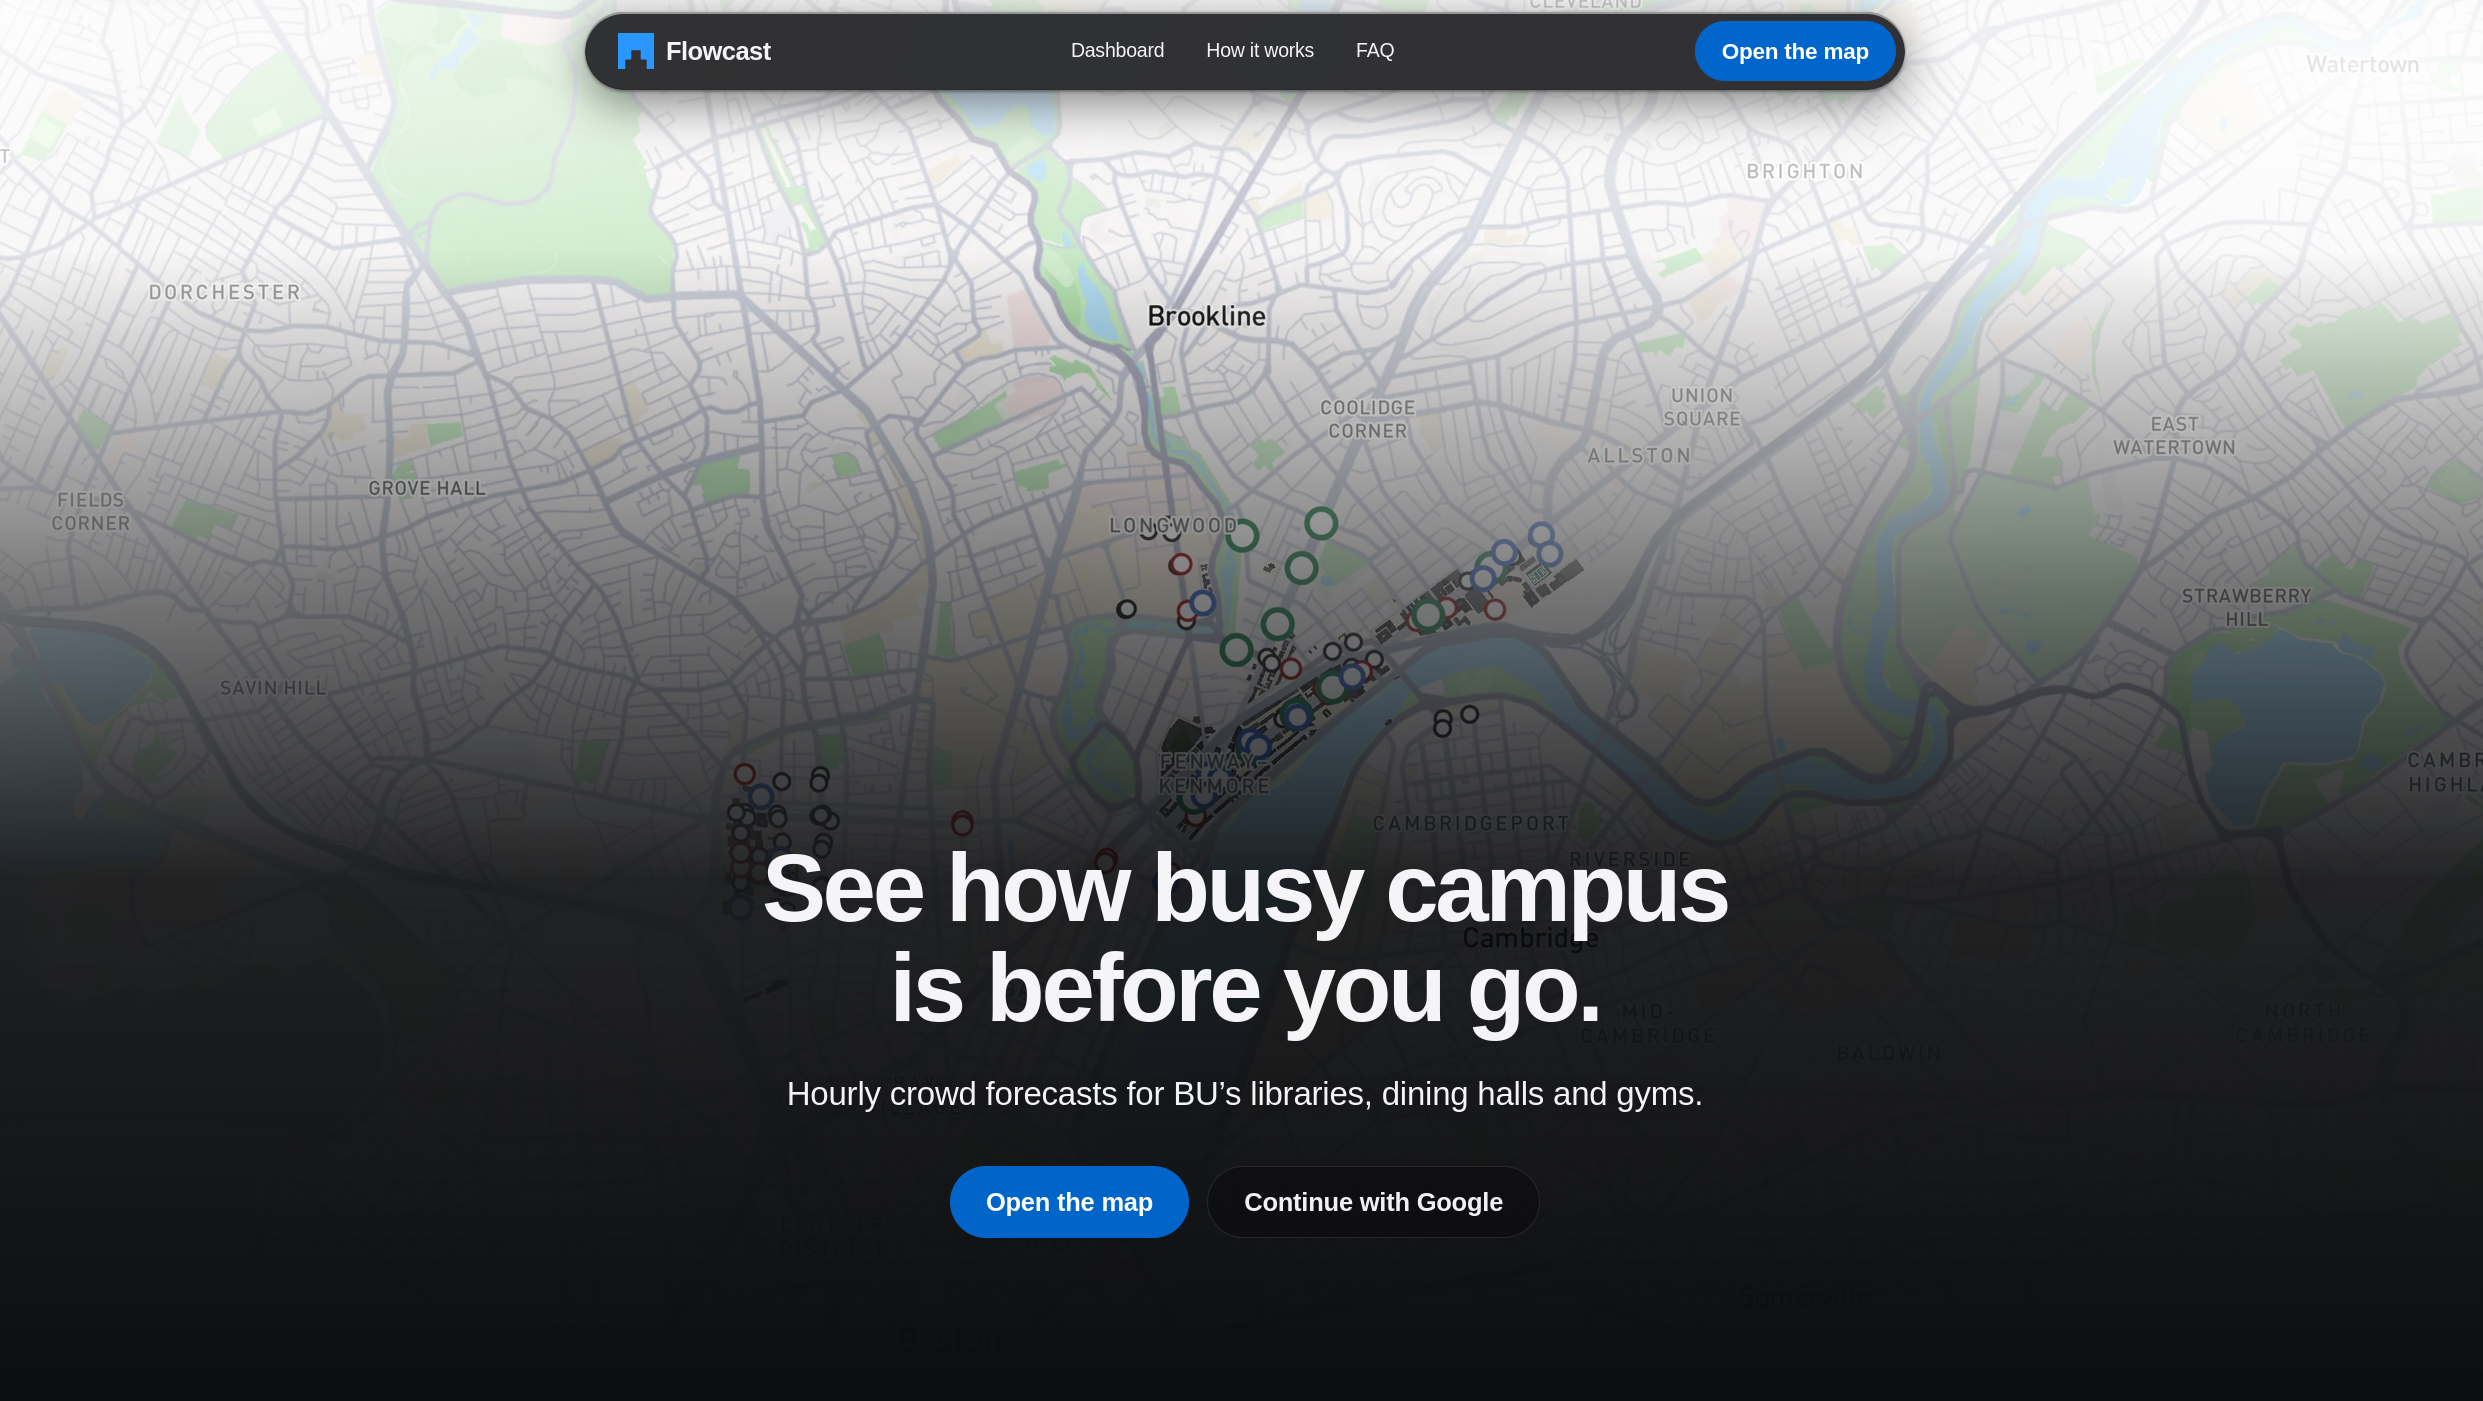
Finding out what's happening at BU means checking ten different places: Instagram, club WhatsApp groups, Terrier Central, club websites, dining and library pages, and the MBTA app. Most students don't bother, and they miss things. We wanted one place that tells you three things: what's happening on campus, where it's busy and where it's quiet, and where things are at BU.
Boston University is a small city: about 48,000 people share the same sidewalks, dining halls, libraries and Green Line stops. Everyone knows the 12:20 lunch rush at Warren, the library that fills up the week before midterms, and the crush on Comm Ave between classes. But nobody can see it coming.
The data to predict it is already public. It's just scattered across dozens of BU pages: class schedules, classroom seat counts, dining and library hours, residence-hall capacities, event listings and MBTA timetables. We asked a simple question: what if we put all of it together and simulated the whole campus? For students with anxiety, sensory sensitivities or mobility needs, knowing where it's quiet can decide whether they go at all. For safety staff and event planners, knowing where thousands of people will be is the starting point for every decision.
What it does
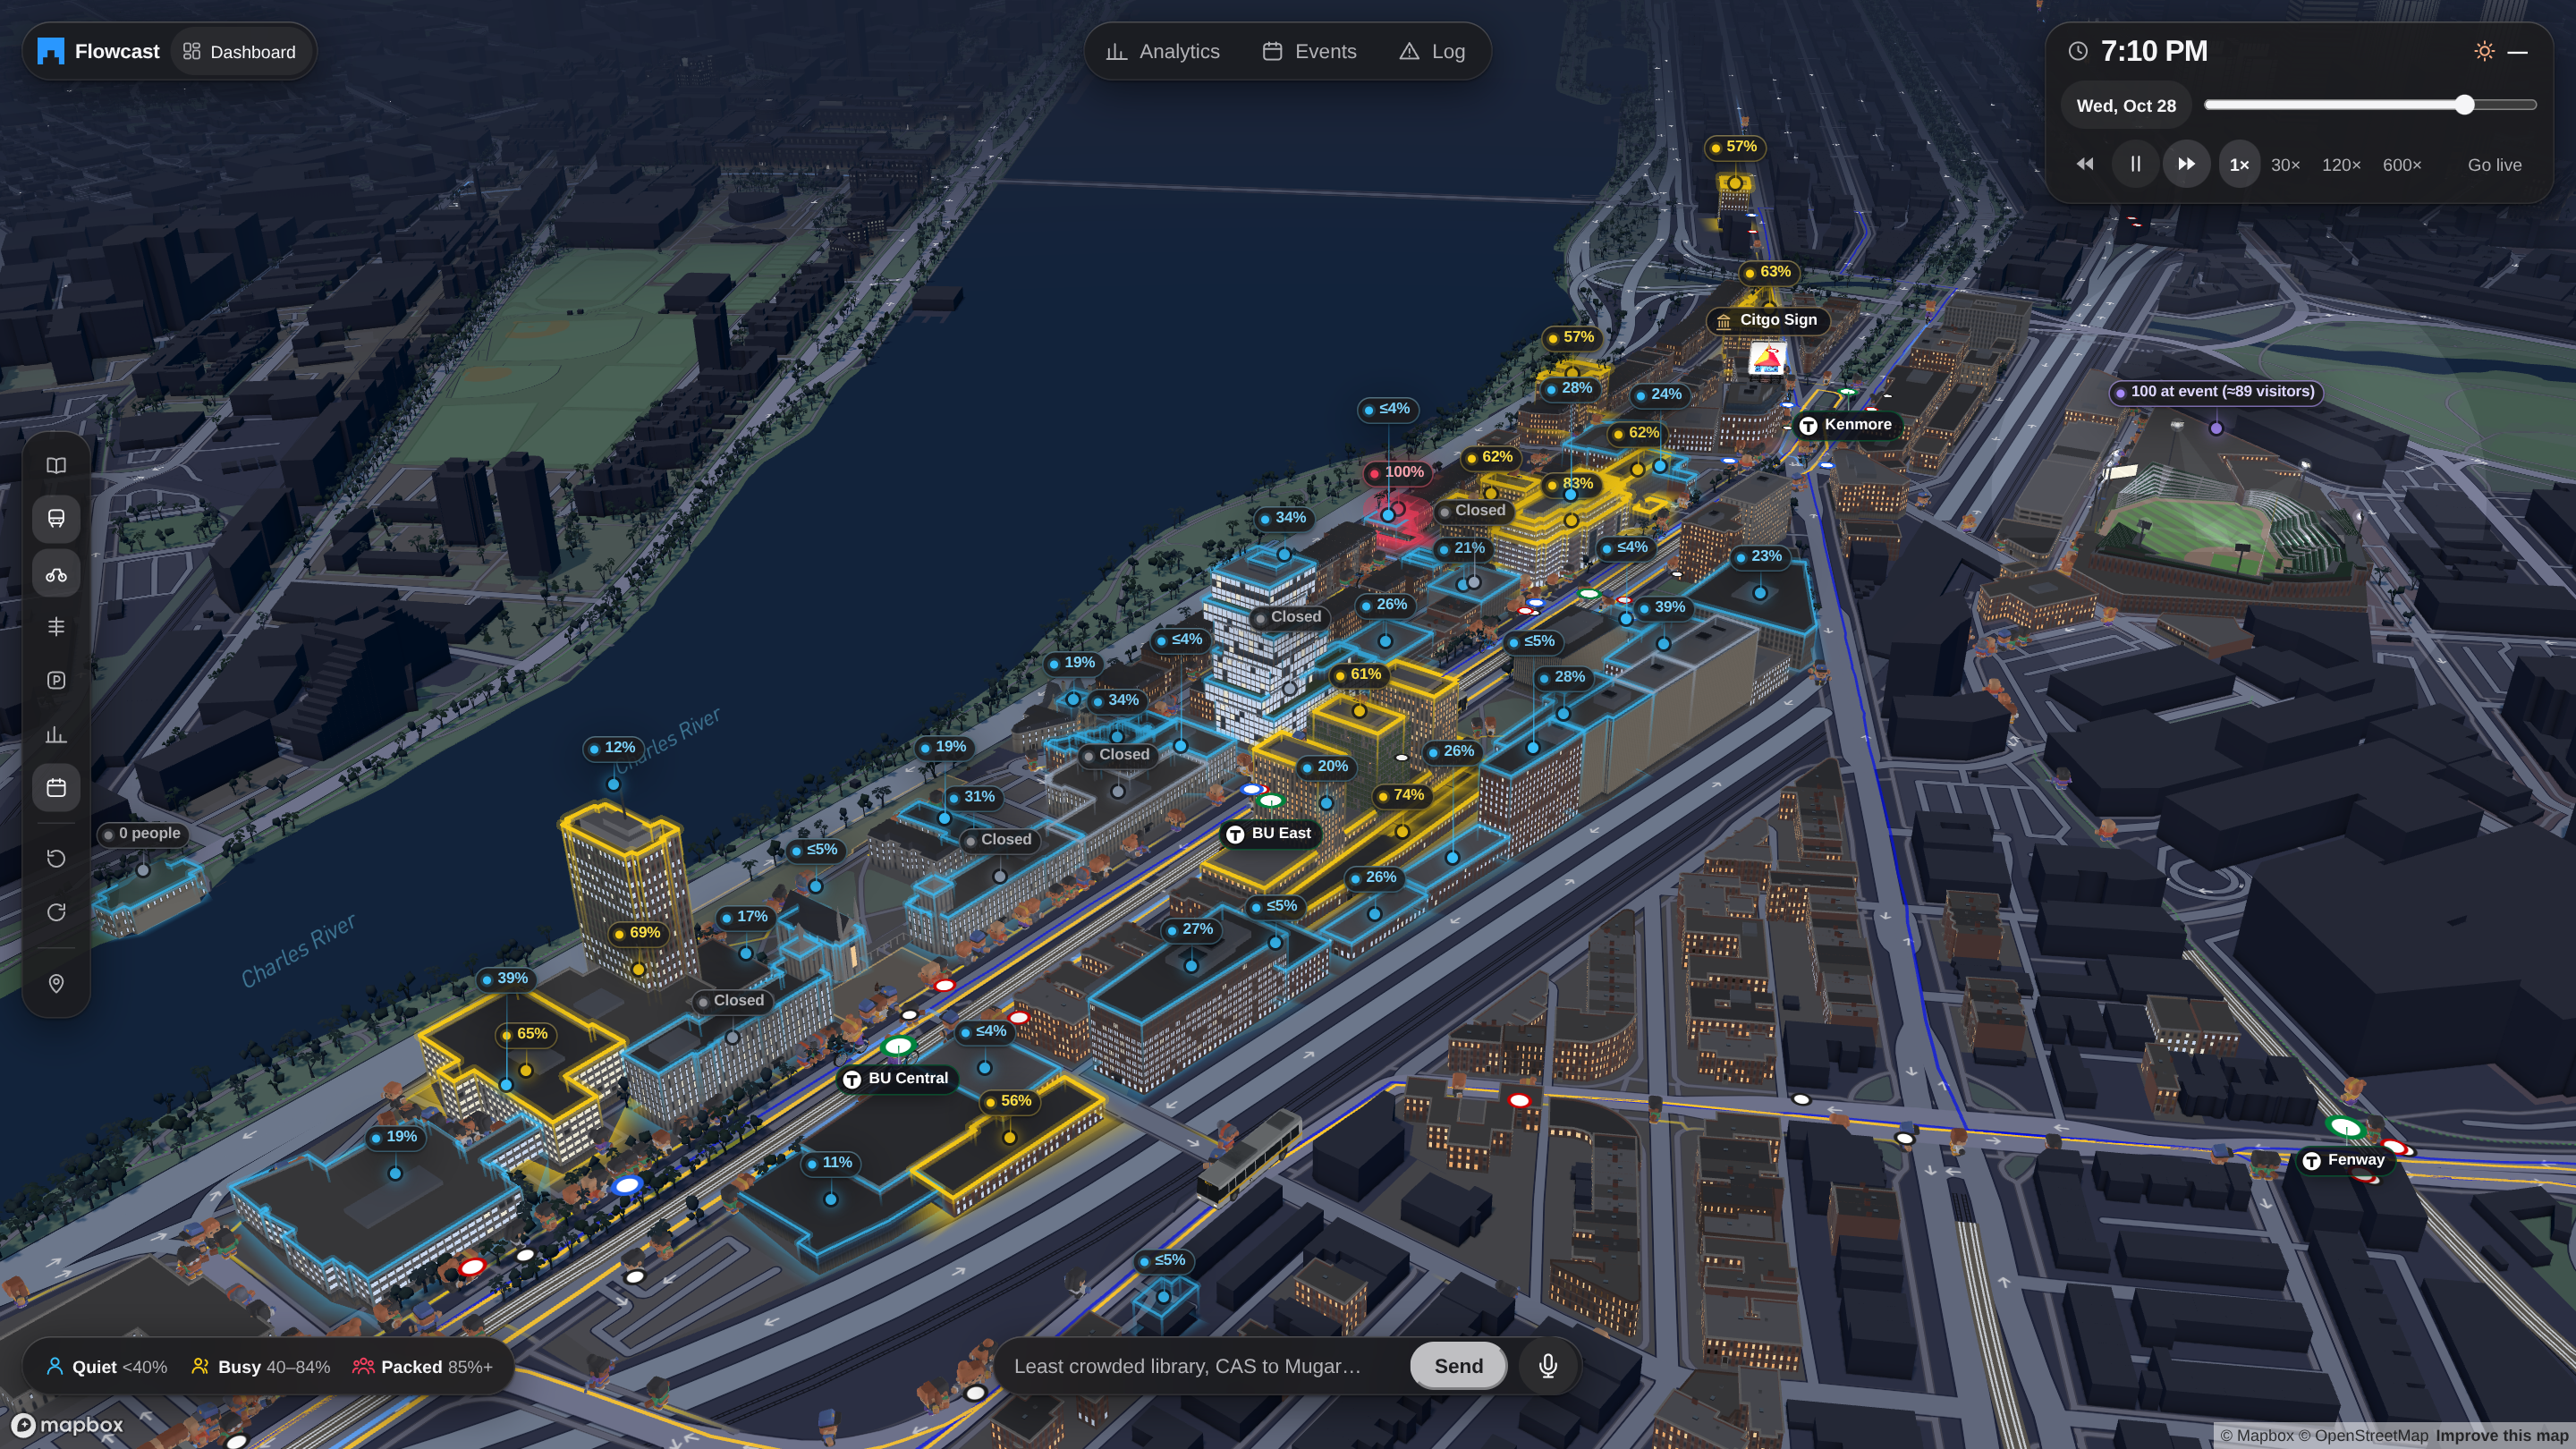
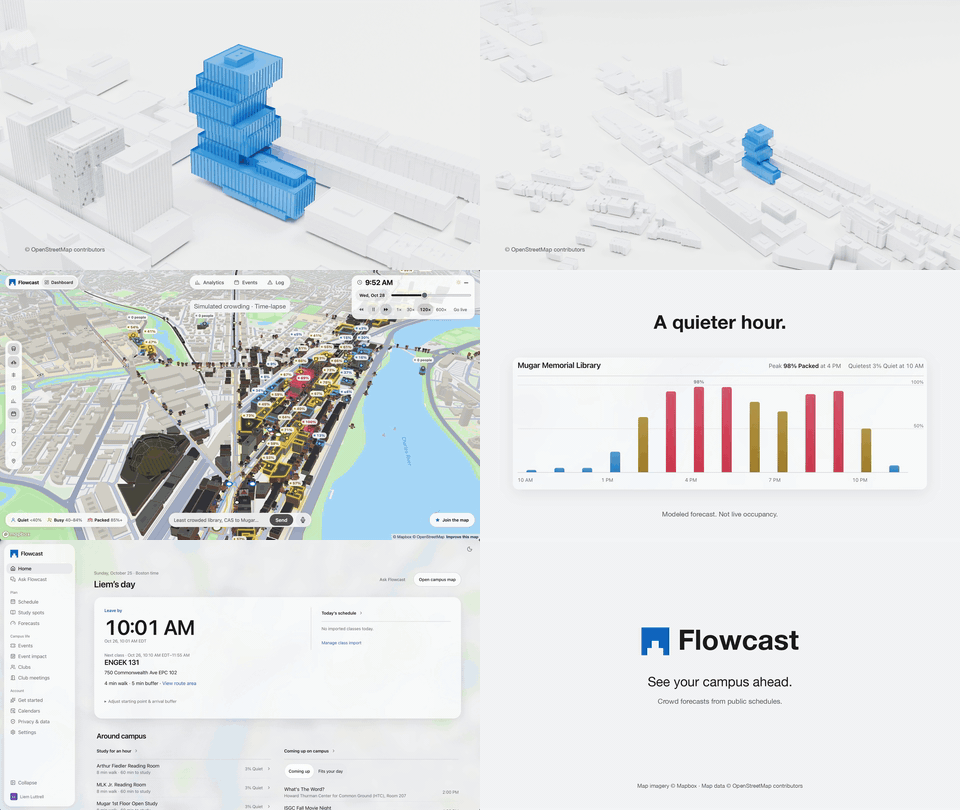
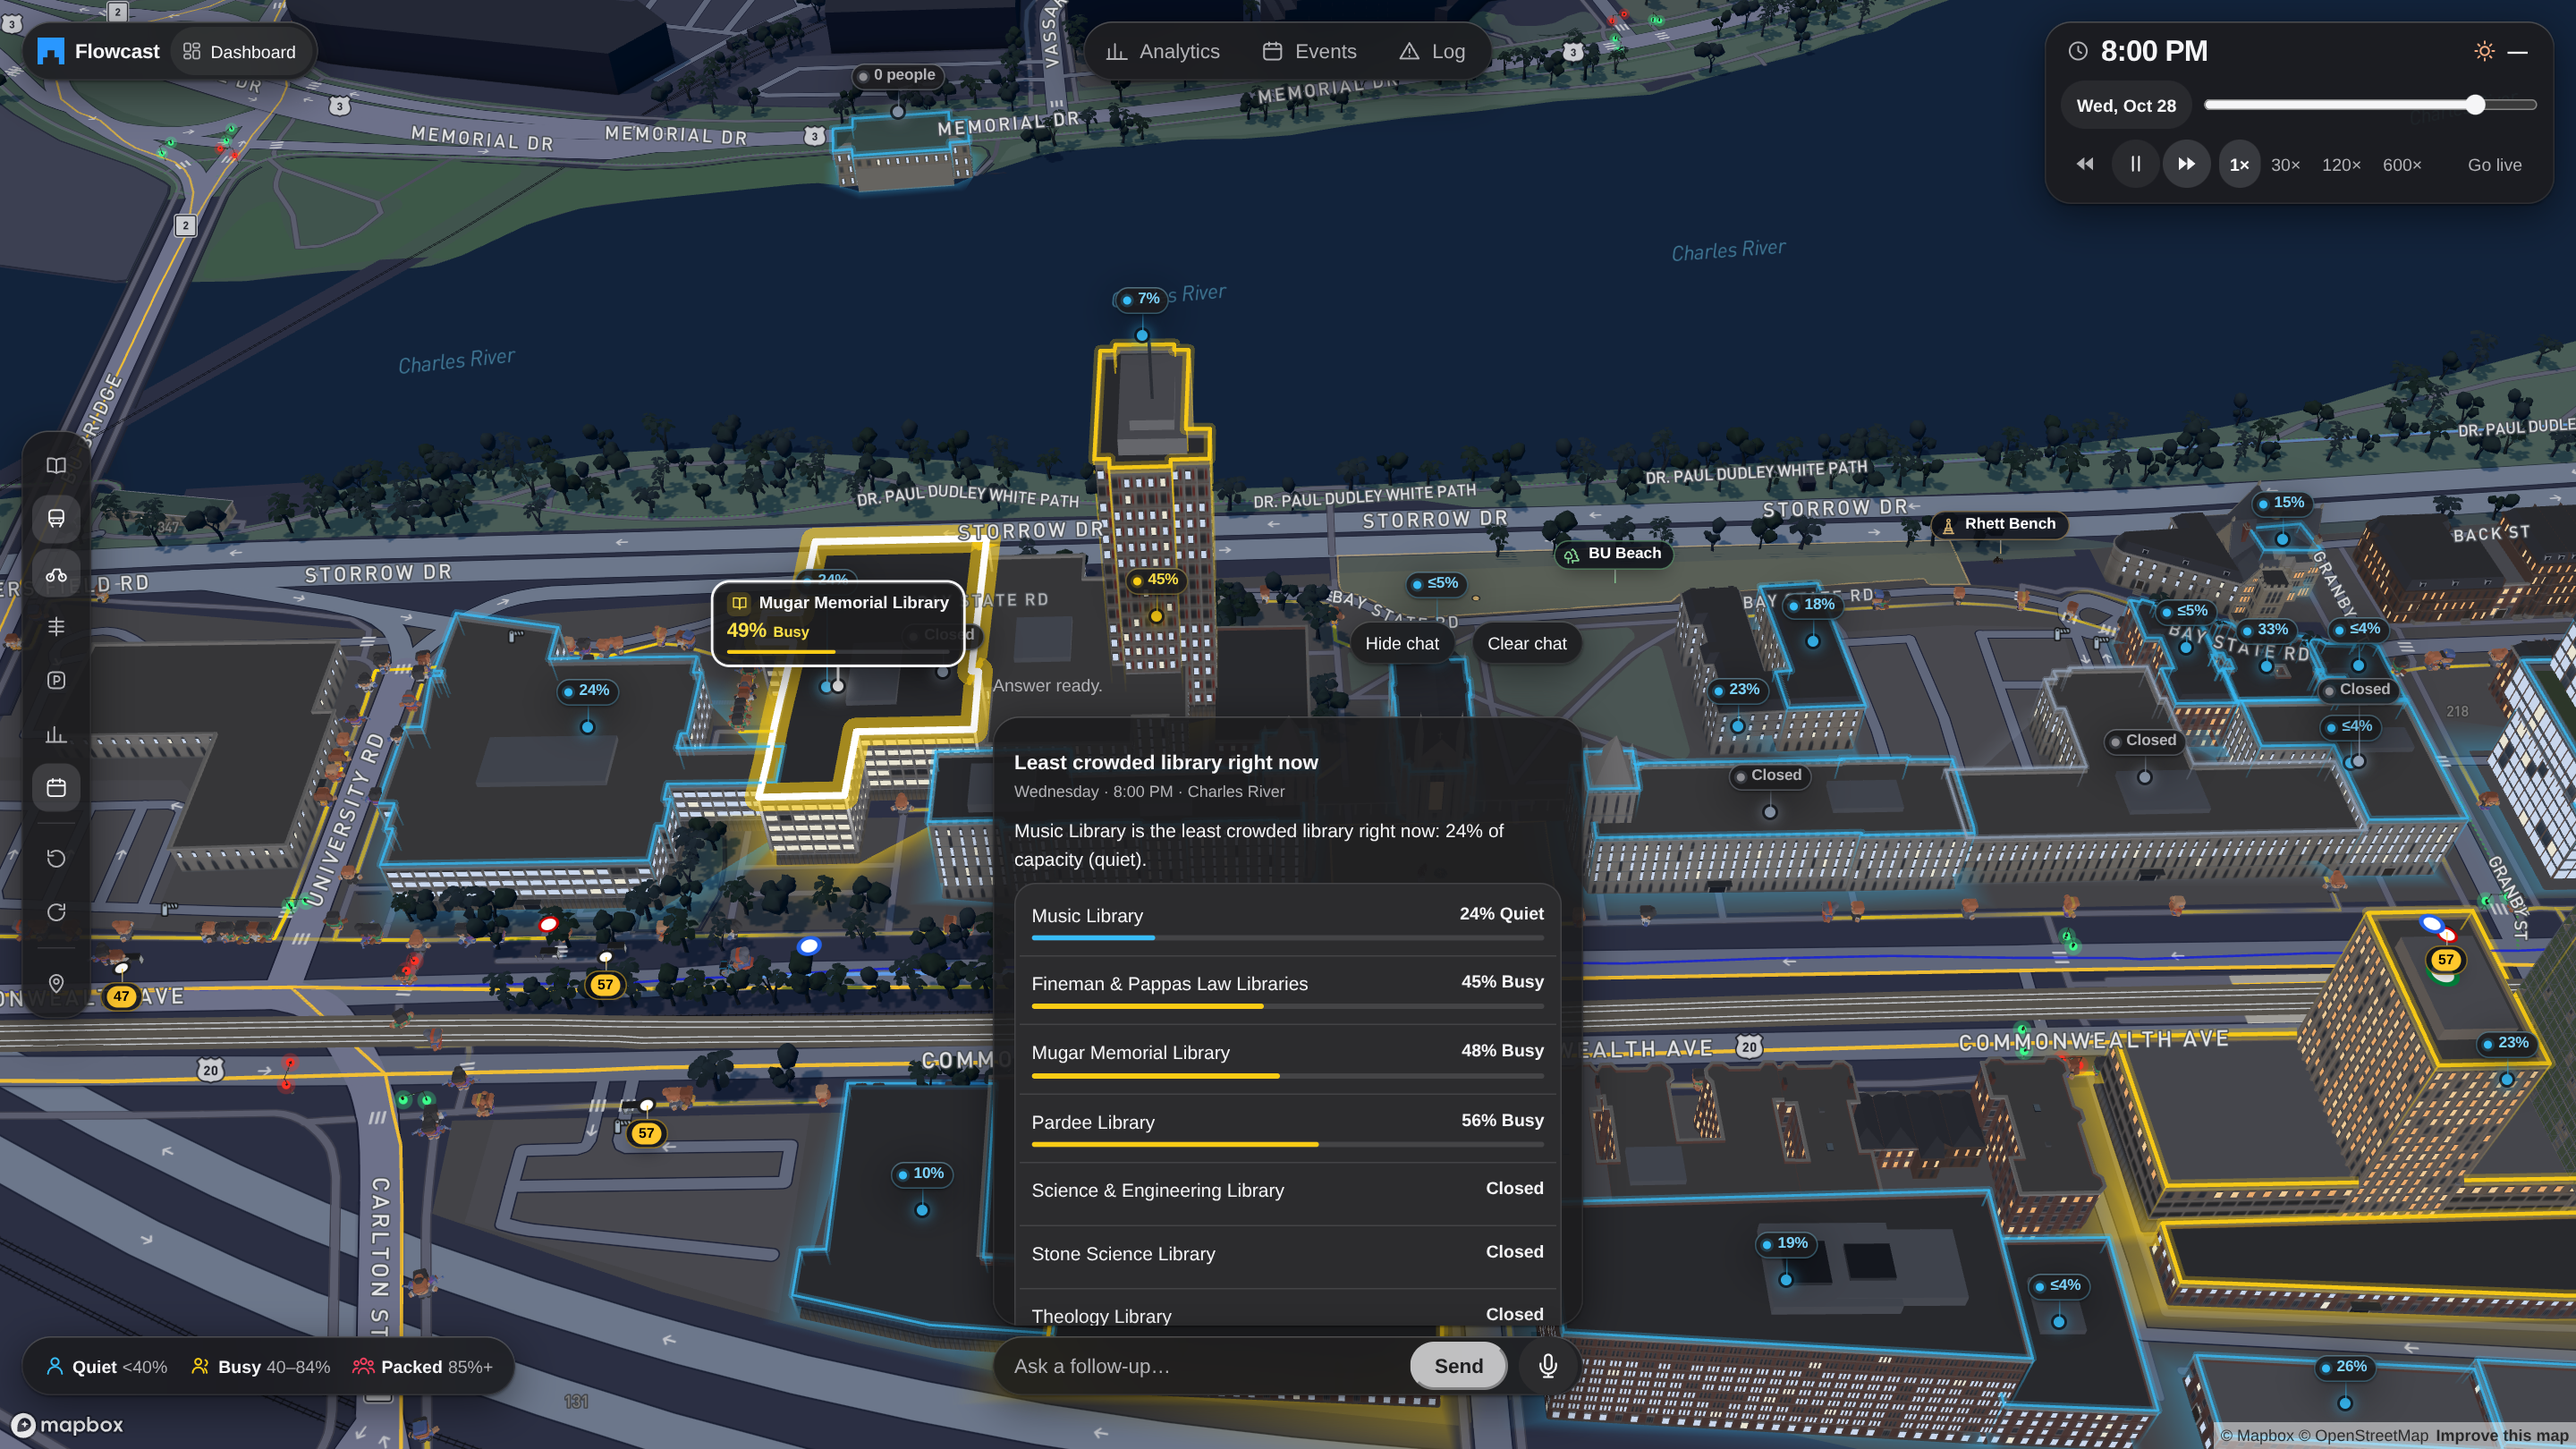
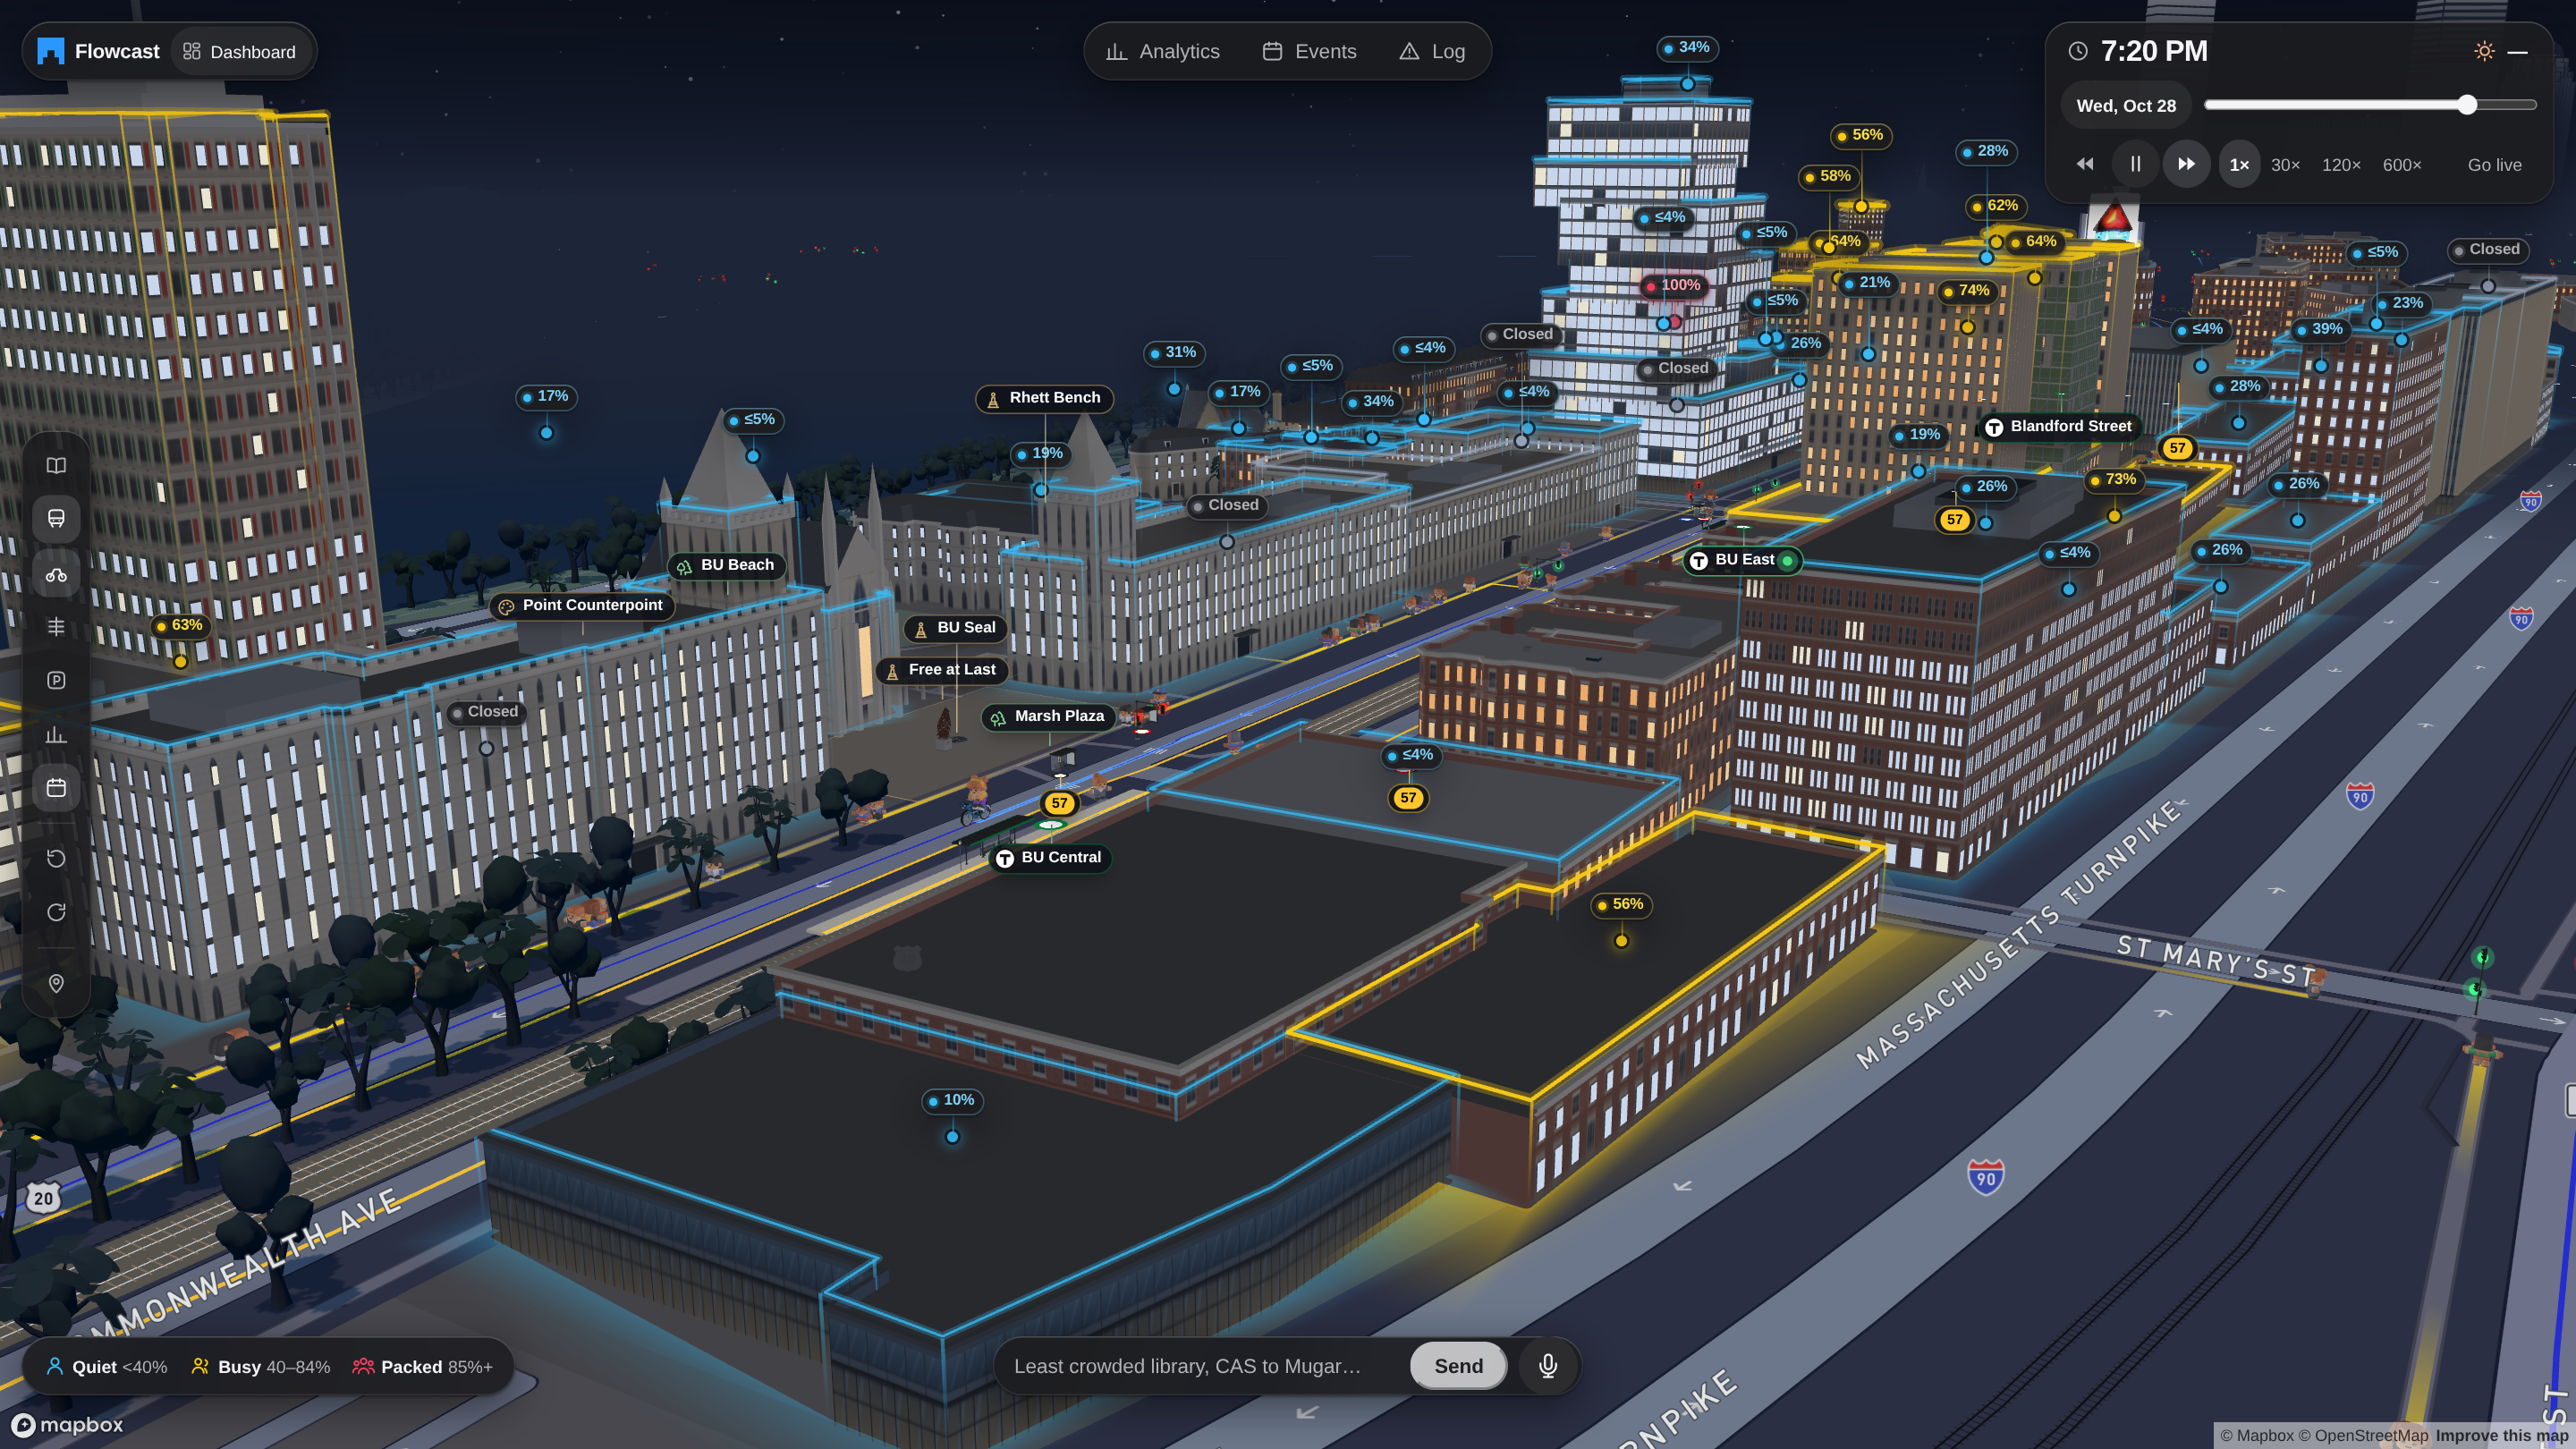
Flowcast is a live 3D digital twin of BU where 36,977 simulated students, matching BU's Fall 2025 census, follow the university's real published class schedules. Every building glows by how full it is, hour by hour.
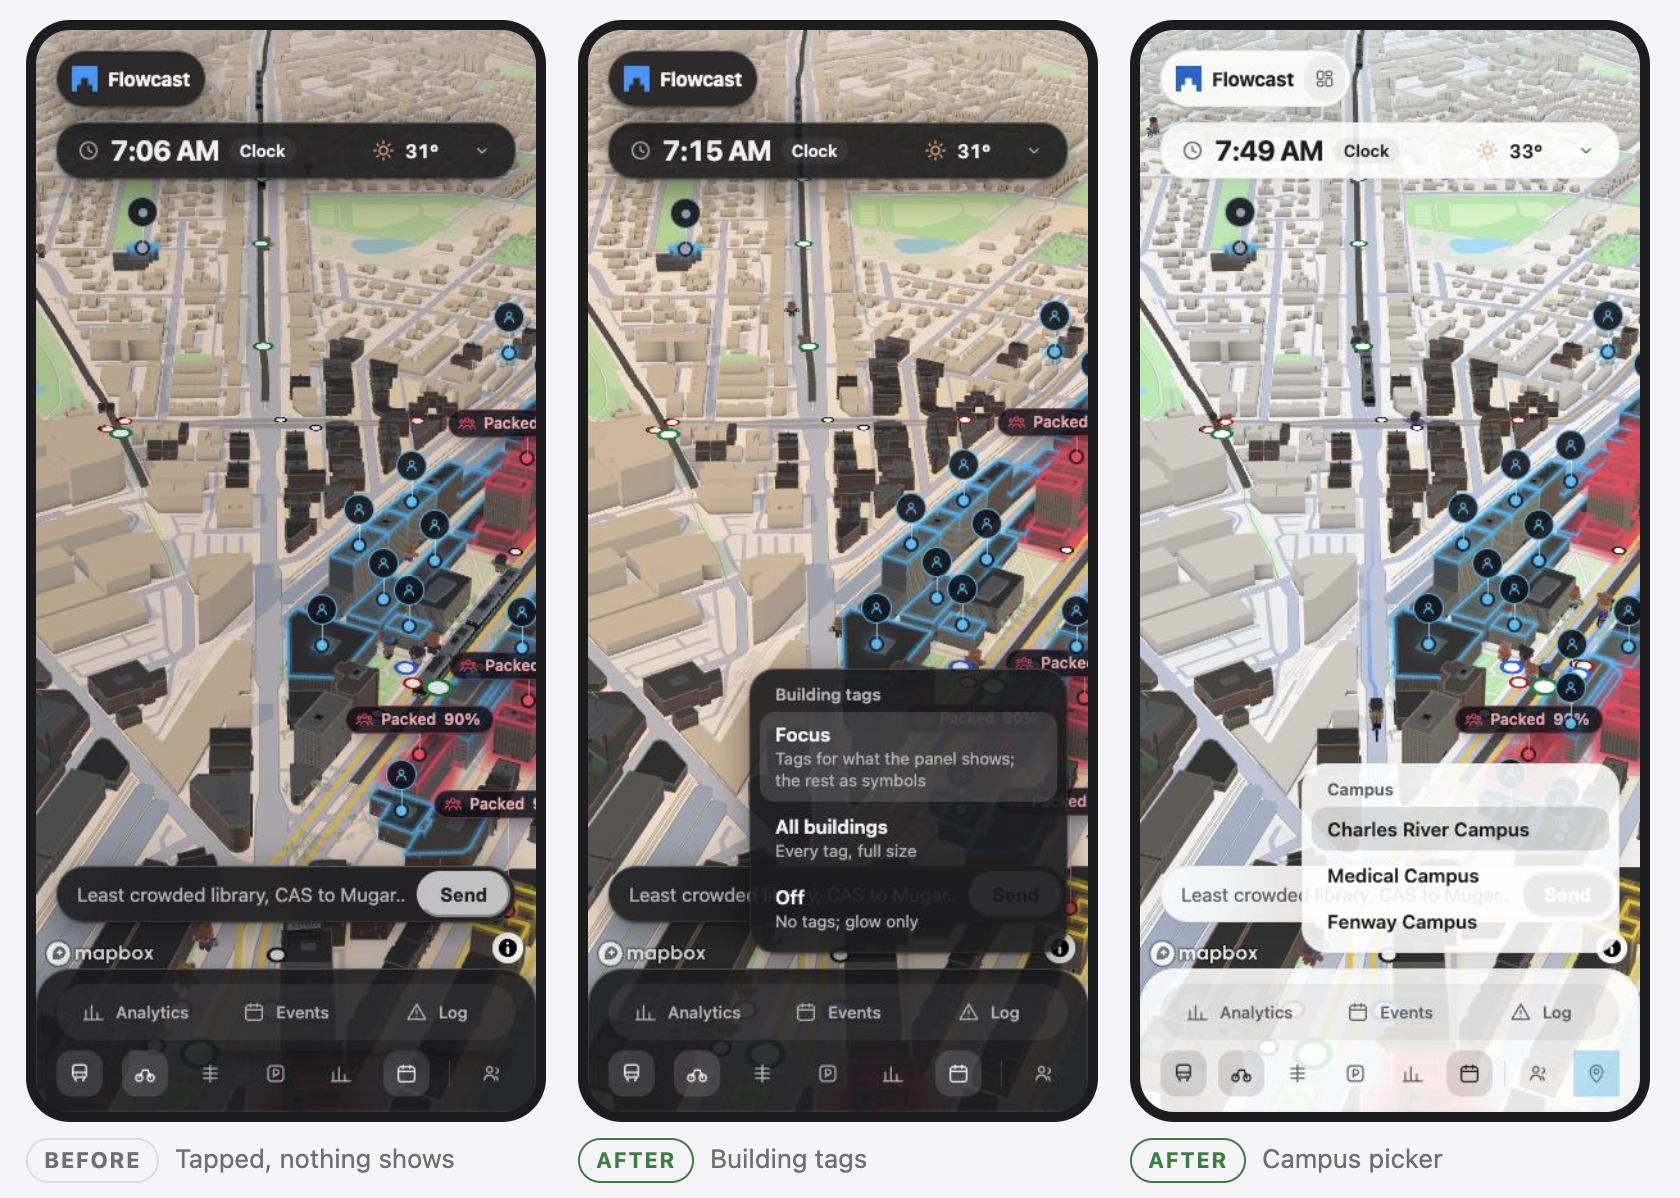
- 🏫 Crowd forecasts for 101 places across the Charles River, Fenway and Medical campuses: libraries, dining halls, gyms and academic buildings, each labelled Quiet, Busy or Packed with a percentage.
- 🎟️ Campus events: all 88 public Terrier Central events. The Event impact view shows how any date's events change crowding, before and after.
- 🚇 Live transit: MBTA Green Line and buses, the BU Shuttle, and real Bluebikes docks and trips.
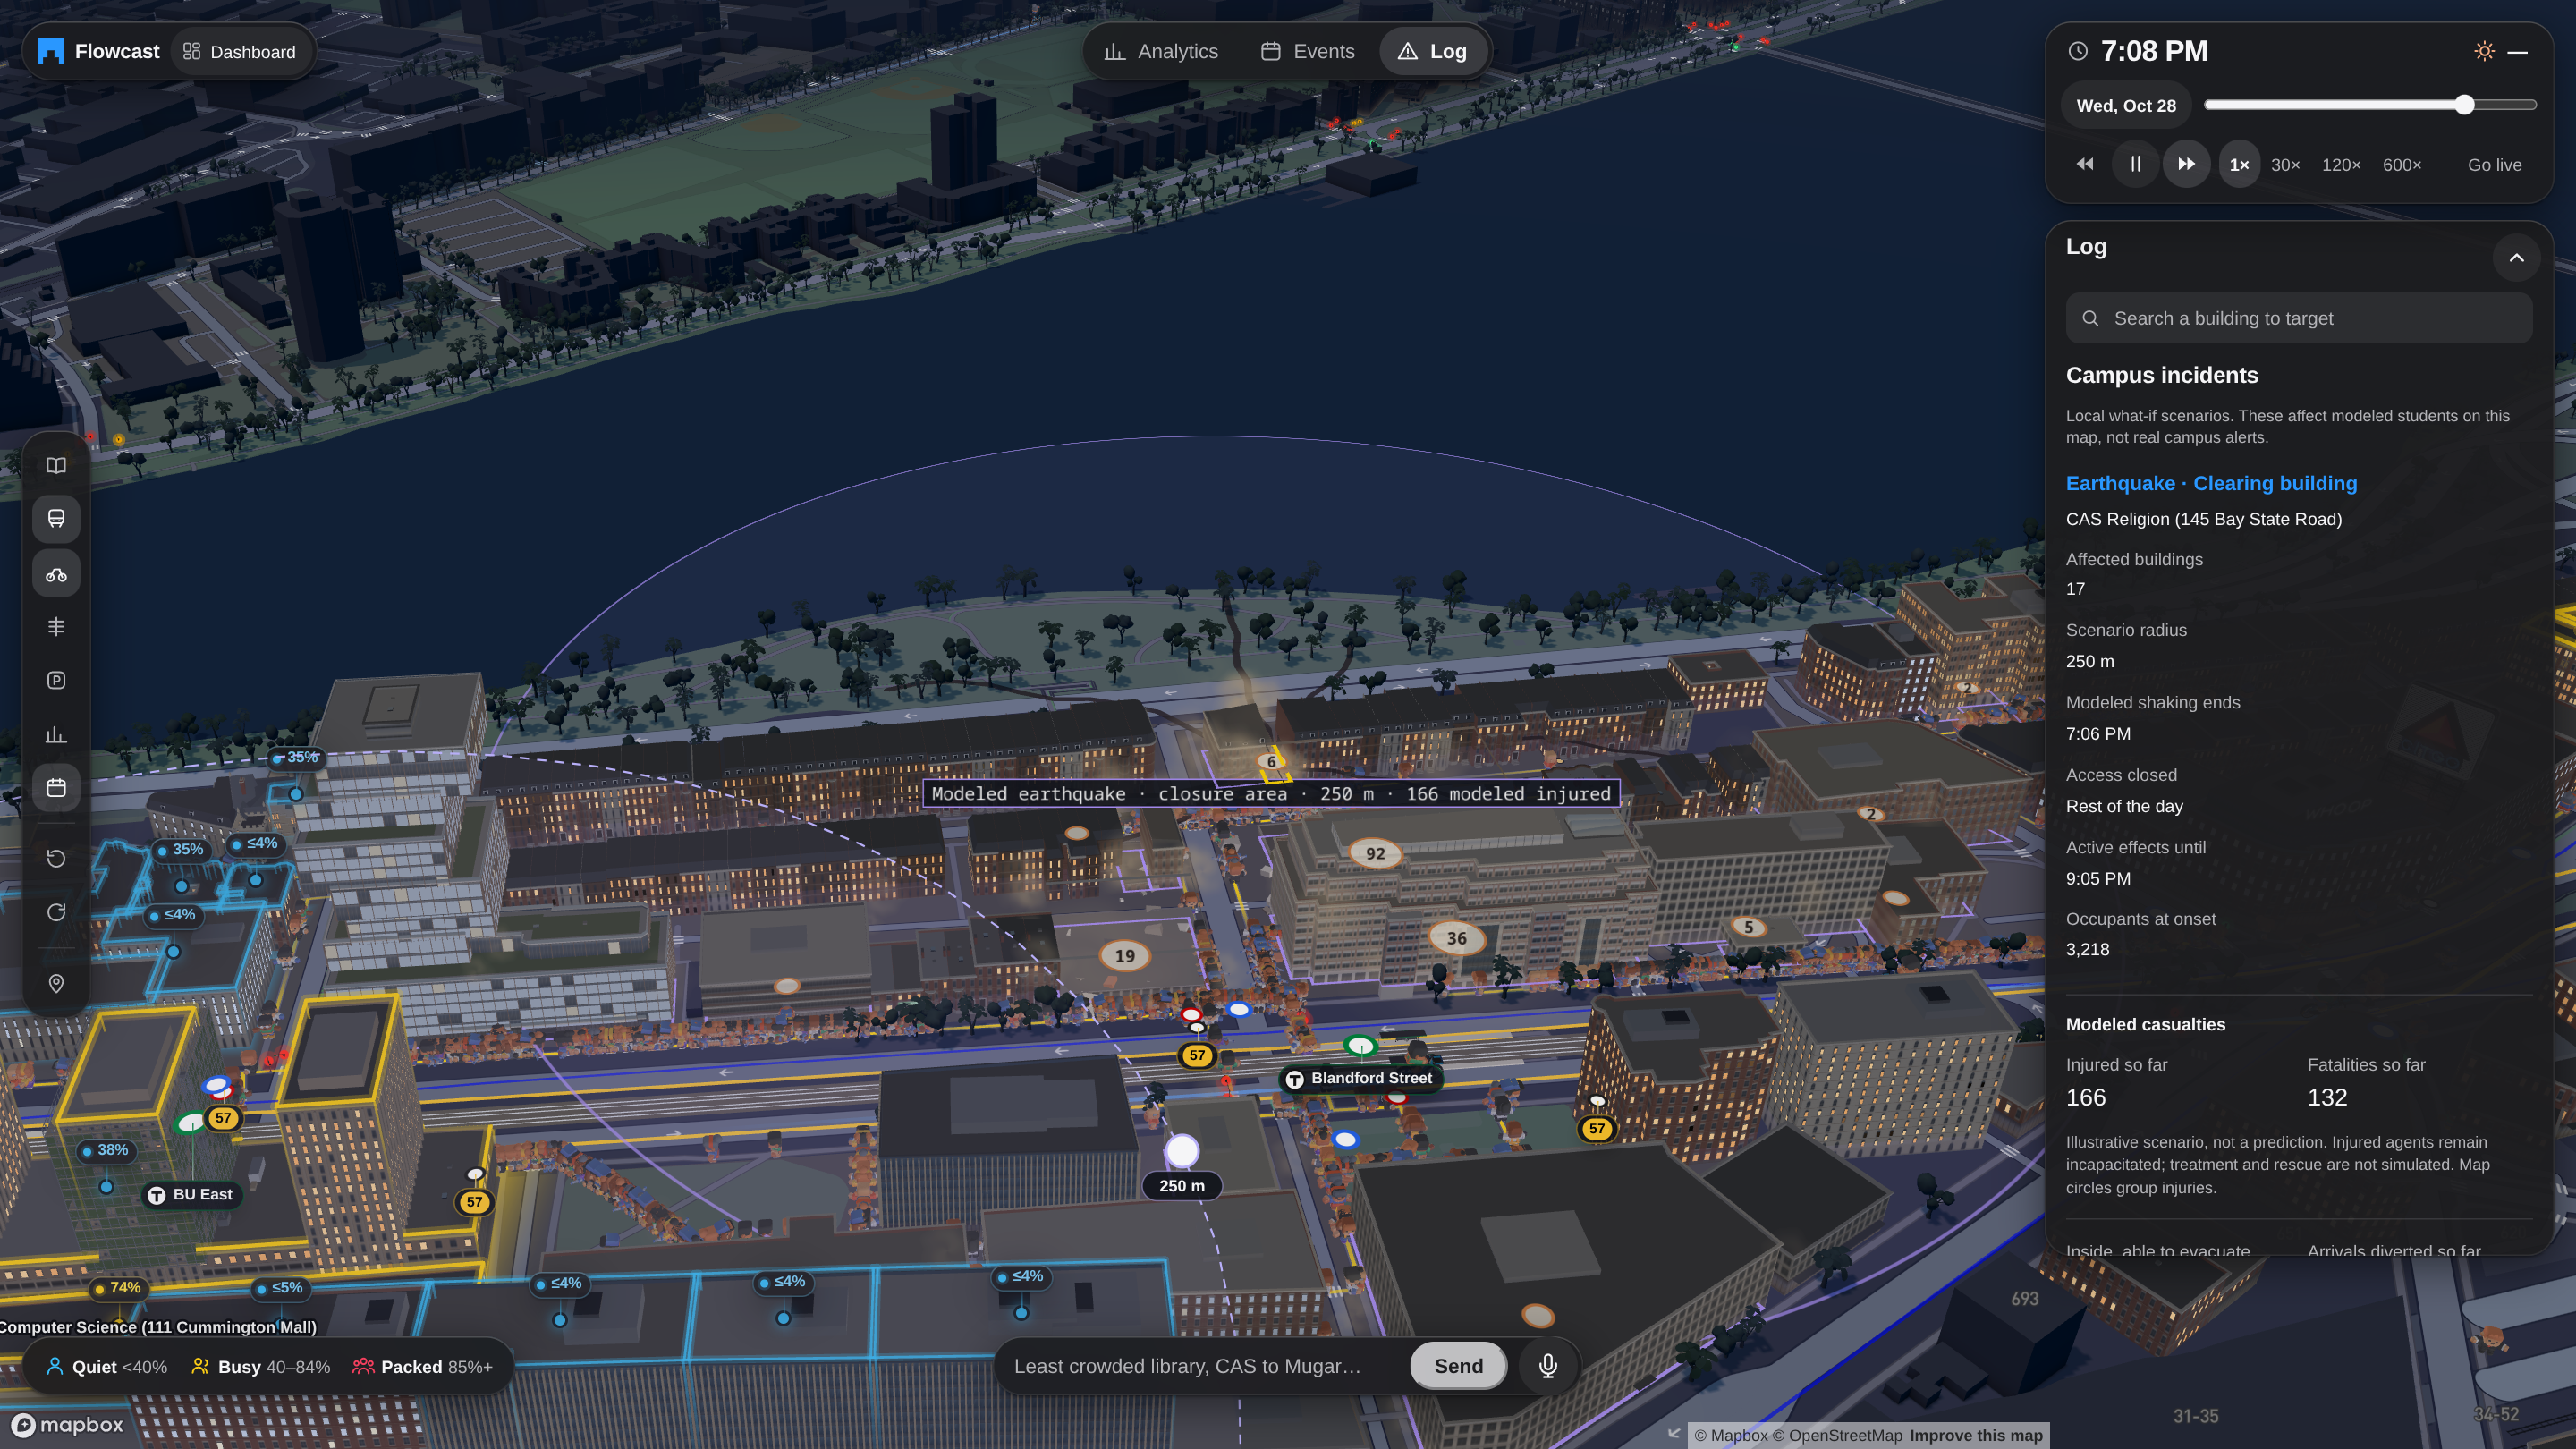
- 🚒 What-if emergencies: start a fire drill, alarm or building closure and watch occupants evacuate and choose where to go next.
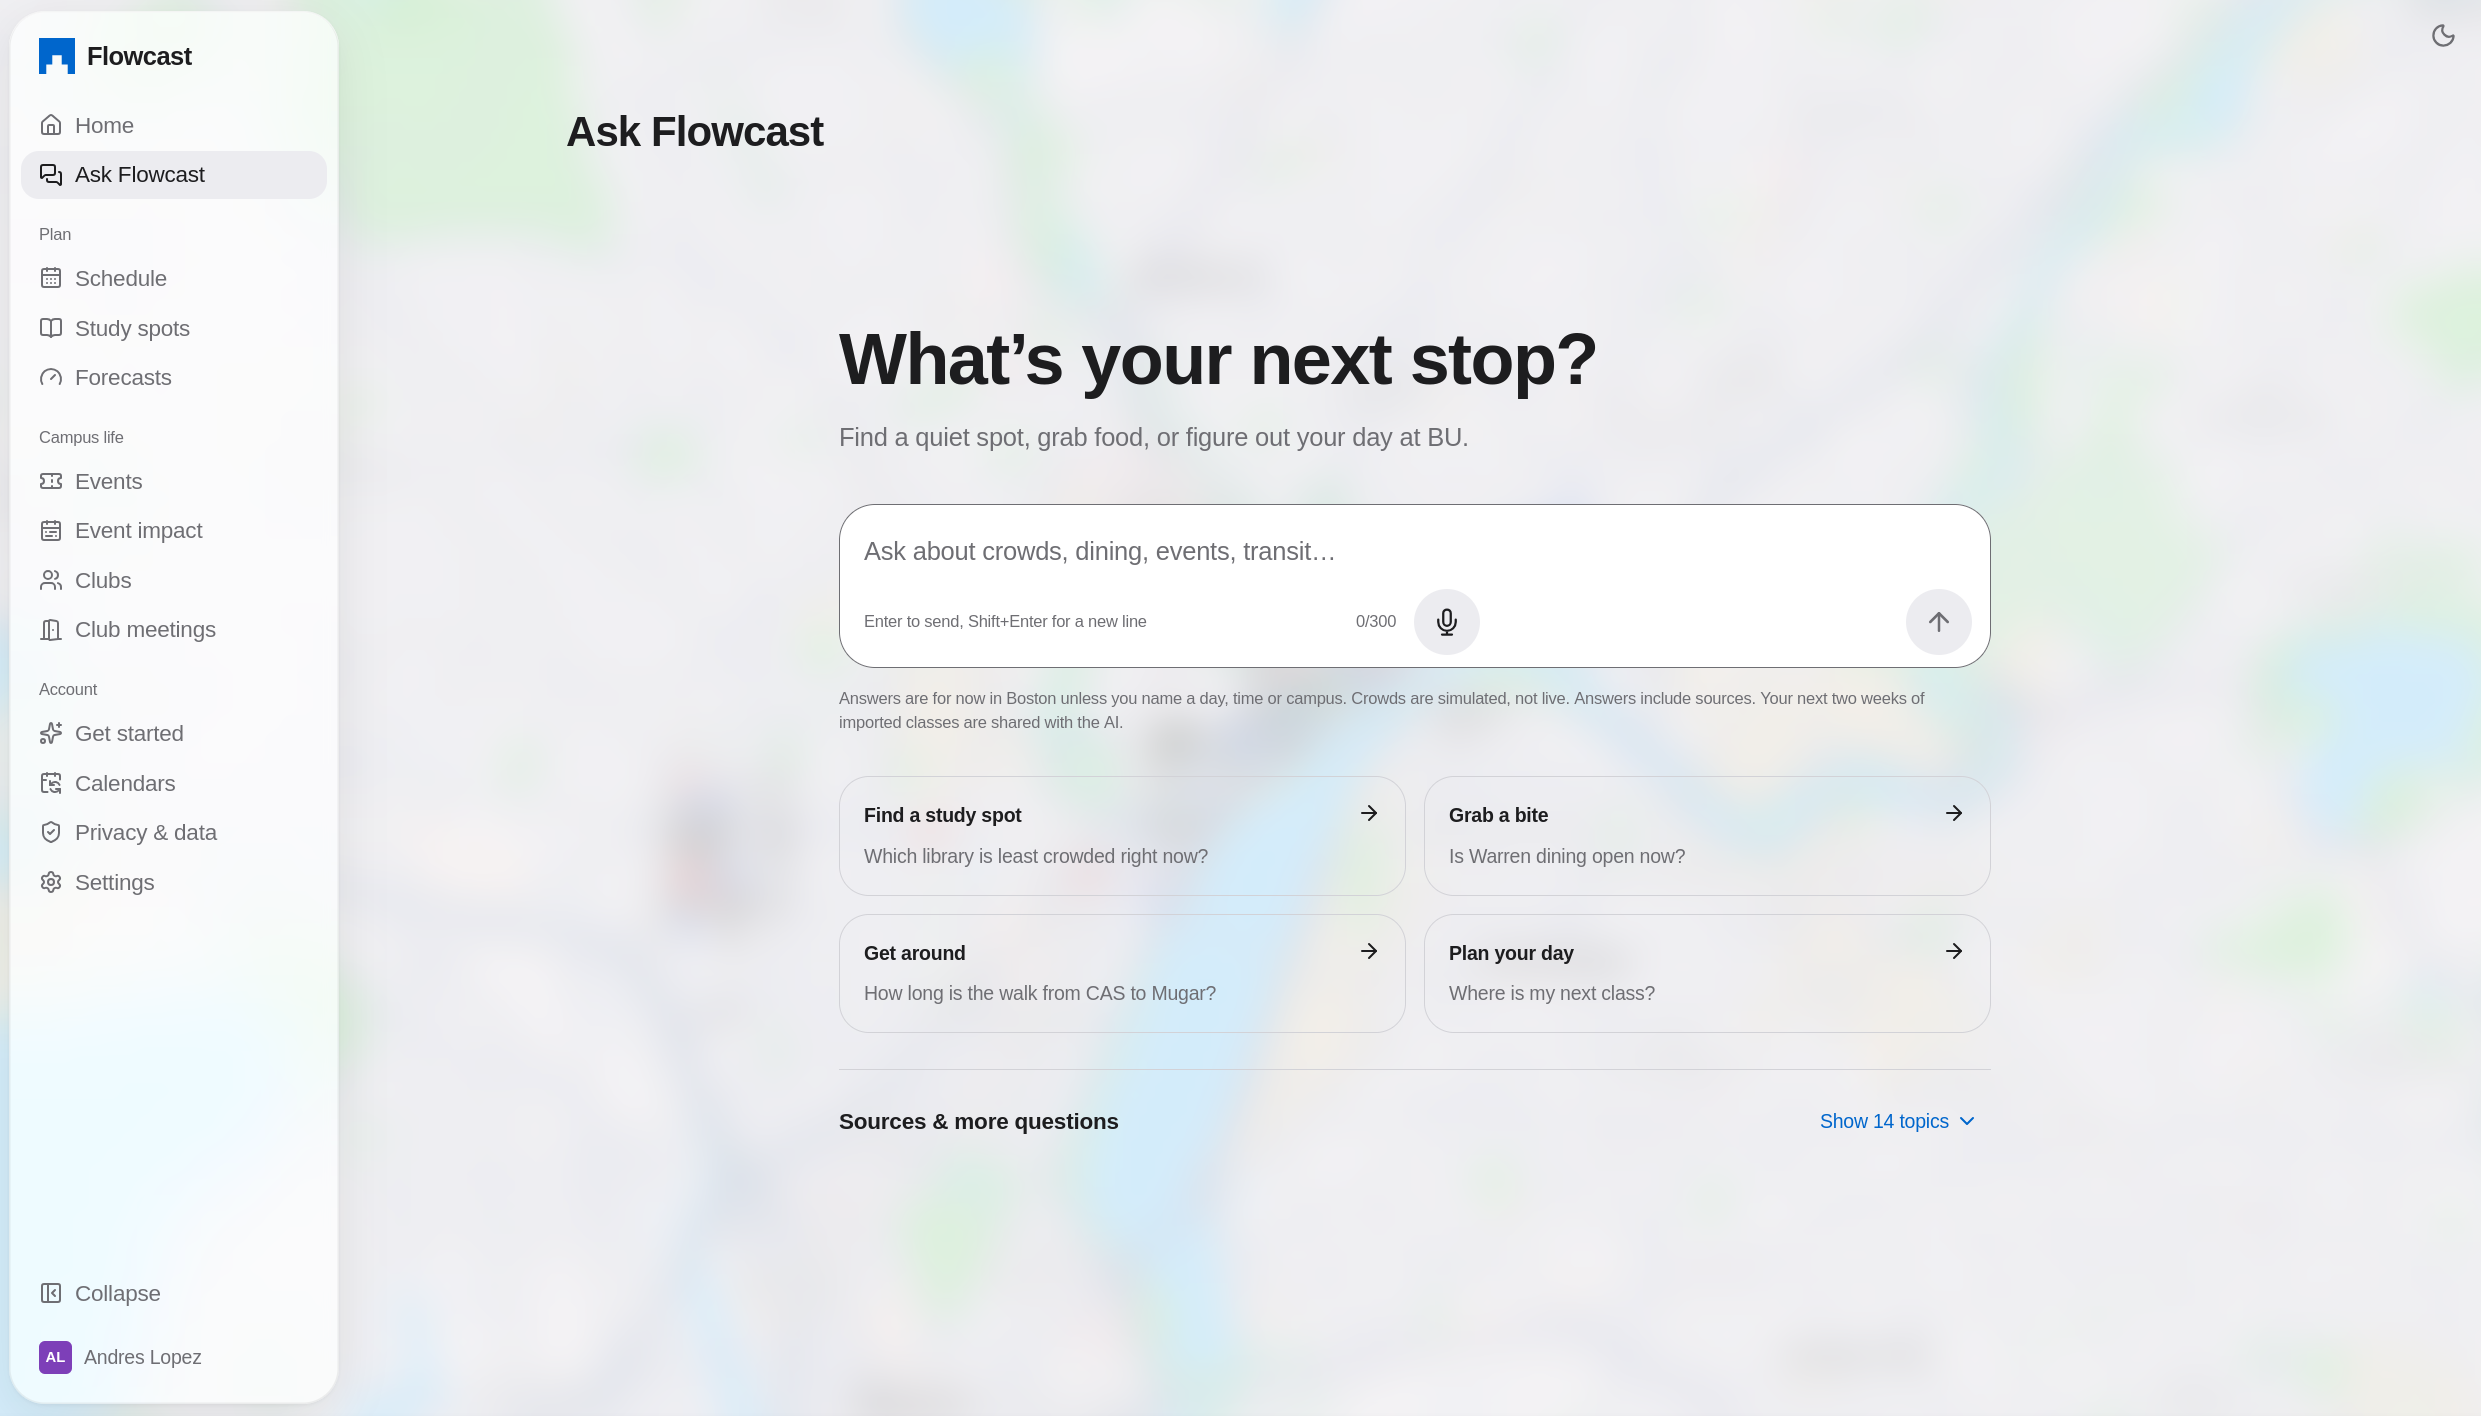
- 📅 A student dashboard: sign in with Google, import your class schedule, see your next class and when to leave, find study spots, and follow clubs.
- 🧑🤝🧑 Club tools: meetings, RSVPs, check-in QR codes, and turnout previews that avoid peak crowds.
- 💬 An AI campus guide you can type or talk to: "Least crowded library right now?", "Quietest dining hall at 6 PM?", "How far is CS 132 from DS 340?" Answers come from the same simulation and walking routes as the map.
A building's crowd level is simply simulated occupancy over published capacity:
$$ \text{crowd}_b(t) = \frac{N_b(t)}{C_b} $$
where $N_b(t)$ is the number of simulated people in building $b$ at time $t$ and $C_b$ is its published seat or bed count.
The dashboard's "leave by" time uses real walking routes at a walking speed of $v = 1.4\ \text{m/s}$:
$$ t_{\text{leave}} = t_{\text{class}} - \left\lceil \frac{d_{\text{route}}}{v} \right\rceil - t_{\text{buffer}} $$
How we built it
- Data pipeline (Python): rate-limited, cached scrapers for the BU course catalog, classroom directory, Dining, Libraries, Housing, FitRec, Terrier Central events and the Common Data Set, plus MBTA GTFS, Bluebikes GBFS and trip history, City of Boston traffic counts and OpenStreetMap. Every record keeps its source URL and retrieval time, and snapshots are checksummed.
- Simulation (TypeScript): enrolls each synthetic student in real sections within seat limits, then plans their day around 5,904 real class meetings in 437 classrooms, opening hours, capacity and walking time. It adds meals, study, the gym, events and incidents. It's deterministic: the same inputs always give the same week.
- 3D map: MapLibre/Mapbox with deck.gl, GPU-instanced walkers, crowd glow, live transit layers and a cinematic intro that drops from the sky into campus.
- Design (Figma): we designed the interface in Figma before writing code: an Apple-inspired Liquid Glass look for the landing page, dashboard and map panels, and a new sharp-edged Flowcast logo. The colours and type from the Figma file became the shared design tokens in
theme/, so the dashboard and 3D map look like one product. - Dashboard (React + Vite): student and admin views, served together with the map.
- Backend (Node/Express): PostgreSQL on Supabase, Google sign-in through Supabase Auth, and an Ask/voice agent built on the OpenAI Agents SDK that keeps the AI key off the browser. Each simulated day is built on its own worker thread.
- Hosting: a single Node server on Railway serves the dashboard and map, compresses responses, and runs the API as a supervised child process that restarts if it dies. GitHub Actions runs the Python, web, map and server tests on every push.
- Kiro: we used spec-driven development (requirements → design → tasks), steering files for our data-honesty rules, custom agents, hooks that run tests on every stop, and property-based tests.
Challenges we ran into
- Making it honest. It's easy to make a simulation look convincing. It's hard to make it truthful. We label every number as either published evidence or a named model assumption, never invent venues or capacities, and never treat event registrations as attendance.
- Checking against reality. We compared the model against every real count we could find. Some matched well, and some showed big gaps. Real Bluebikes activity around campus peaks at 4–7 PM, while our simulation peaked at lunch. The hourly correlation was close to zero ($r \approx 0$), which pushed us to look at who we weren't modelling. Calibration is a balancing act: we minimize a weighted loss over many metrics,
$$ L = \sum_{m} w_m\, \ell_m , $$
and improving one metric (like Green Line peak timing) can make another worse (like rainy-day walking spikes).
- A capacity bug caught by property tests. We generate 100 random event days per test run. One seed showed that events held in classrooms could push a building over capacity, because classrooms weren't in the shared capacity tracking. A hand-written test would never have found it.
- Messy real-world pages. Some event pages had broken JSON-LD, with raw newlines and invalid escapes, so we had to parse defensively and add regression tests.
- Performance. Rendering tens of thousands of walkers, 3D buildings and live transit smoothly in a browser meant GPU instancing, adaptive quality and careful loading.
- Sign-in in production. On demo day, new Google sign-ins were landing on the landing page instead of the dashboard. The cause was a database table from a new feature that had never been migrated. We fixed the schema and replaced the silent failure with a clear error screen offering Try again, Sign in again, or Back to the landing page.
Accomplishments that we're proud of
- A full week of campus life for 36,977 students across 3 campuses, built entirely from public data.
- Results that hold up against real counts:
| Real observation | Simulated | Observed |
|---|---|---|
| FitRec visits, Saturday | 2,500 | 2,510 |
| West Campus Dining meals/day | 3,098 | 3,000–5,000 |
| Comm Ave at Silber Way, 5–6 PM walkers | 1,547 | 1,818 |
- Accessibility from the start: crowd levels always use a word and a percentage (never colour alone), full keyboard support, and support for reduced-motion settings.
- 500+ automated tests, with CI on every push.
What we learned
- Public data goes further than you'd expect. Schedules, room capacities, hours and transit feeds together are enough to model a campus.
- Honesty is a feature. Showing where the model is wrong, like weekday FitRec visits at 37% because staff aren't simulated yet, builds more trust than hiding it.
- Determinism makes debugging possible. When every run is identical, a bug can be reproduced, bisected and fixed.
- Property-based testing finds bugs that people miss.
- Spec-driven development with AI agents kept four people moving fast without breaking each other's work.
What's next for Flowcast
- Add BU's 11,140 employees and visitors as a separate, clearly labelled layer, which should close the FitRec and evening-transit gaps.
- Fit behavior rates to real counts and check the fit against counts we held back.
- Model the whole semester: midterms, finals, Thanksgiving, and class attendance falling over the term.
- Show uncertainty as a range instead of a single number.
- Map the remaining buildings and bring Flowcast to other universities, since every input is something most campuses already publish.
Built With
- beautiful-soup
- bluebikes
- deck.gl
- express.js
- github-actions
- luma.gl
- mapbox
- maplibre
- mbta
- motion
- node.js
- open-meteo
- openai
- openstreetmap
- postgresql
- psycopg
- pypdf
- python
- railway
- react
- supabase
- three.js
- typescript
- vite
- zod


Log in or sign up for Devpost to join the conversation.