-
-
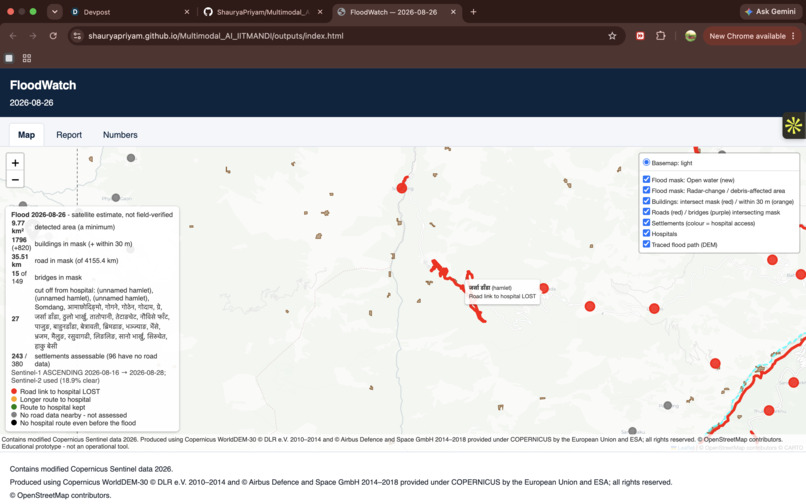
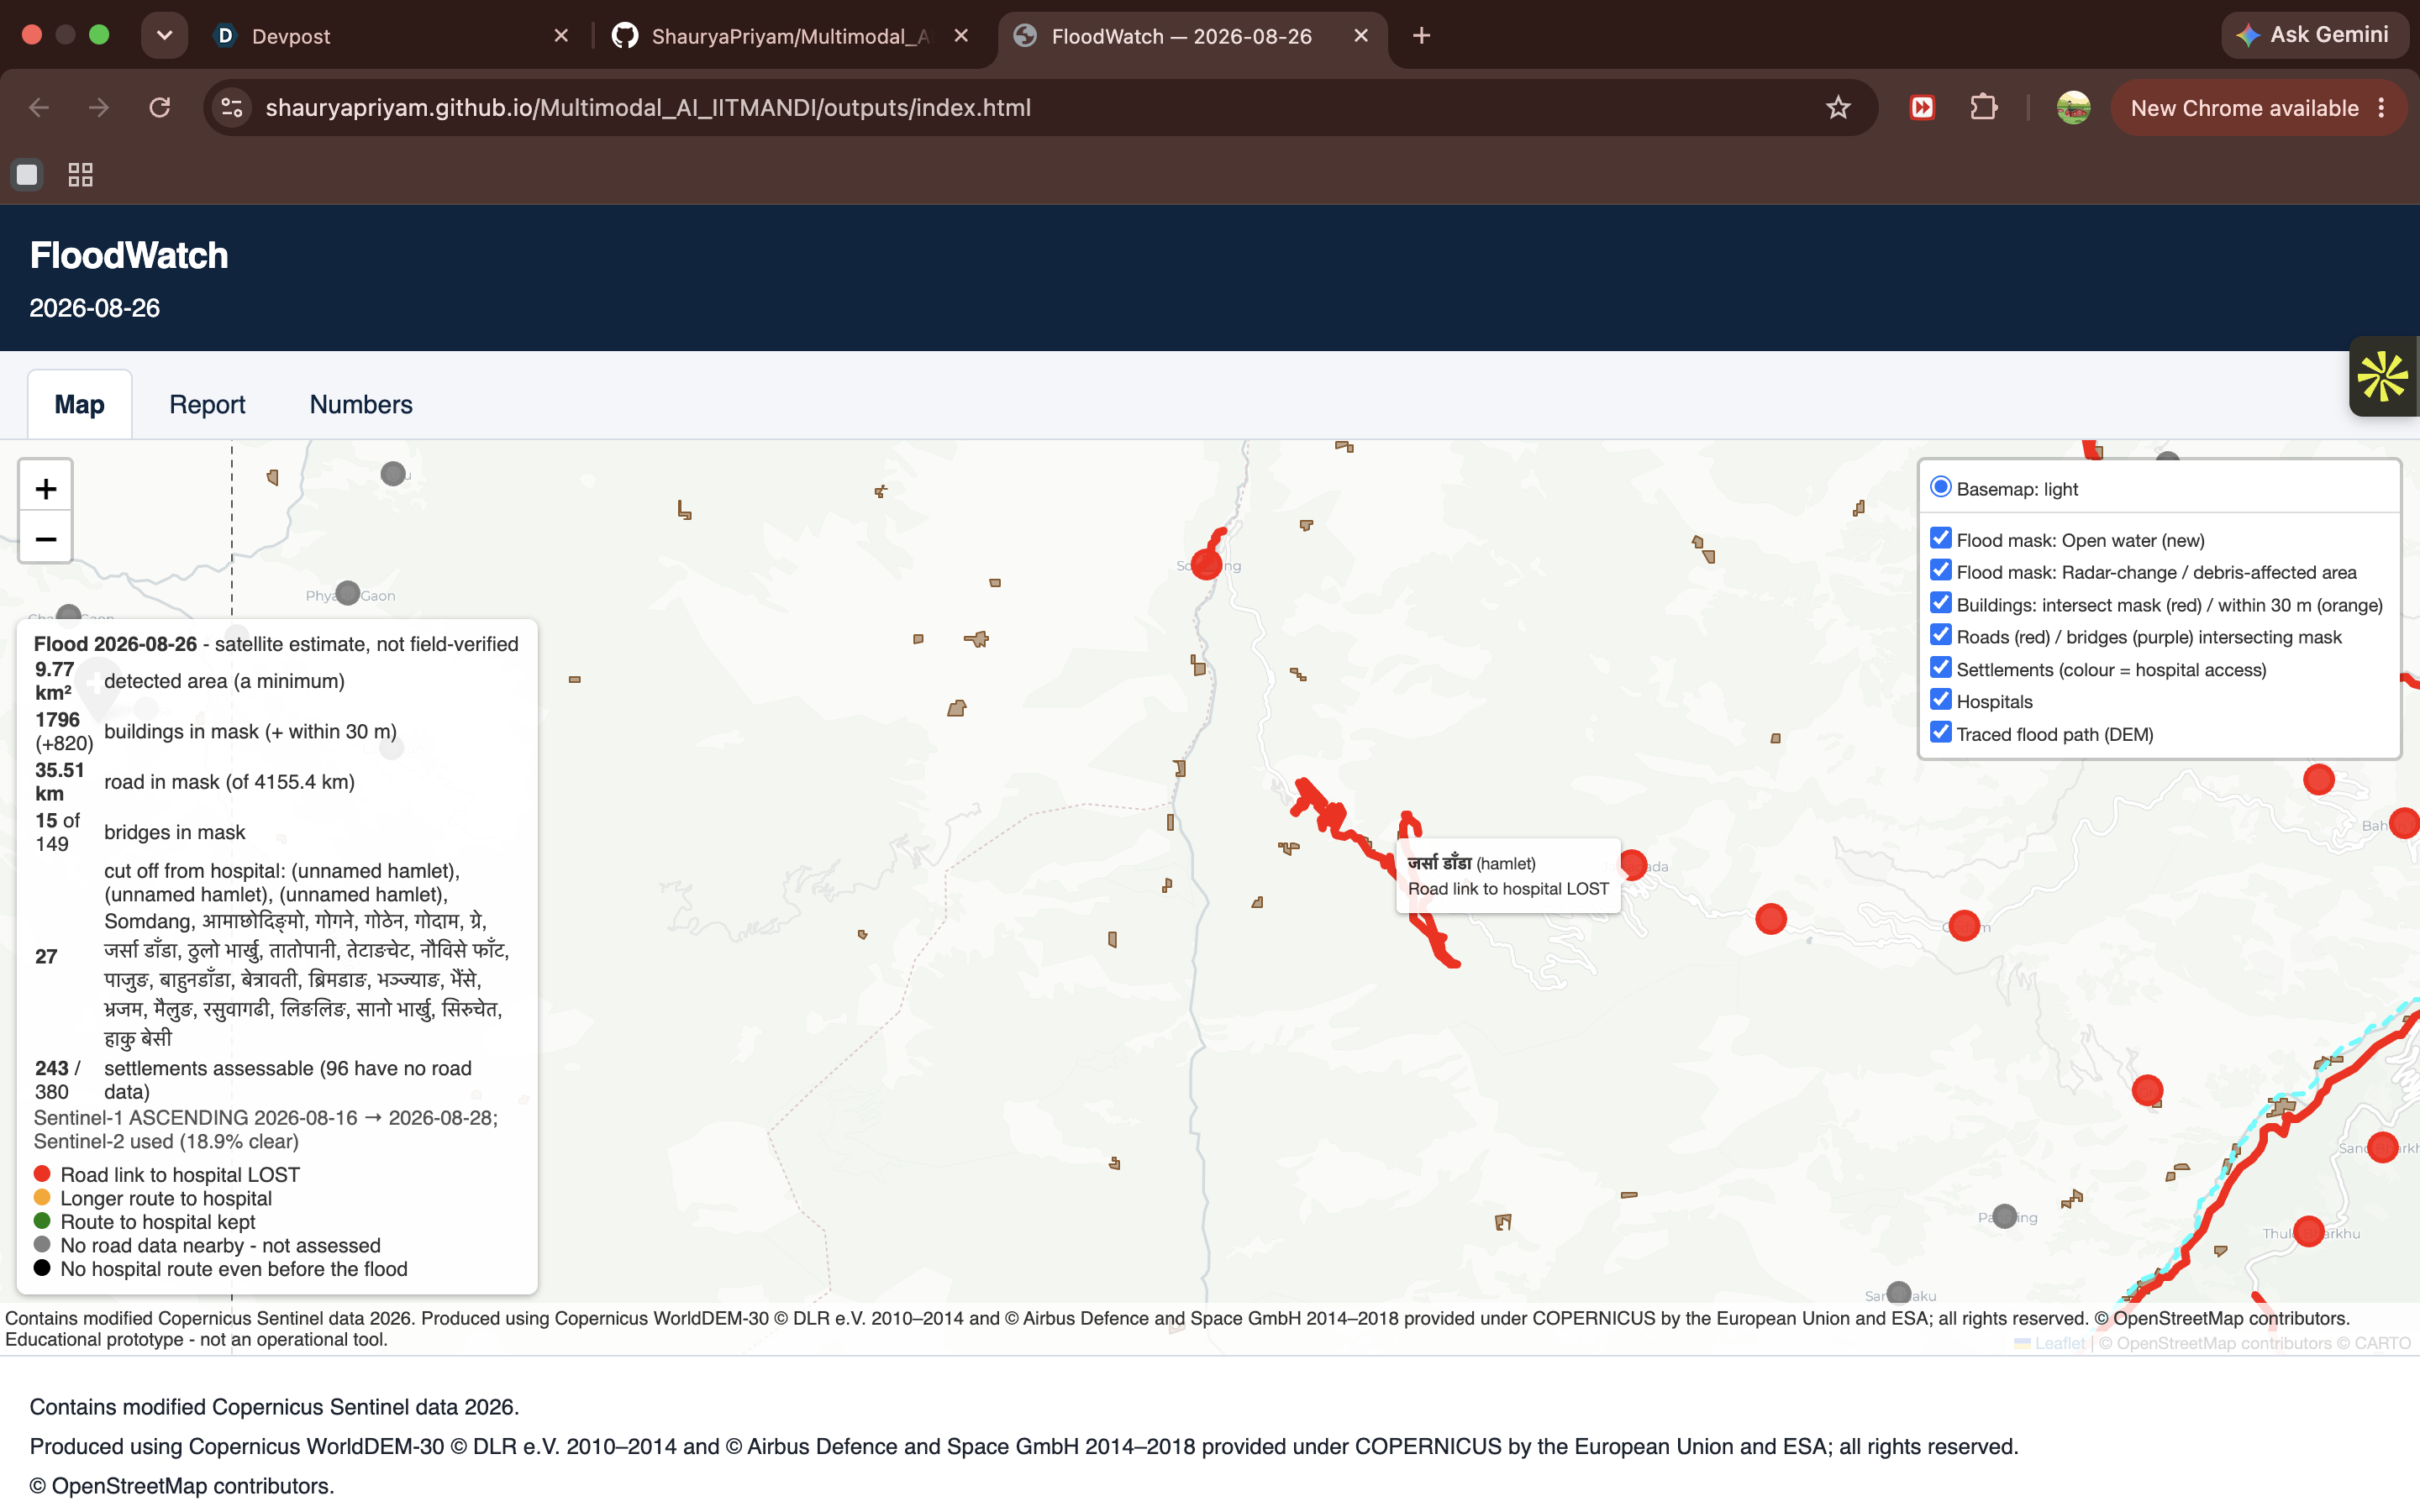
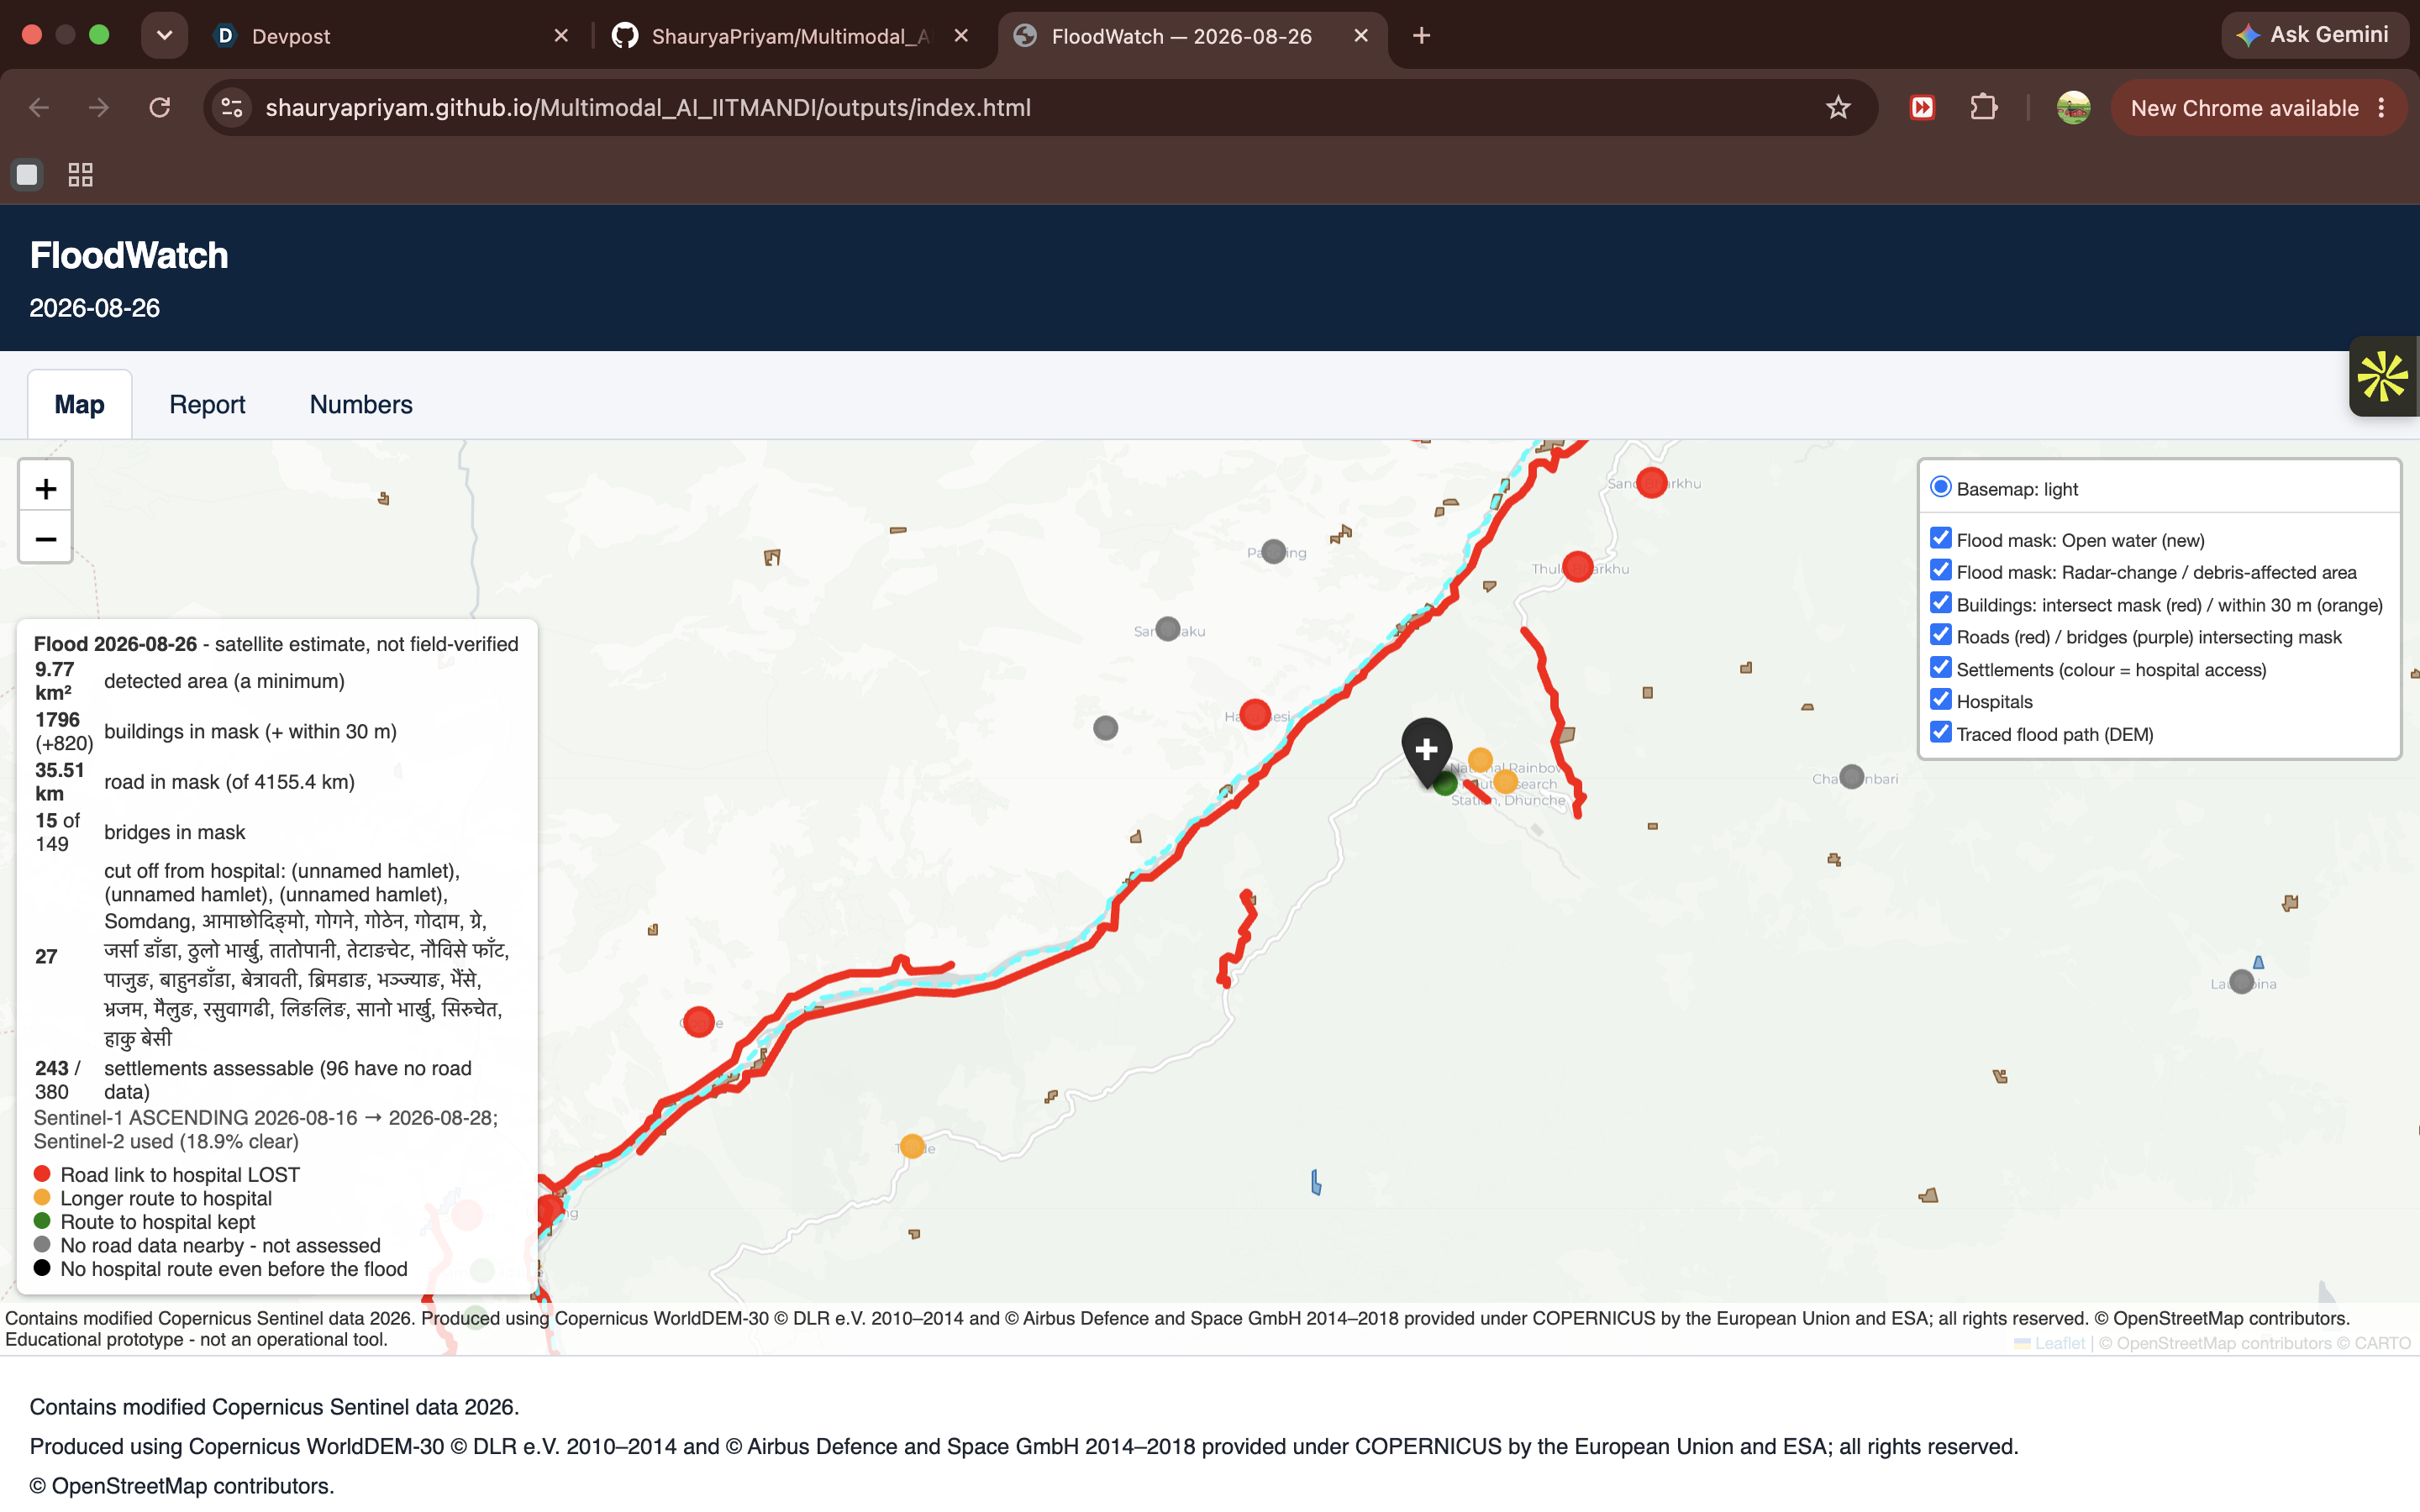
Dashboard map: a hamlet whose road link to a hospital is lost (red). The side panel shows the key numbers
-
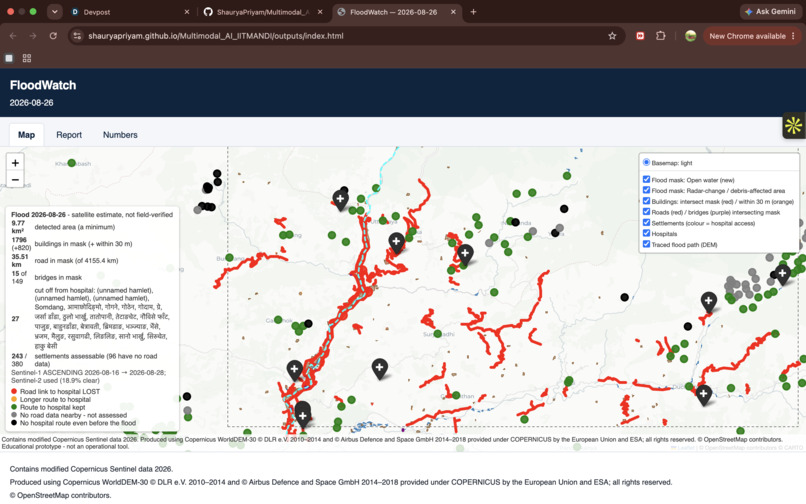
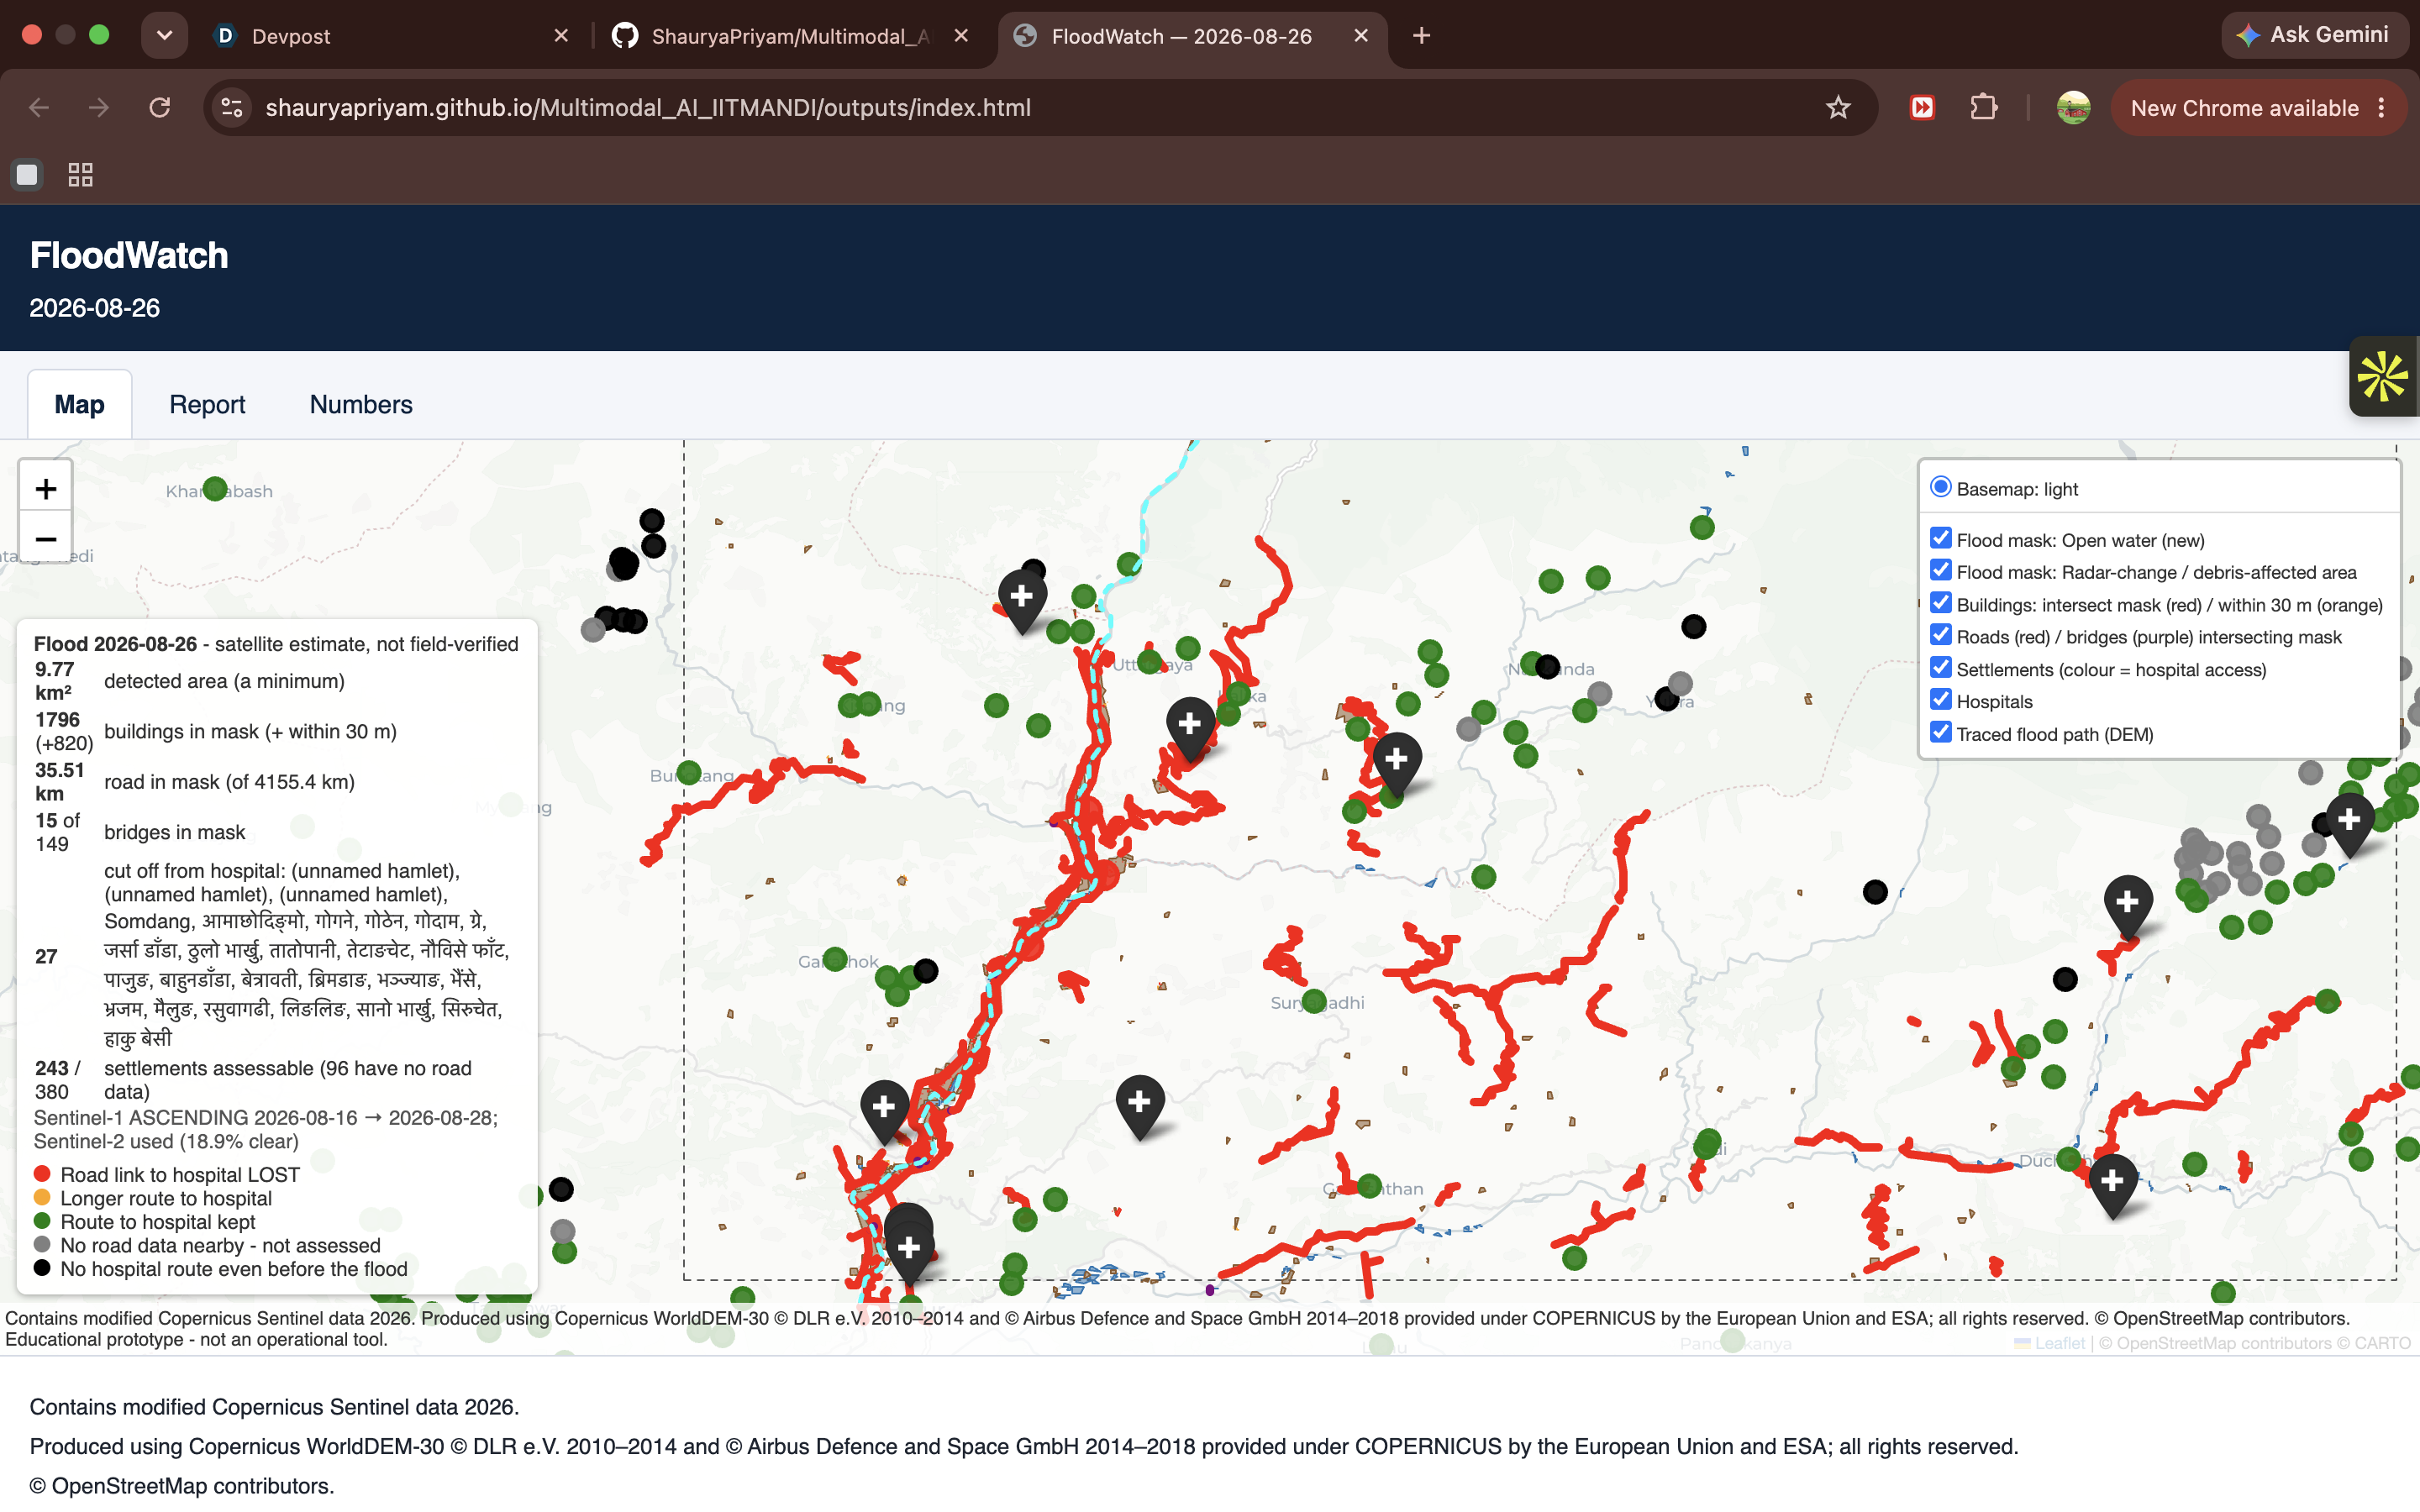
Dashboard overview: detected flood areas, affected roads in red, settlements coloured by hospital access, flood path in cyan
-
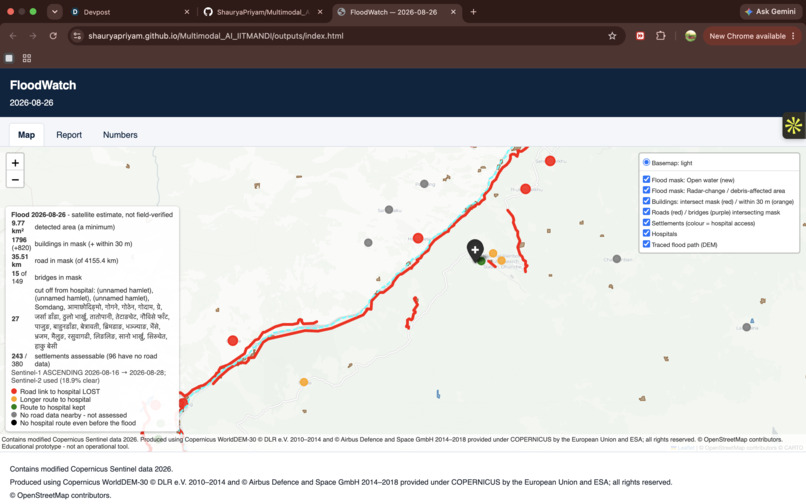
Dashboard near Dhunche: green settlements keep their hospital route, orange ones now have a longer route.
-
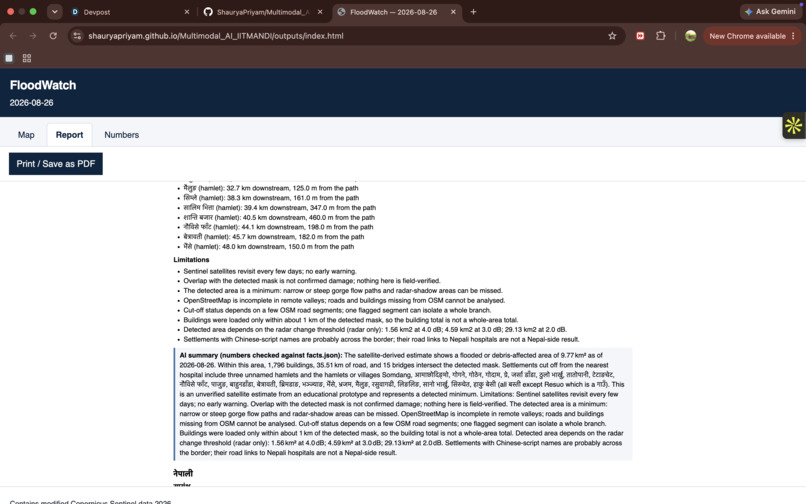
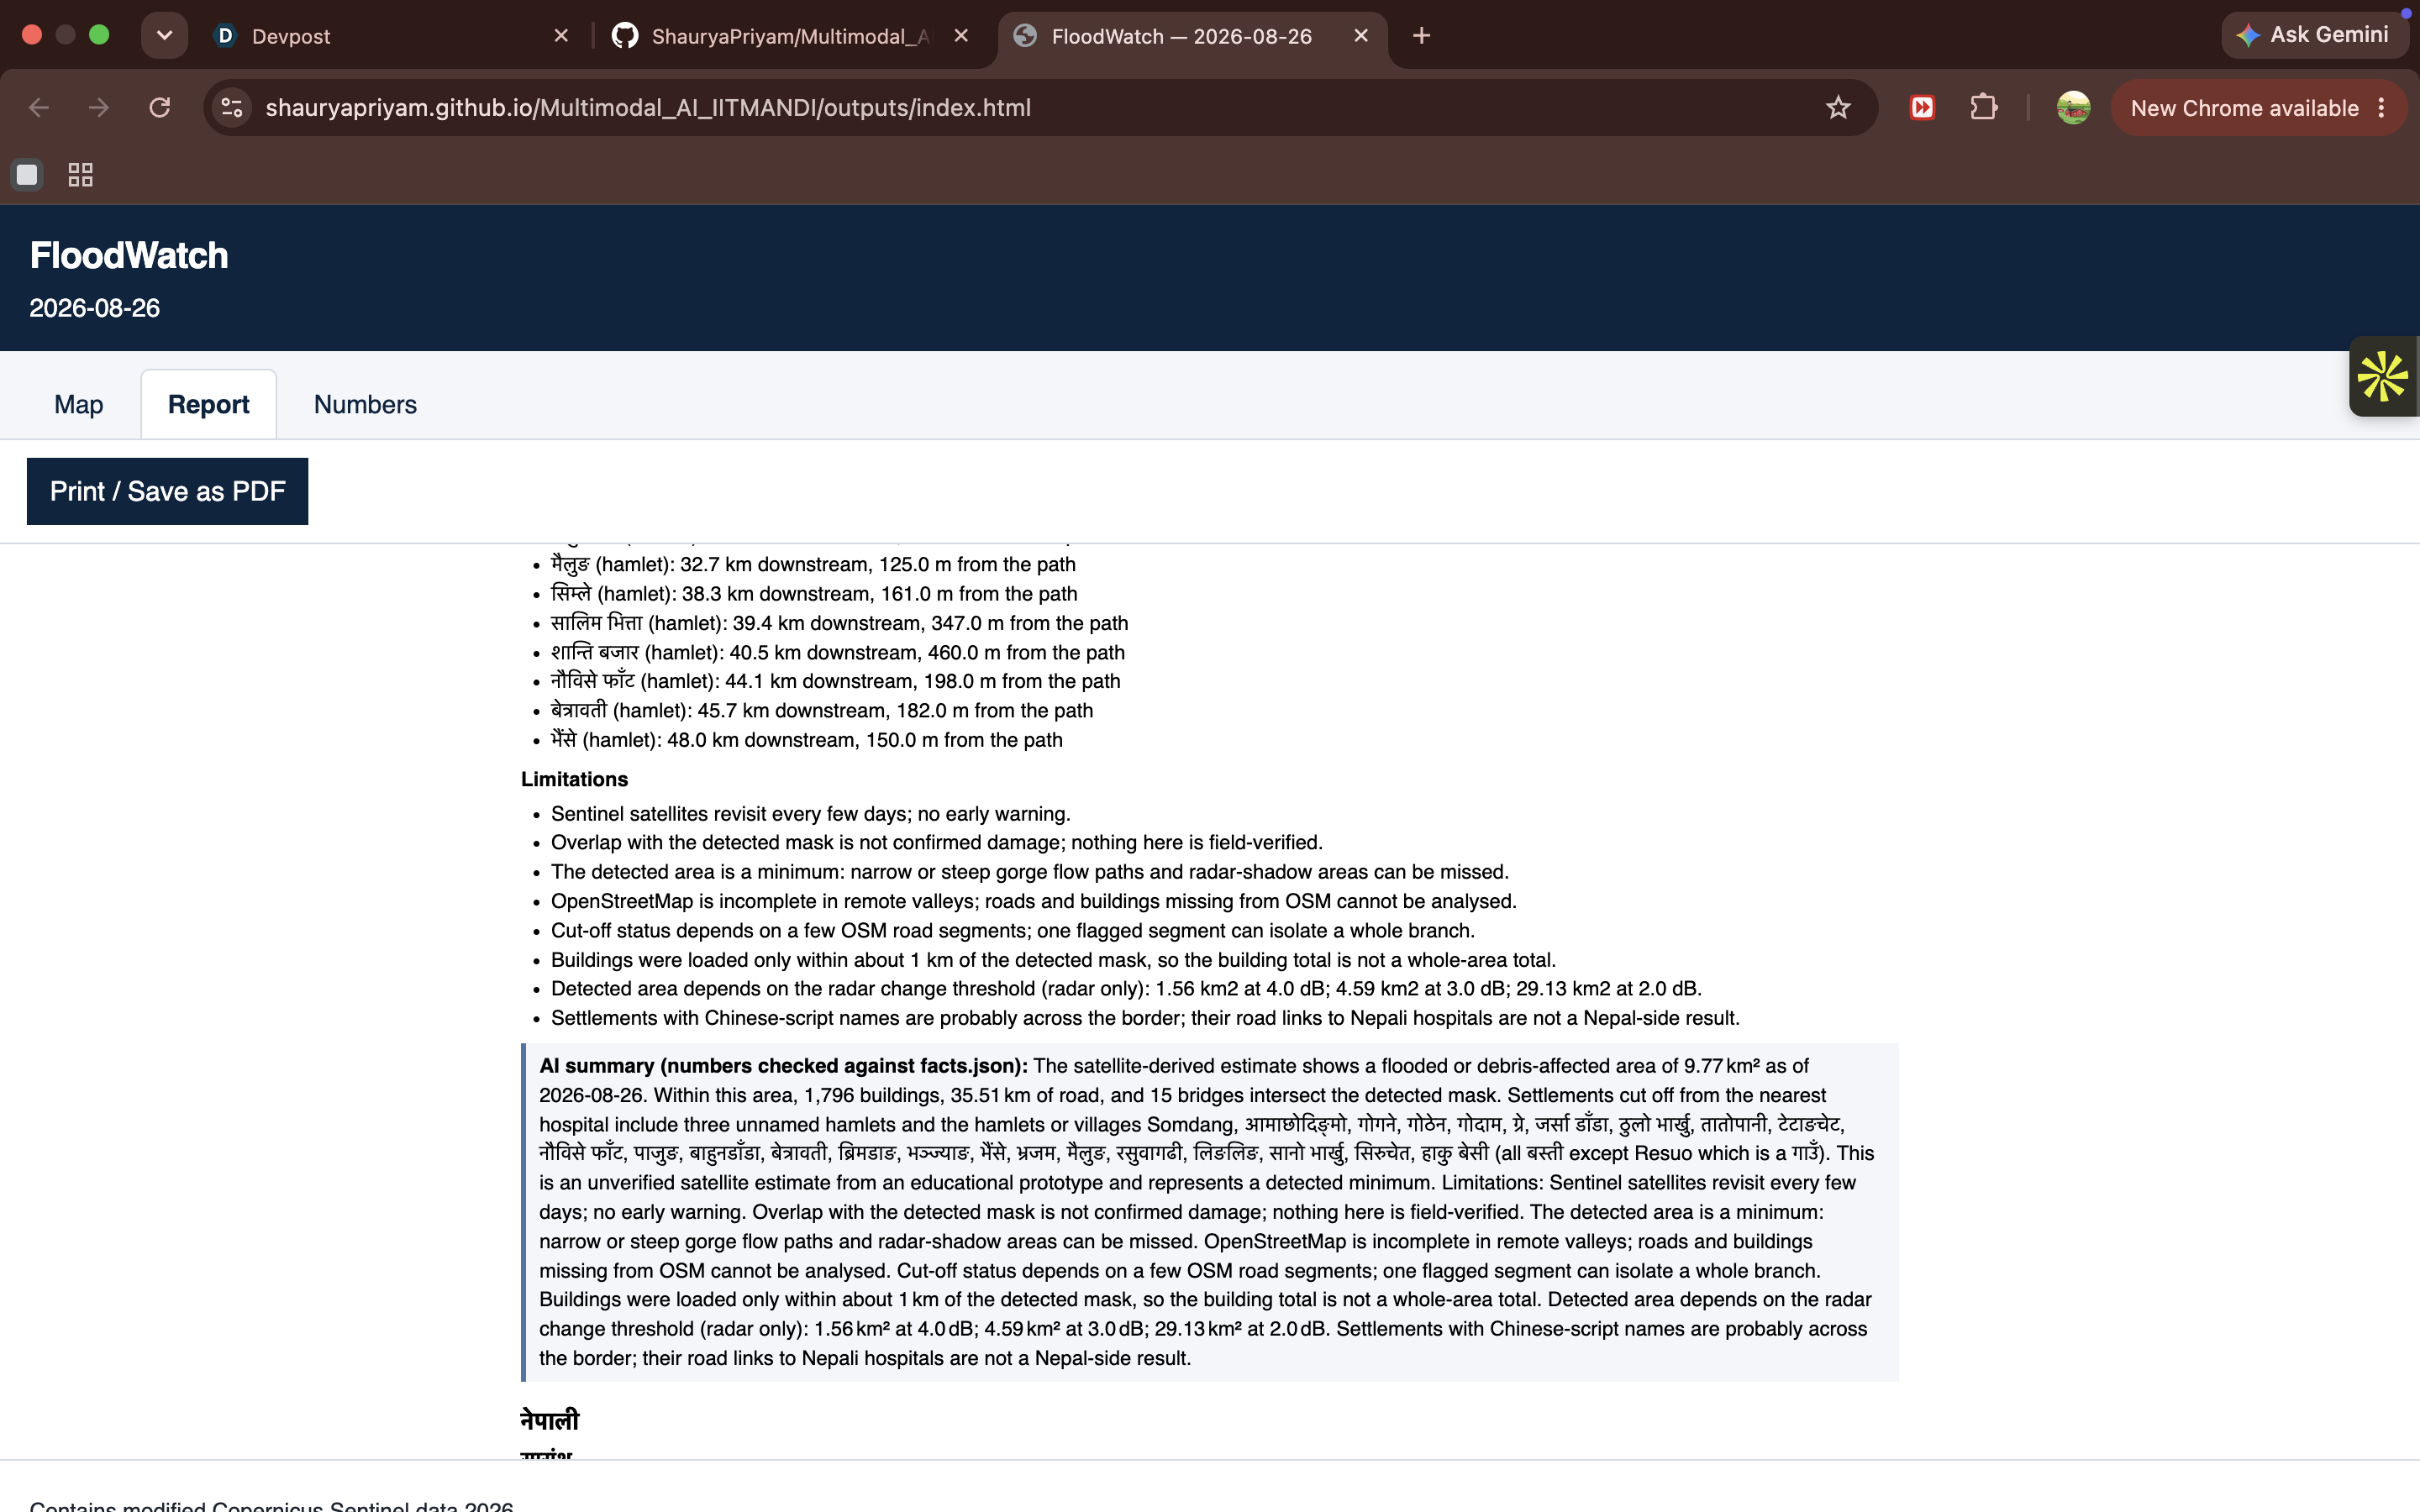
Situation report: system limitations and an AI summary with numbers checked against facts.json.
-
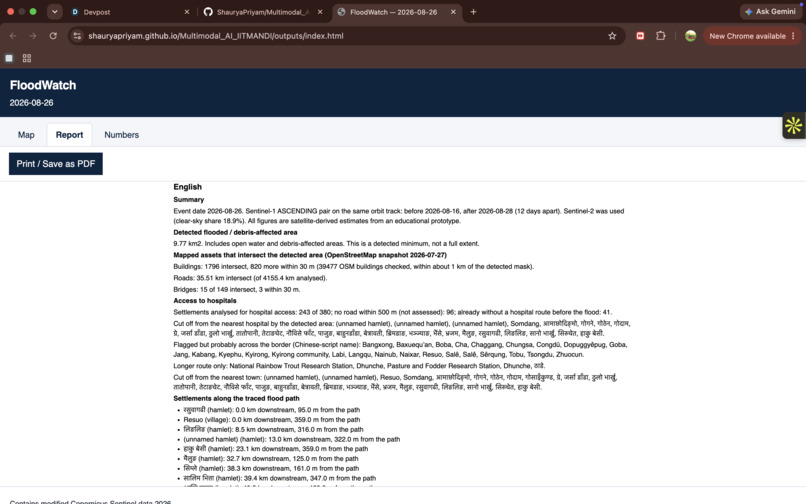
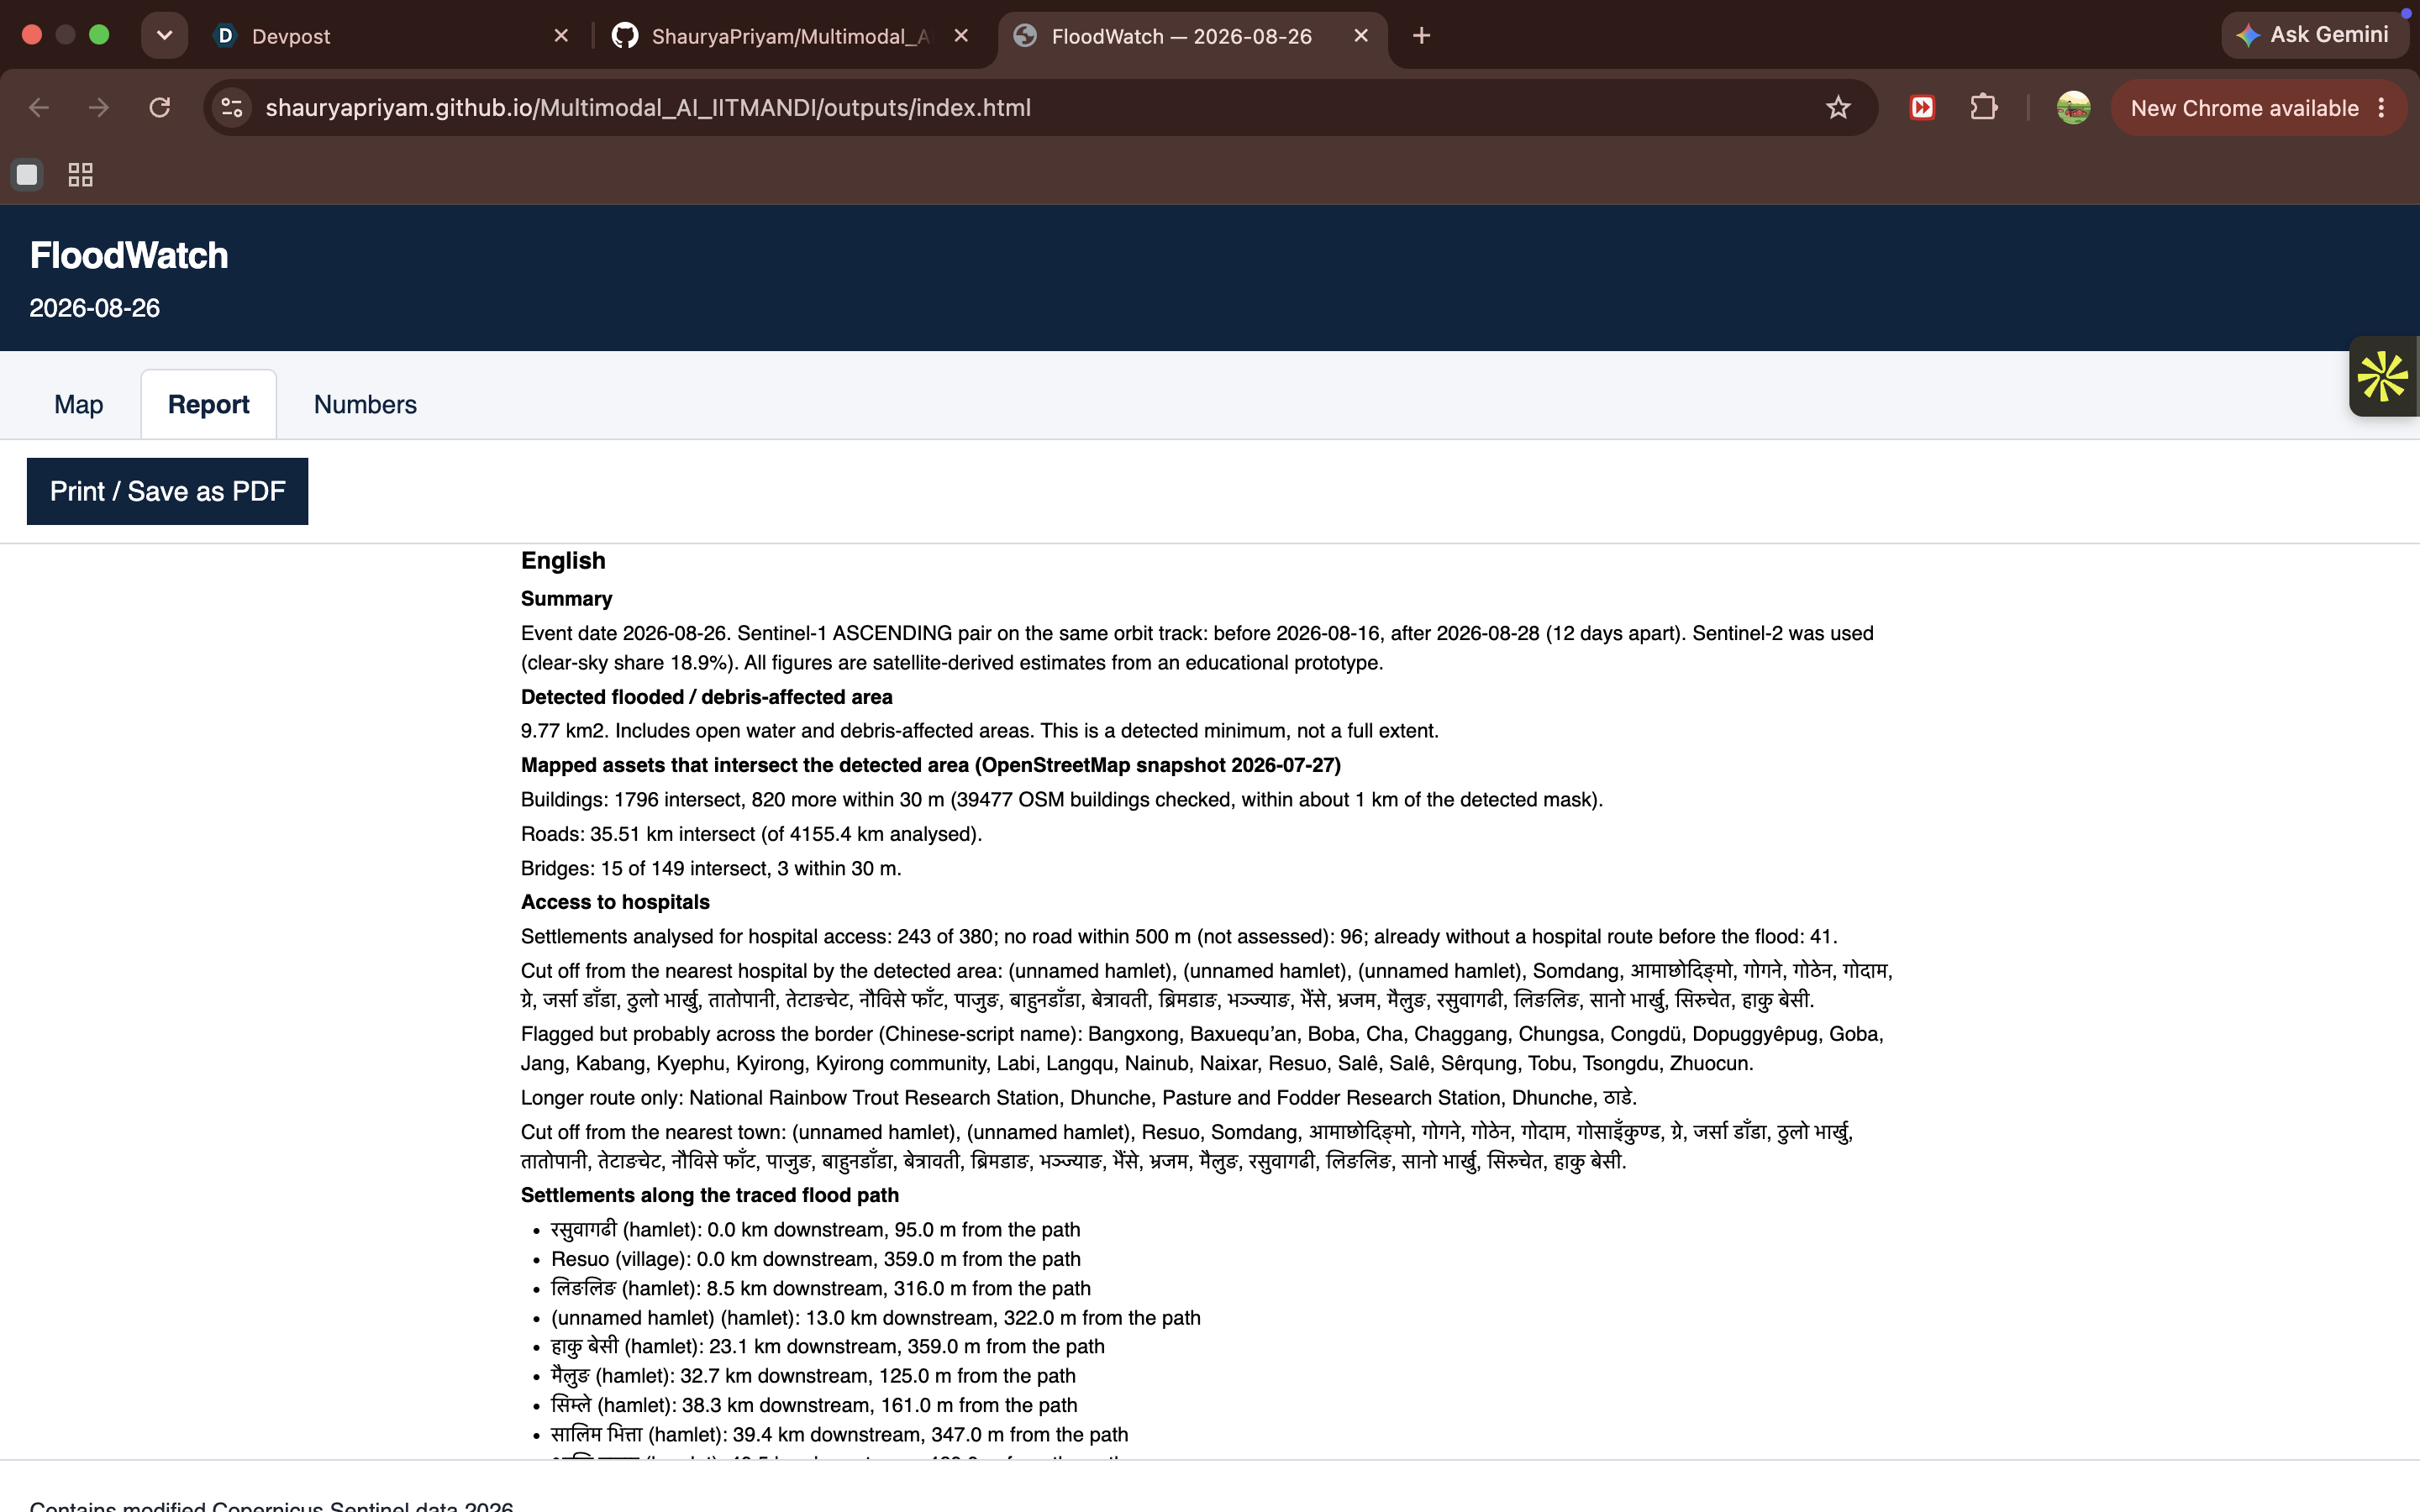
Situation report (English): imagery dates, mapped assets hit, hospital access and settlements along the flood path.
-
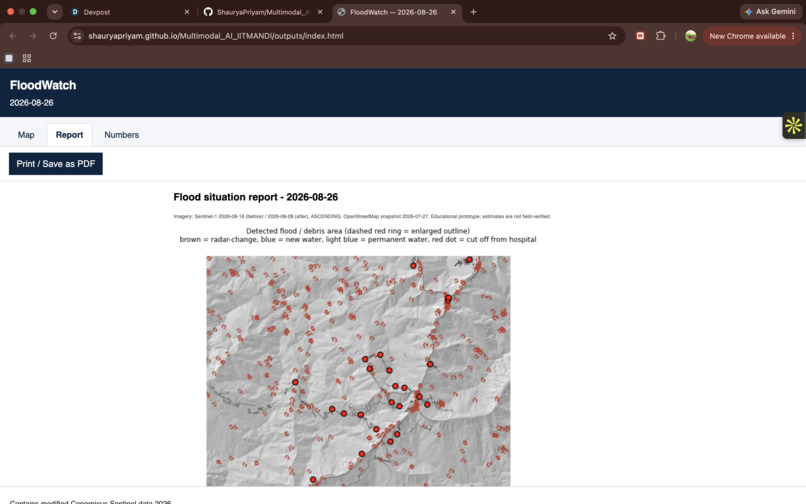
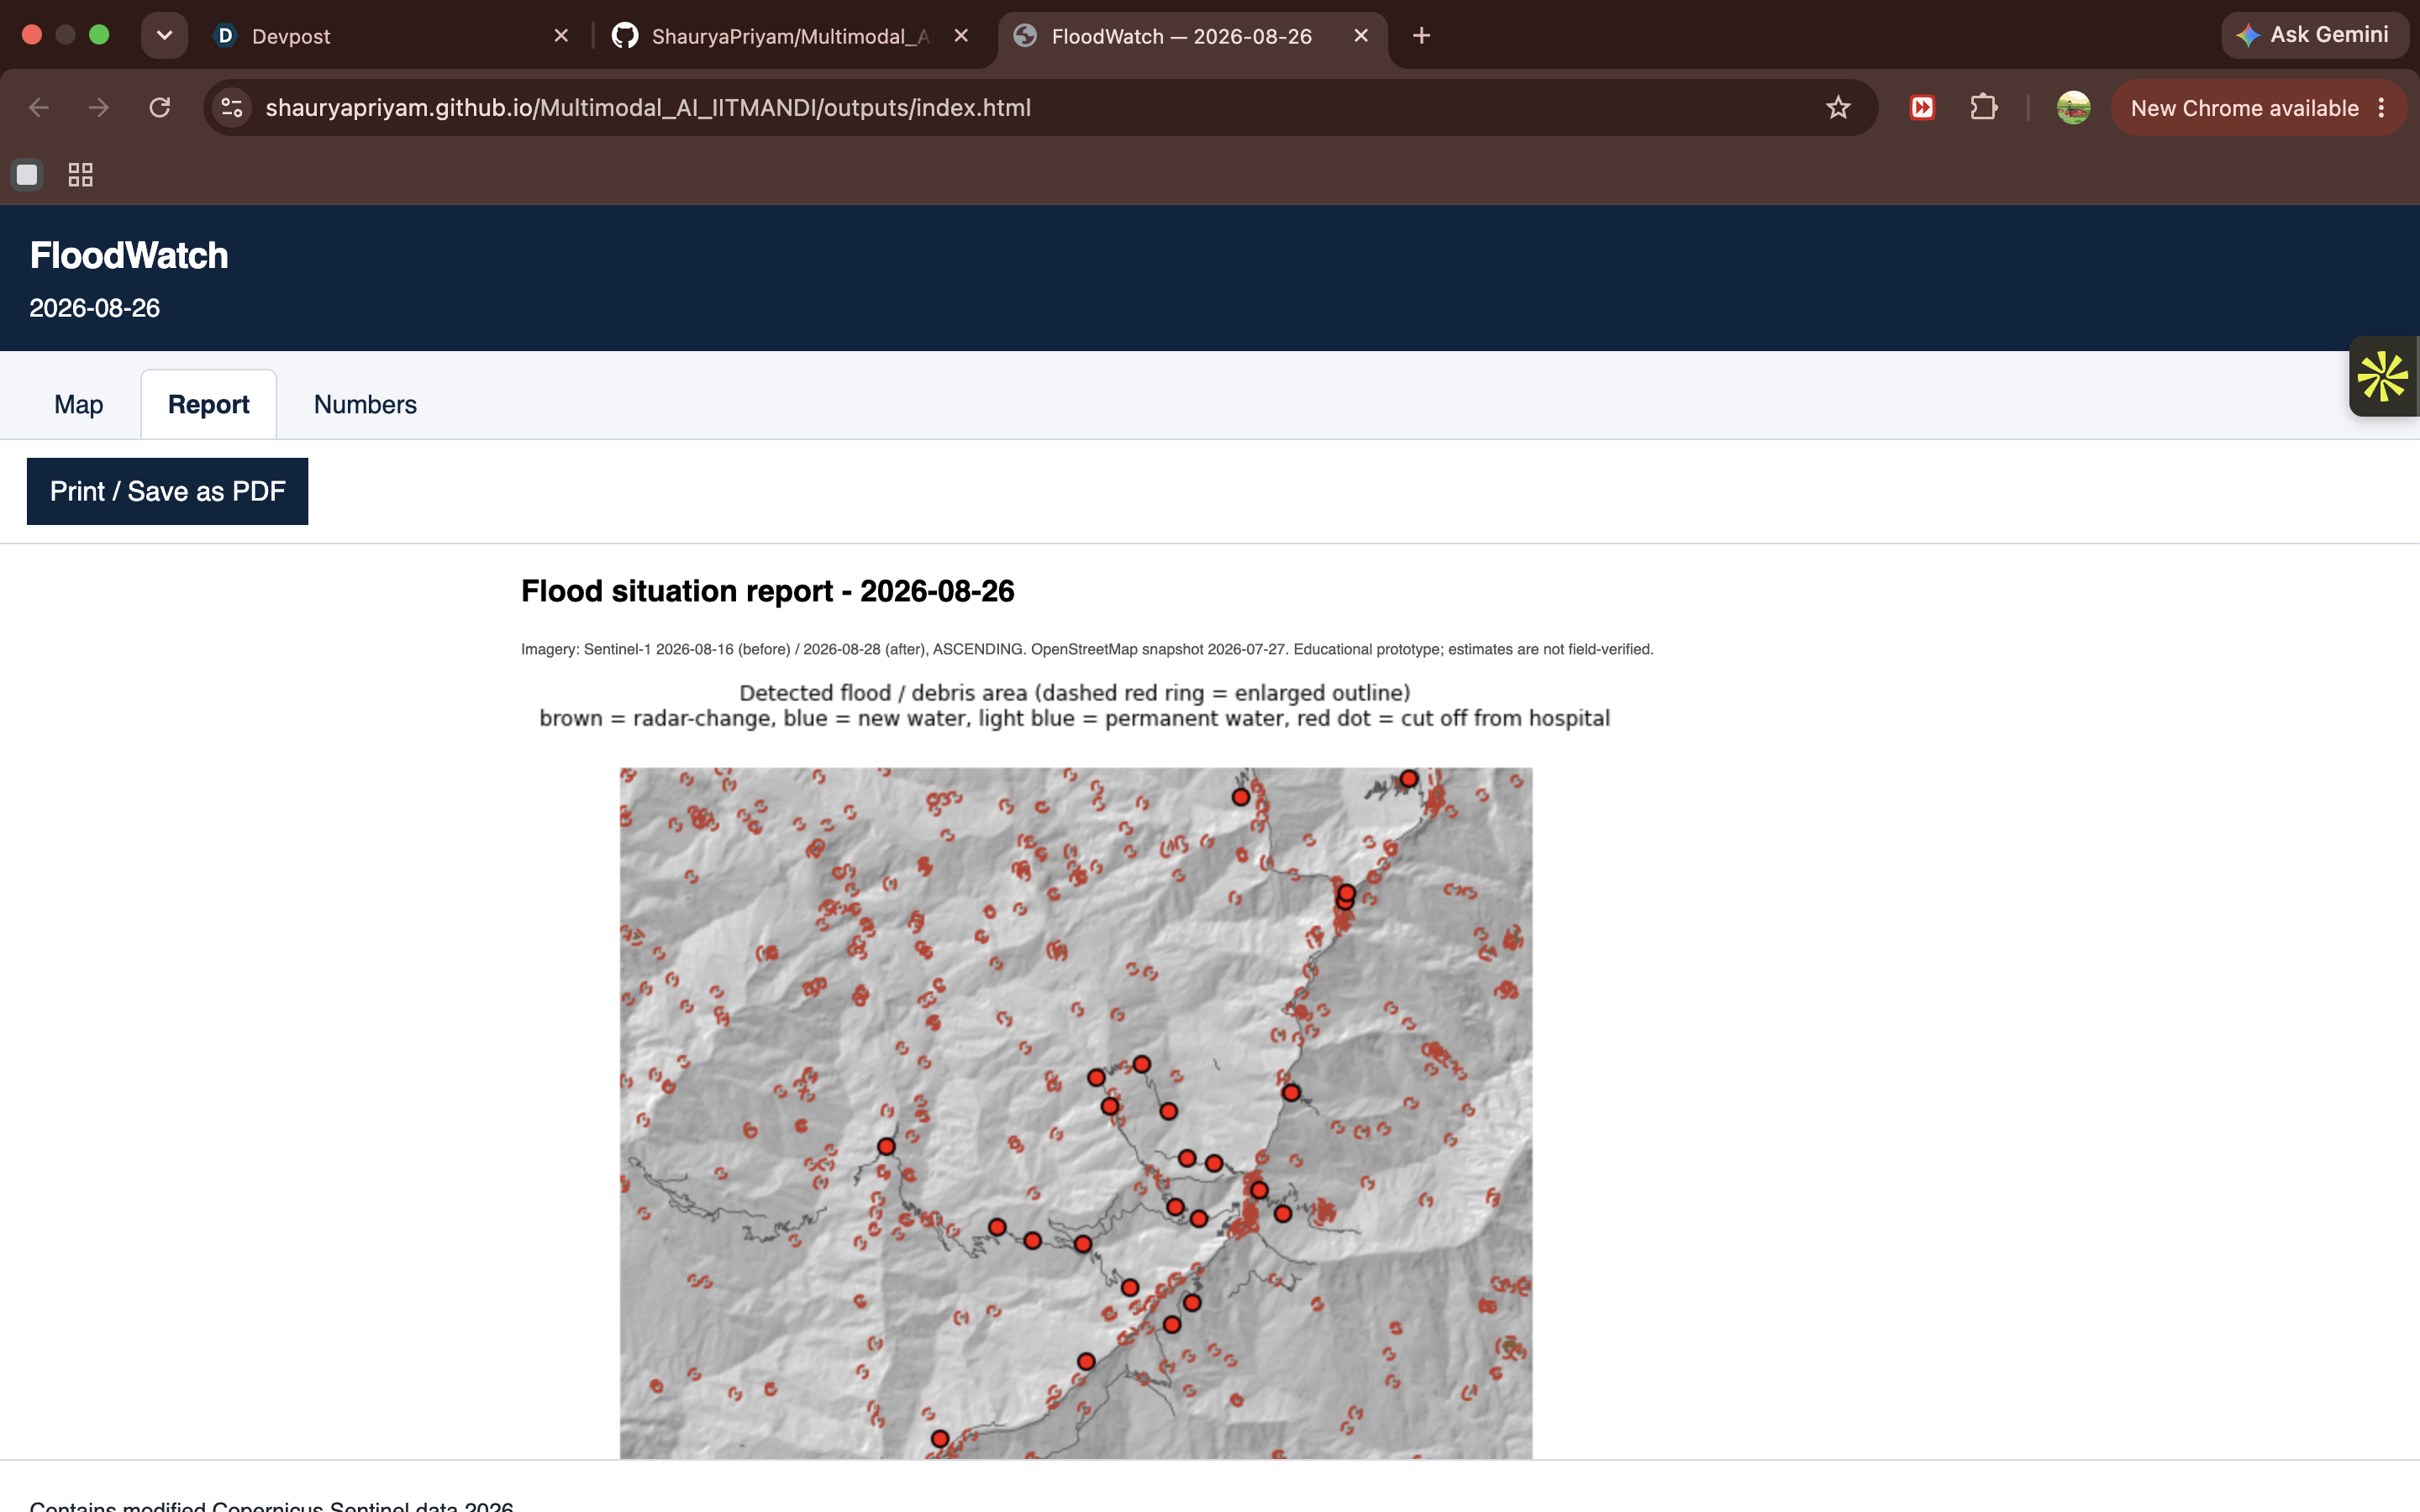
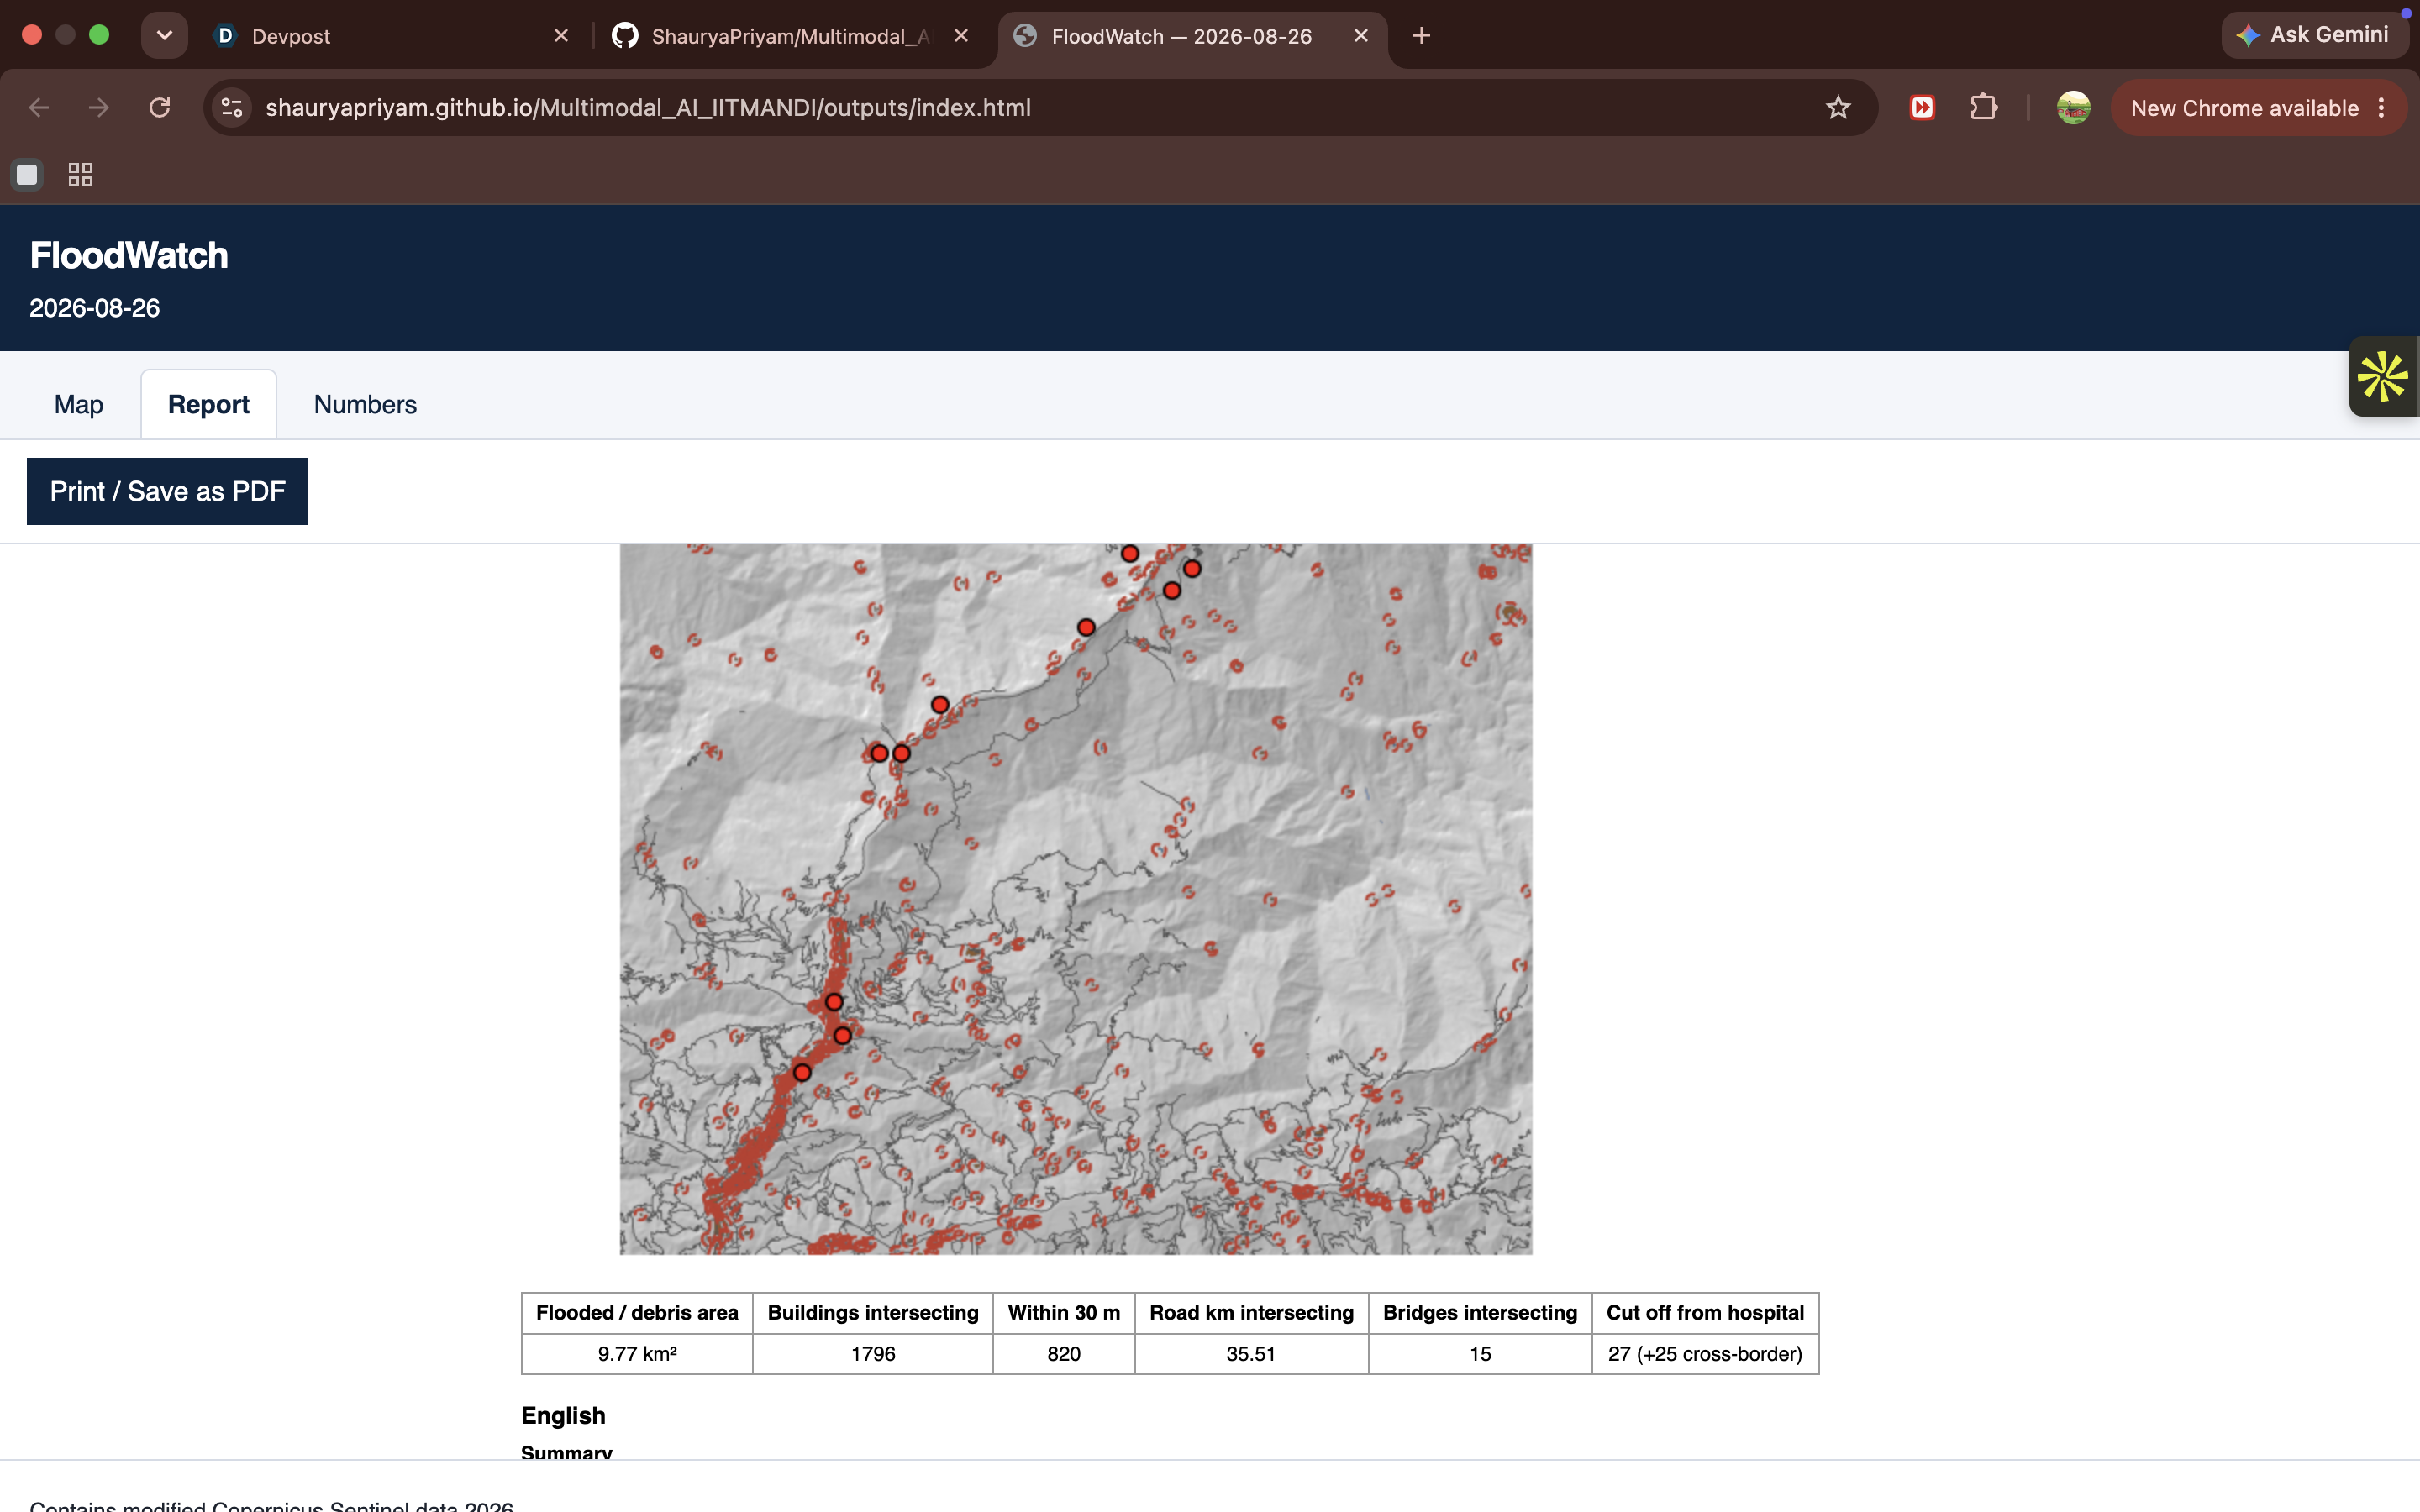
Situation report: detected flood and debris areas on shaded terrain. Red dots are settlements cut off from a hospital.
-
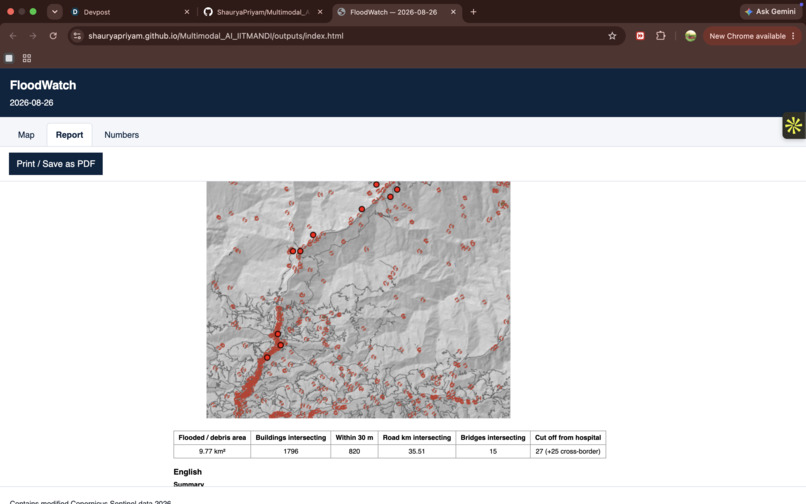
Situation report: 9.77 km² detected, 1,796 buildings, 35.51 km of road, 15 bridges hit, 27 settlements cut off from a hospital.
-
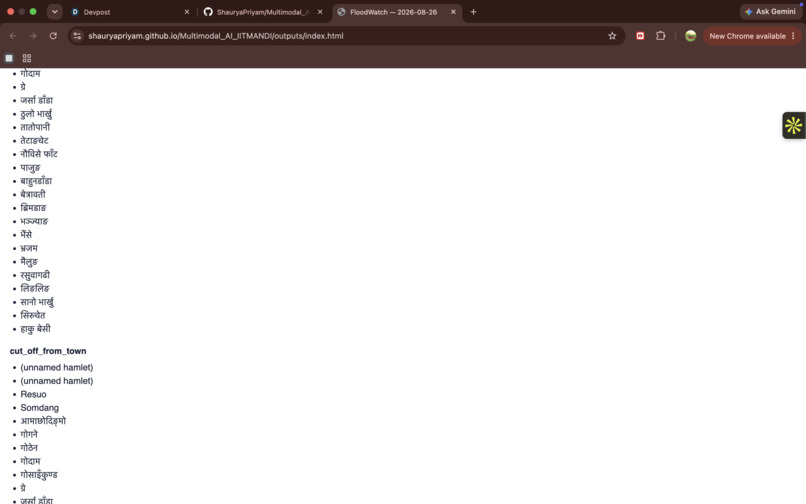
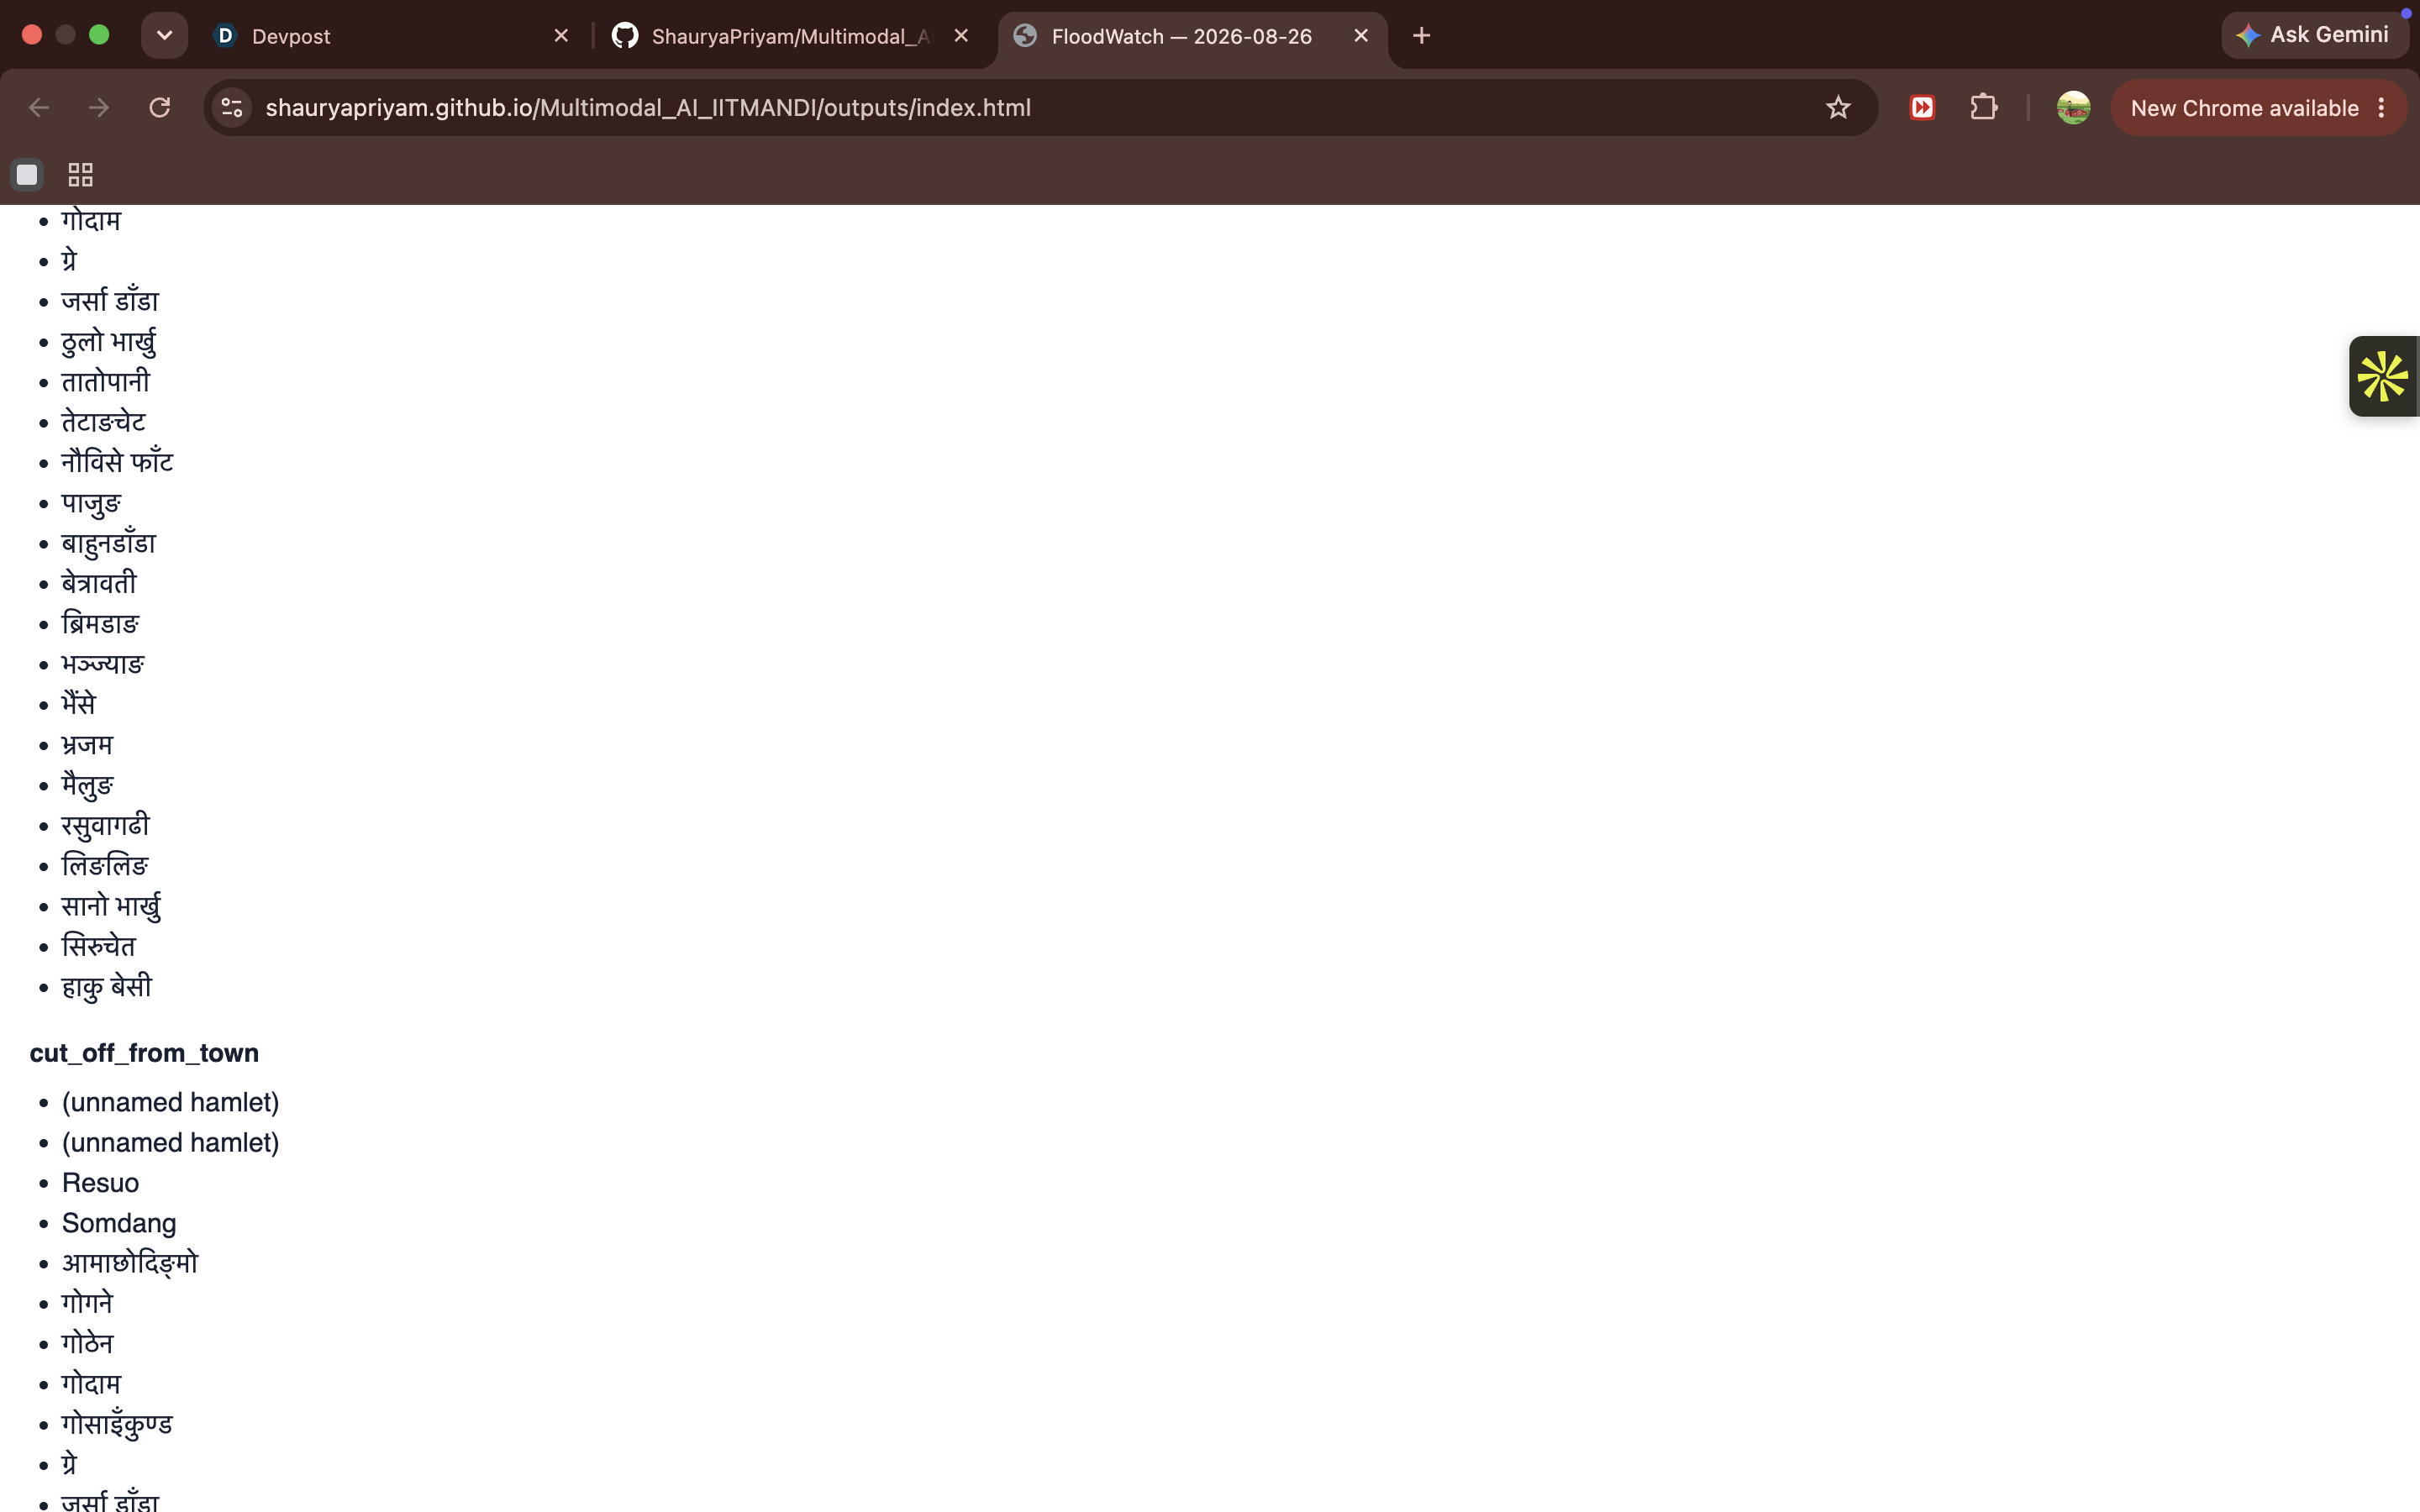
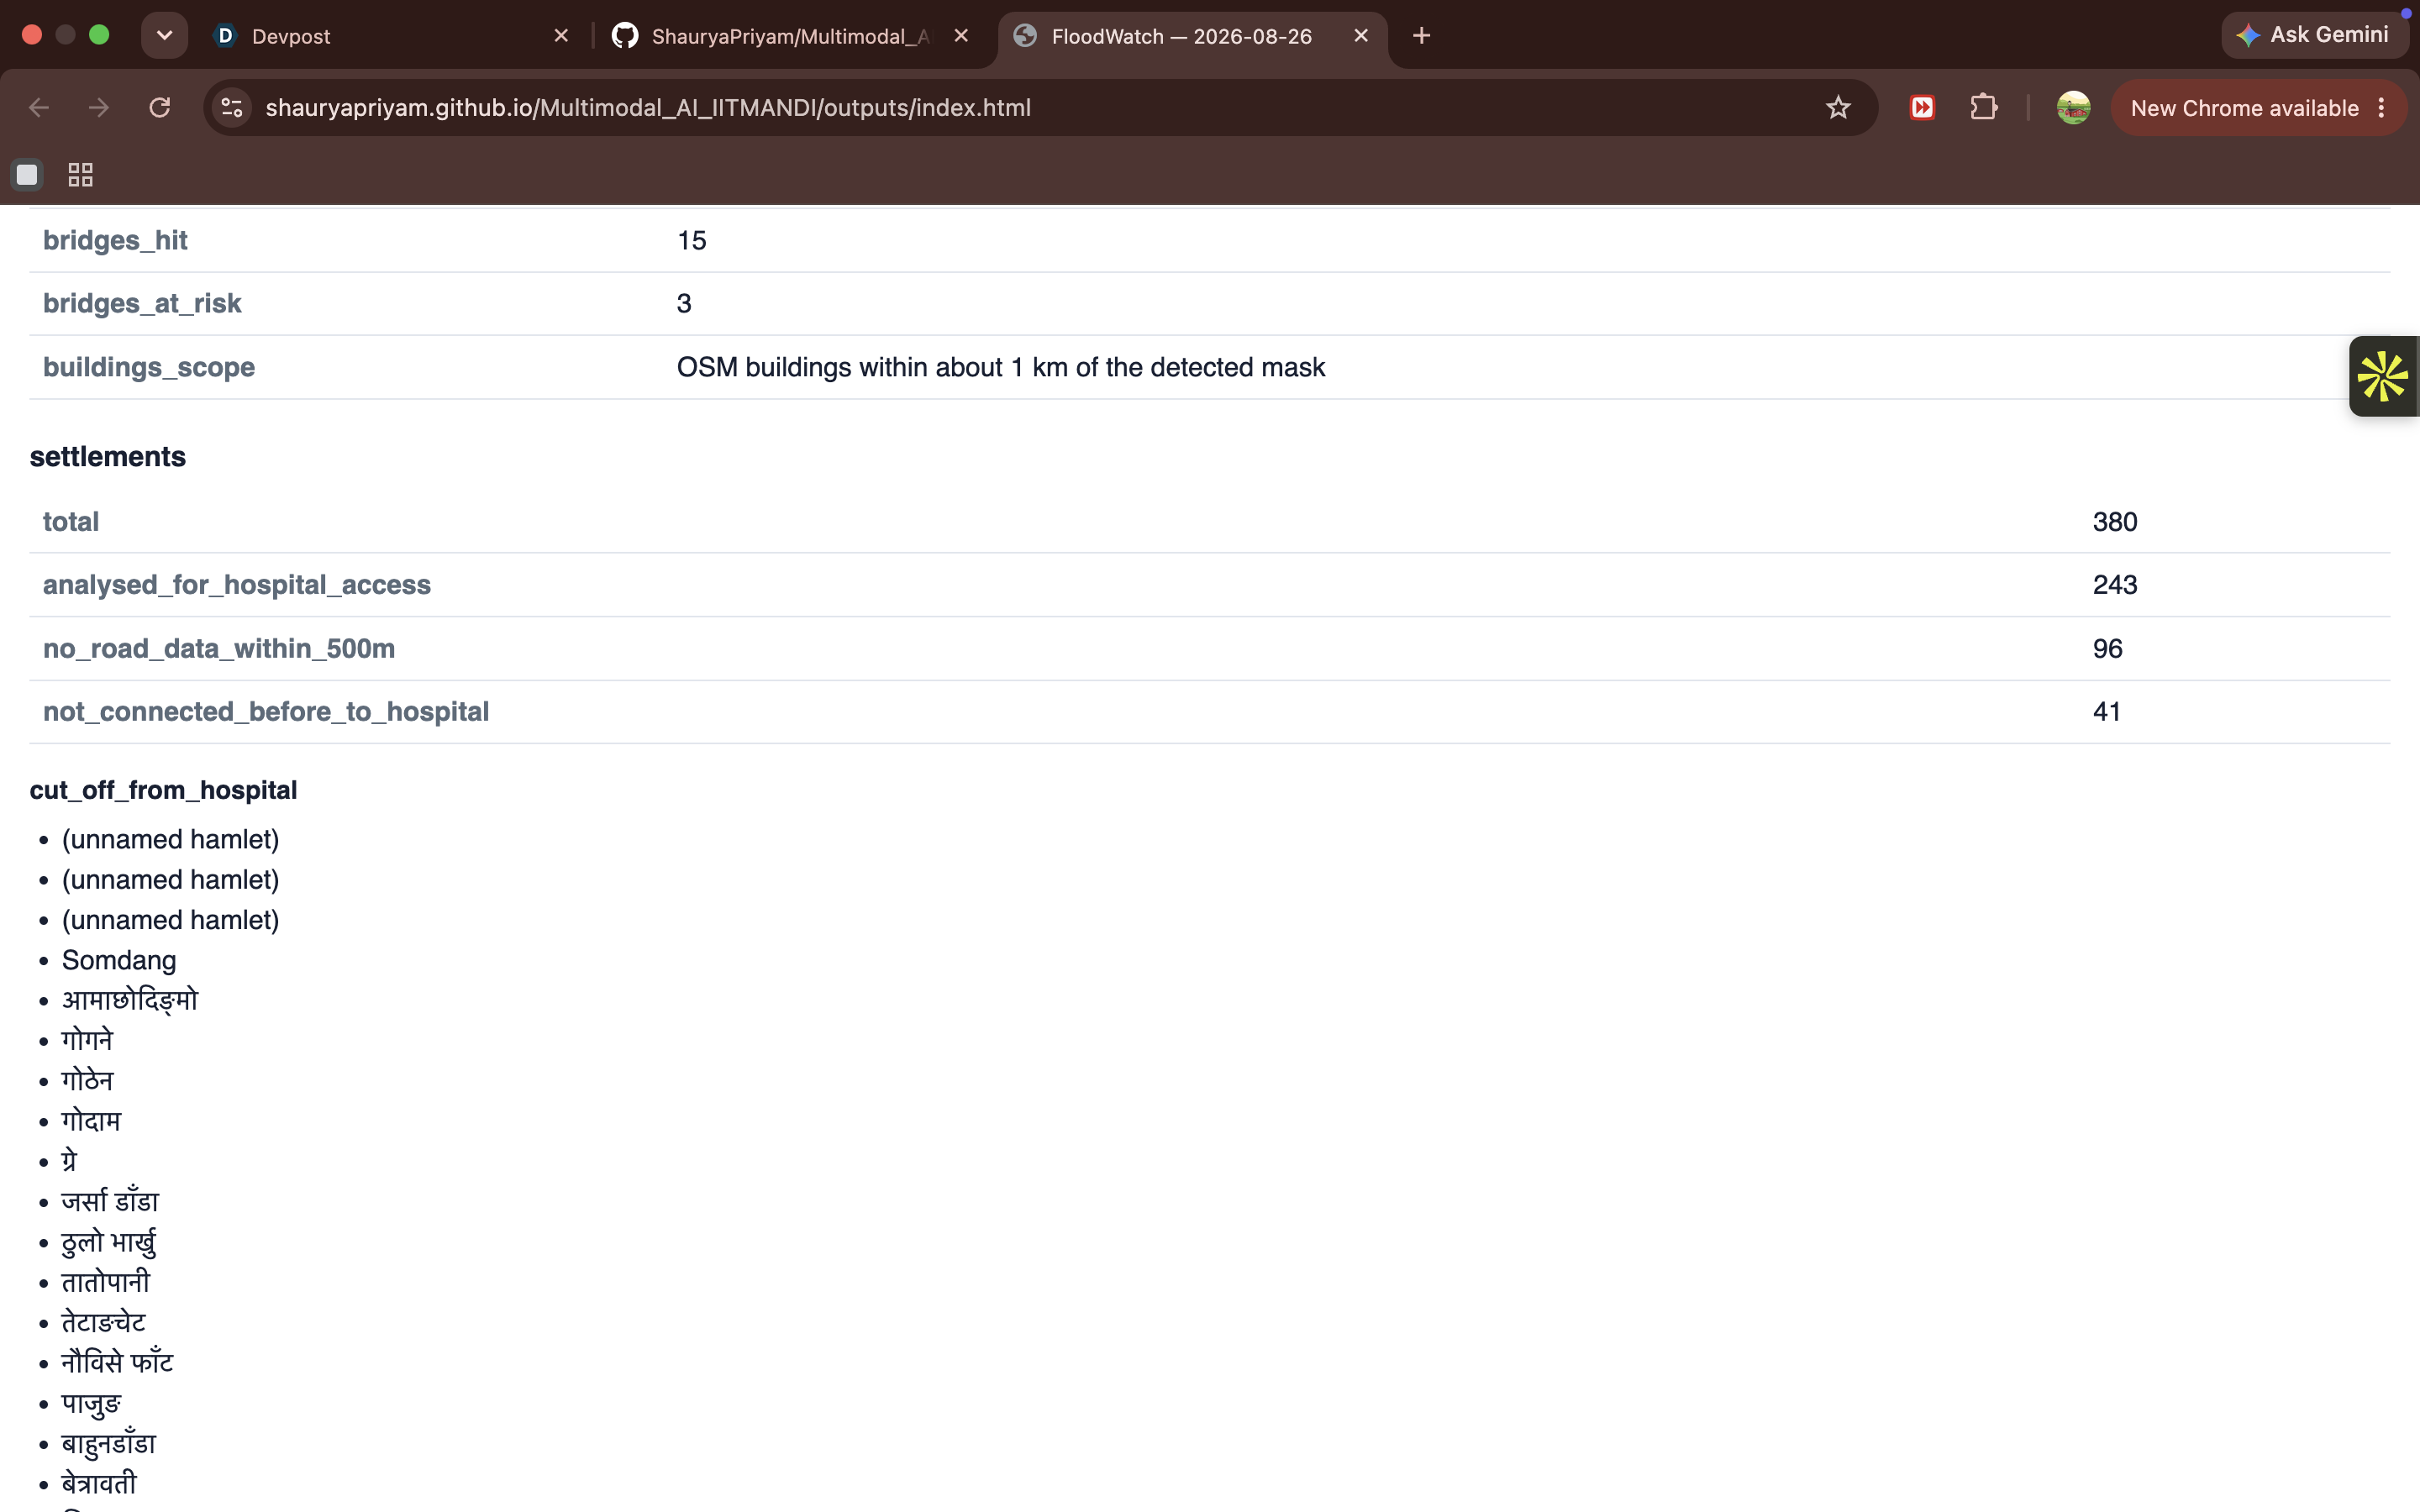
Numbers tab: settlements cut off from a hospital and from the nearest town.
-
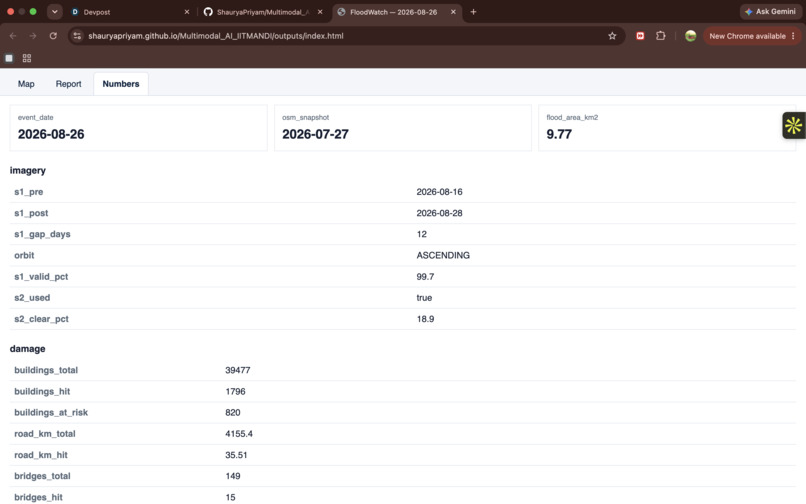
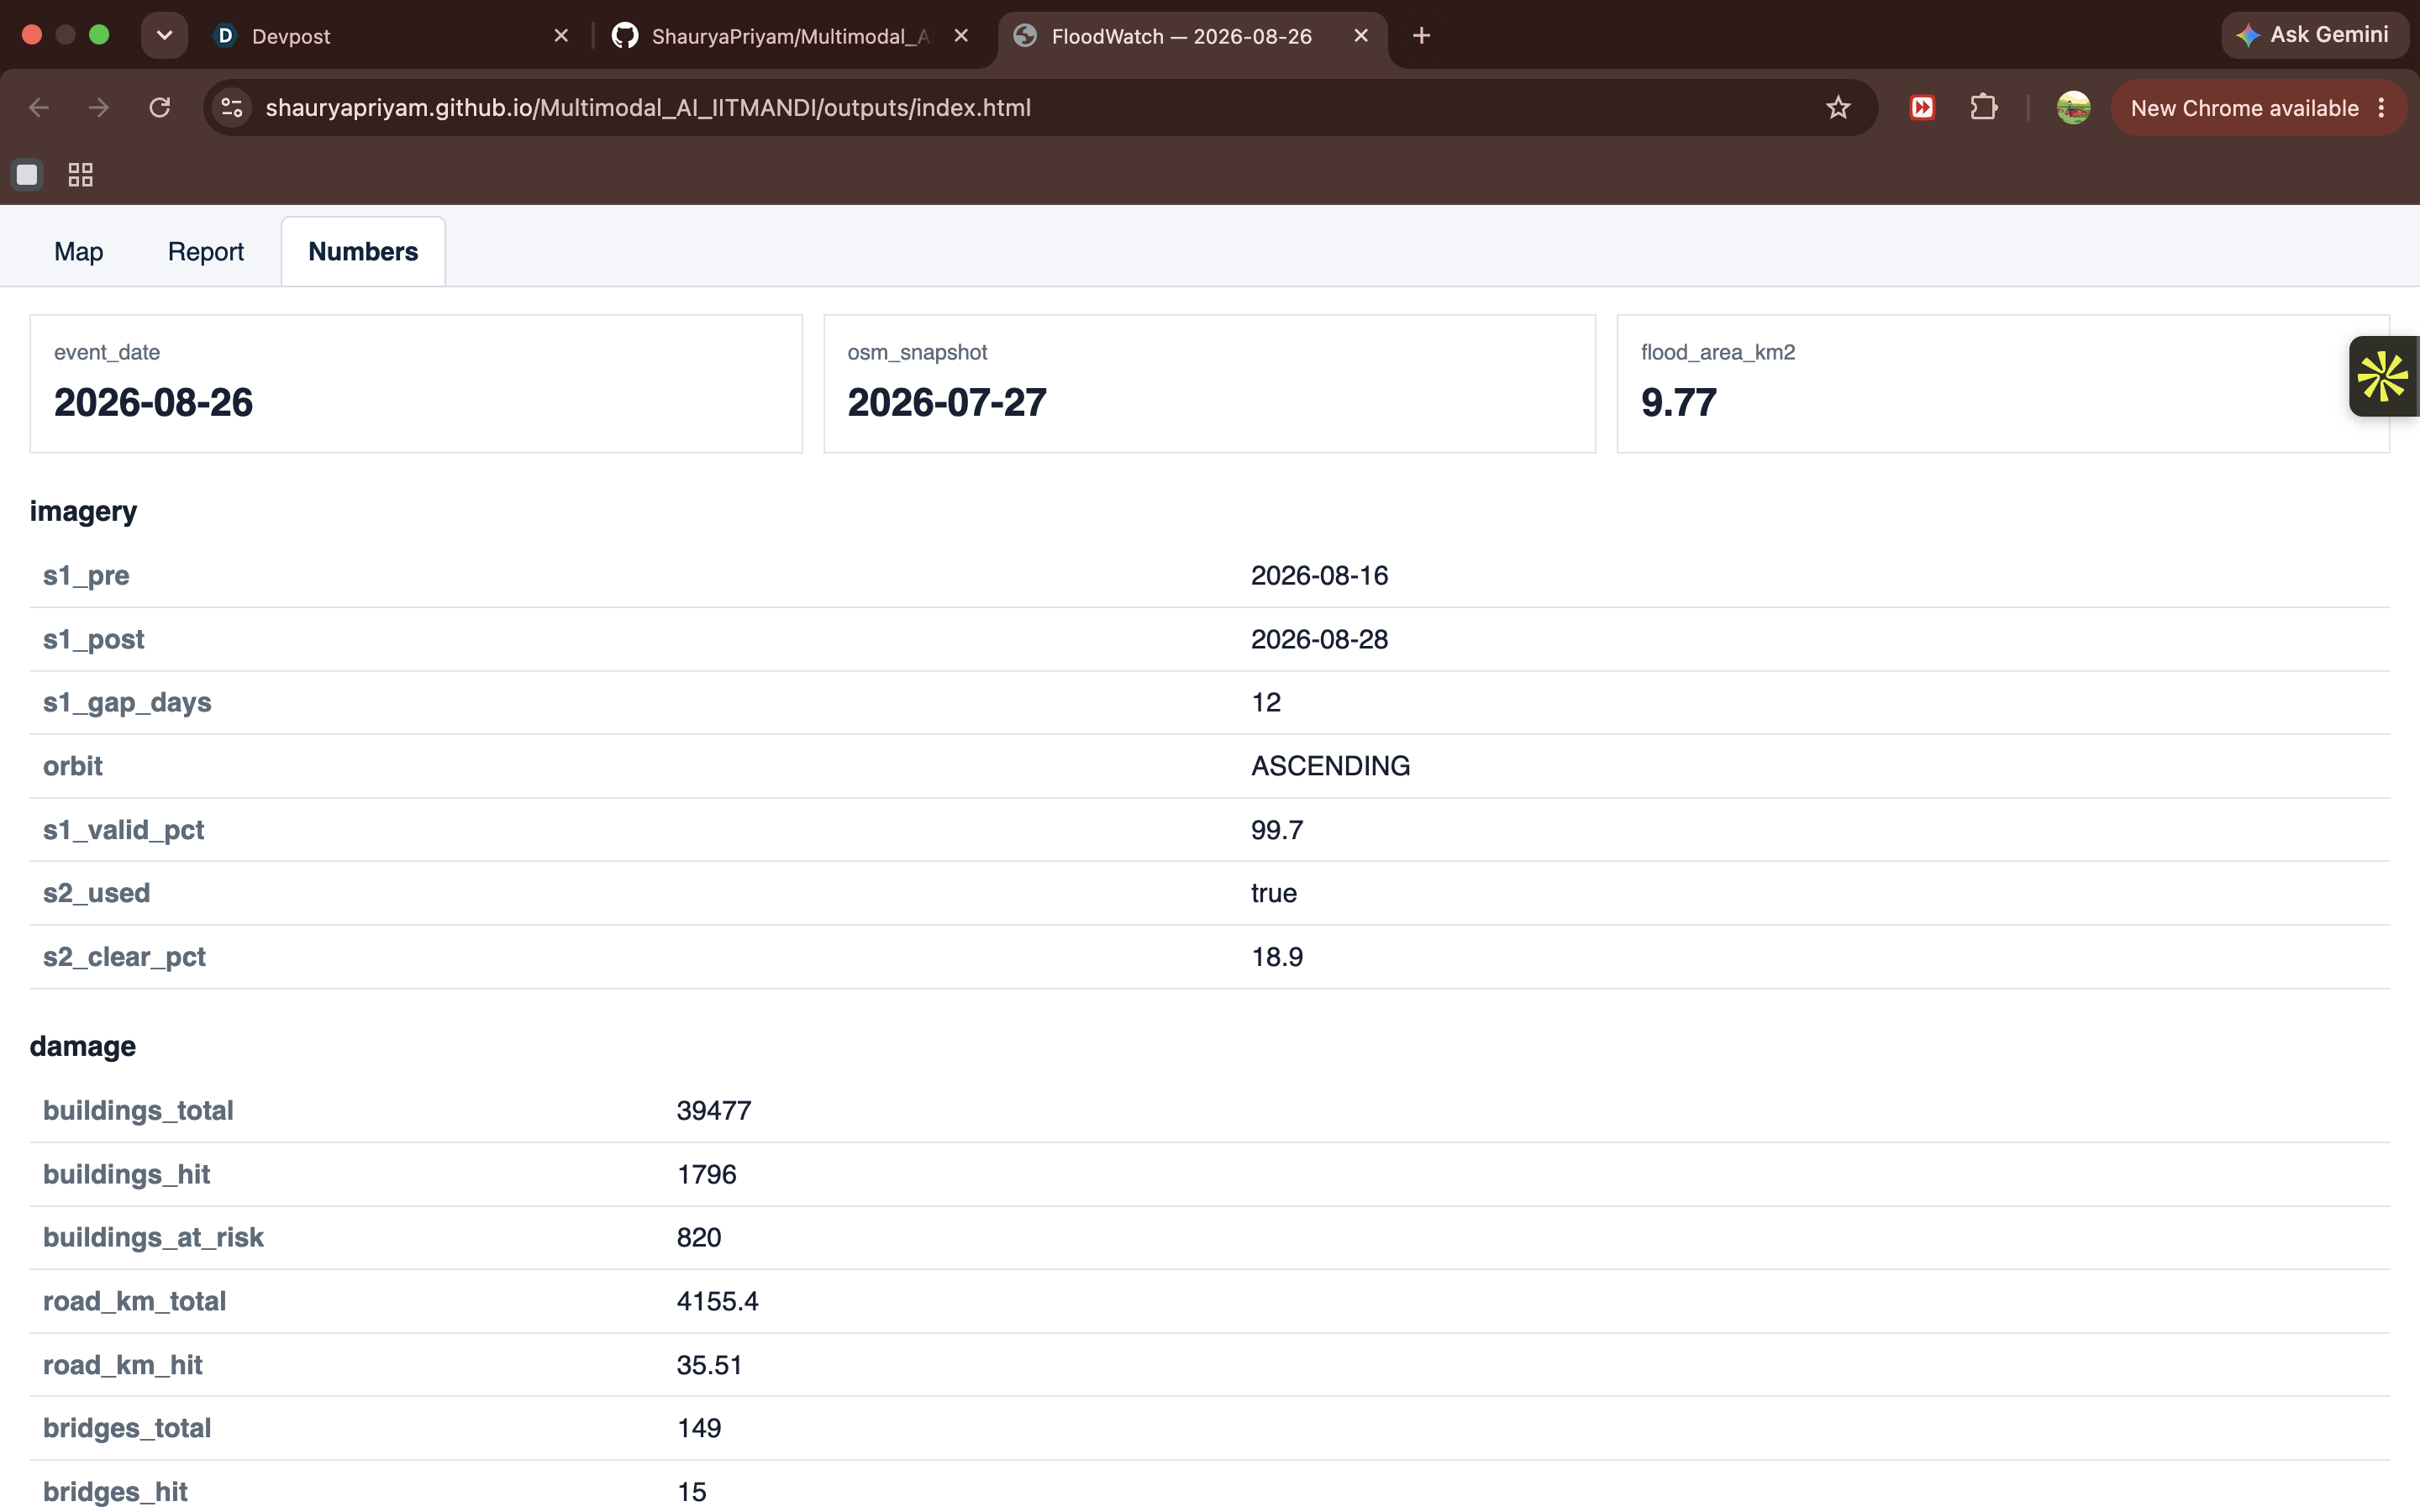
Numbers tab: Sentinel-1 pair 12 days apart, OSM snapshot of 27 July 2026, and building, road and bridge counts.
-
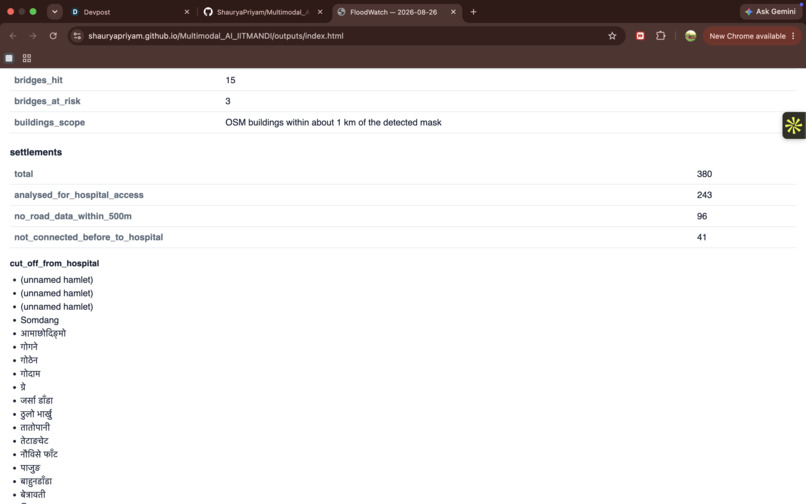
Numbers tab: 380 settlements, 243 analysed for hospital access, 96 with no road data nearby
-
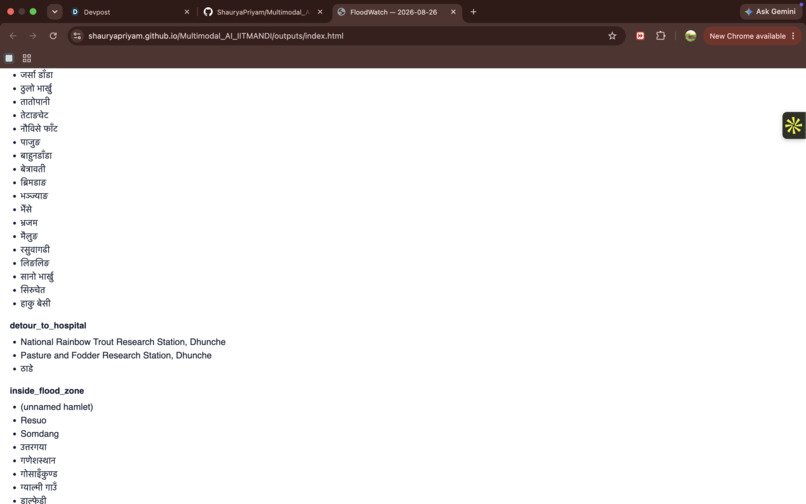
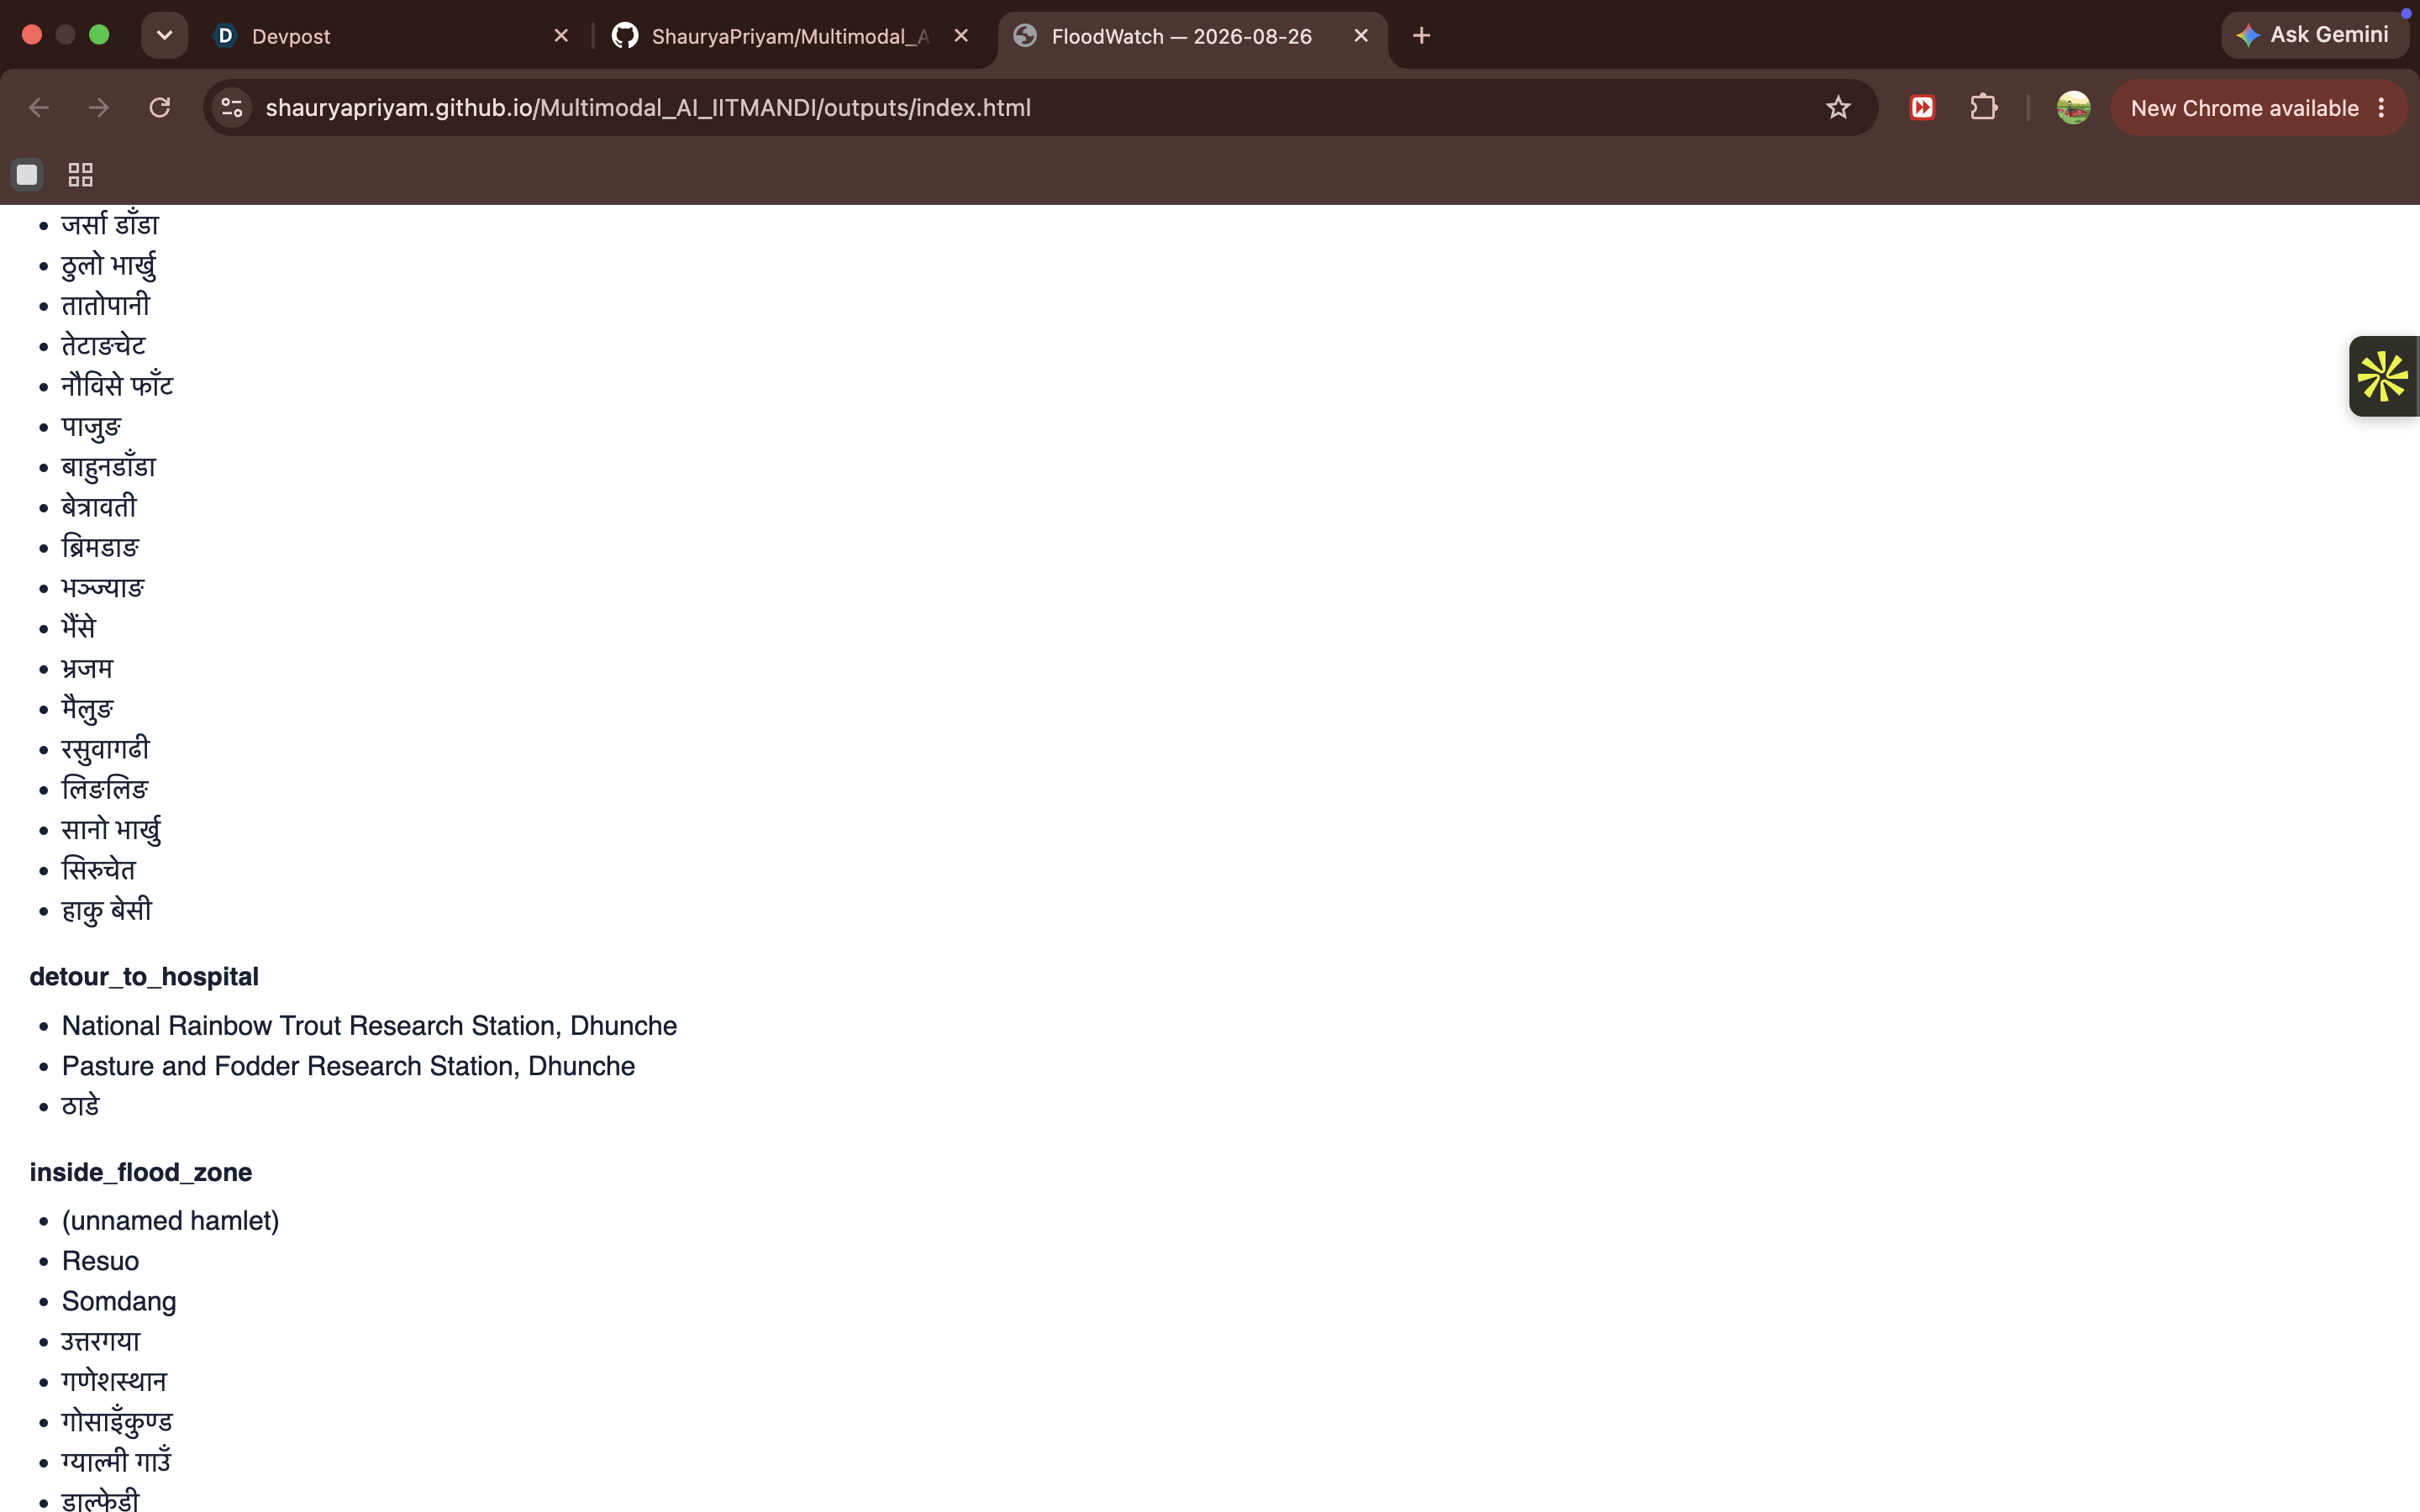
Numbers tab: settlements with a longer route to a hospital, and settlements inside the flood zone.
-
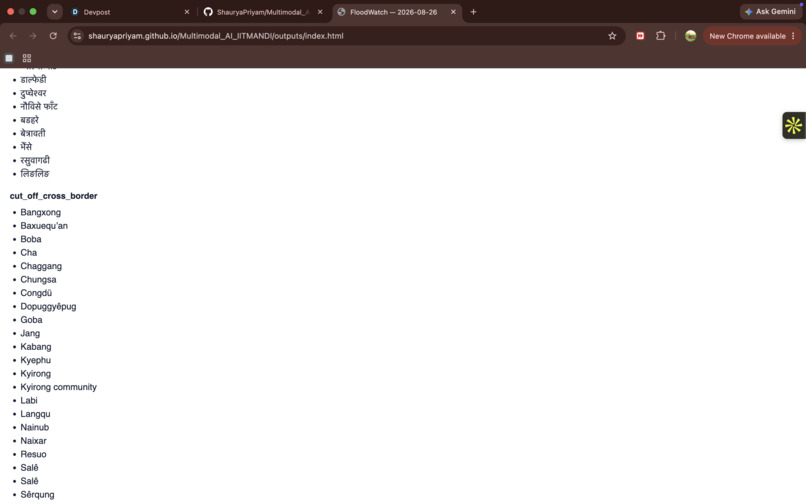
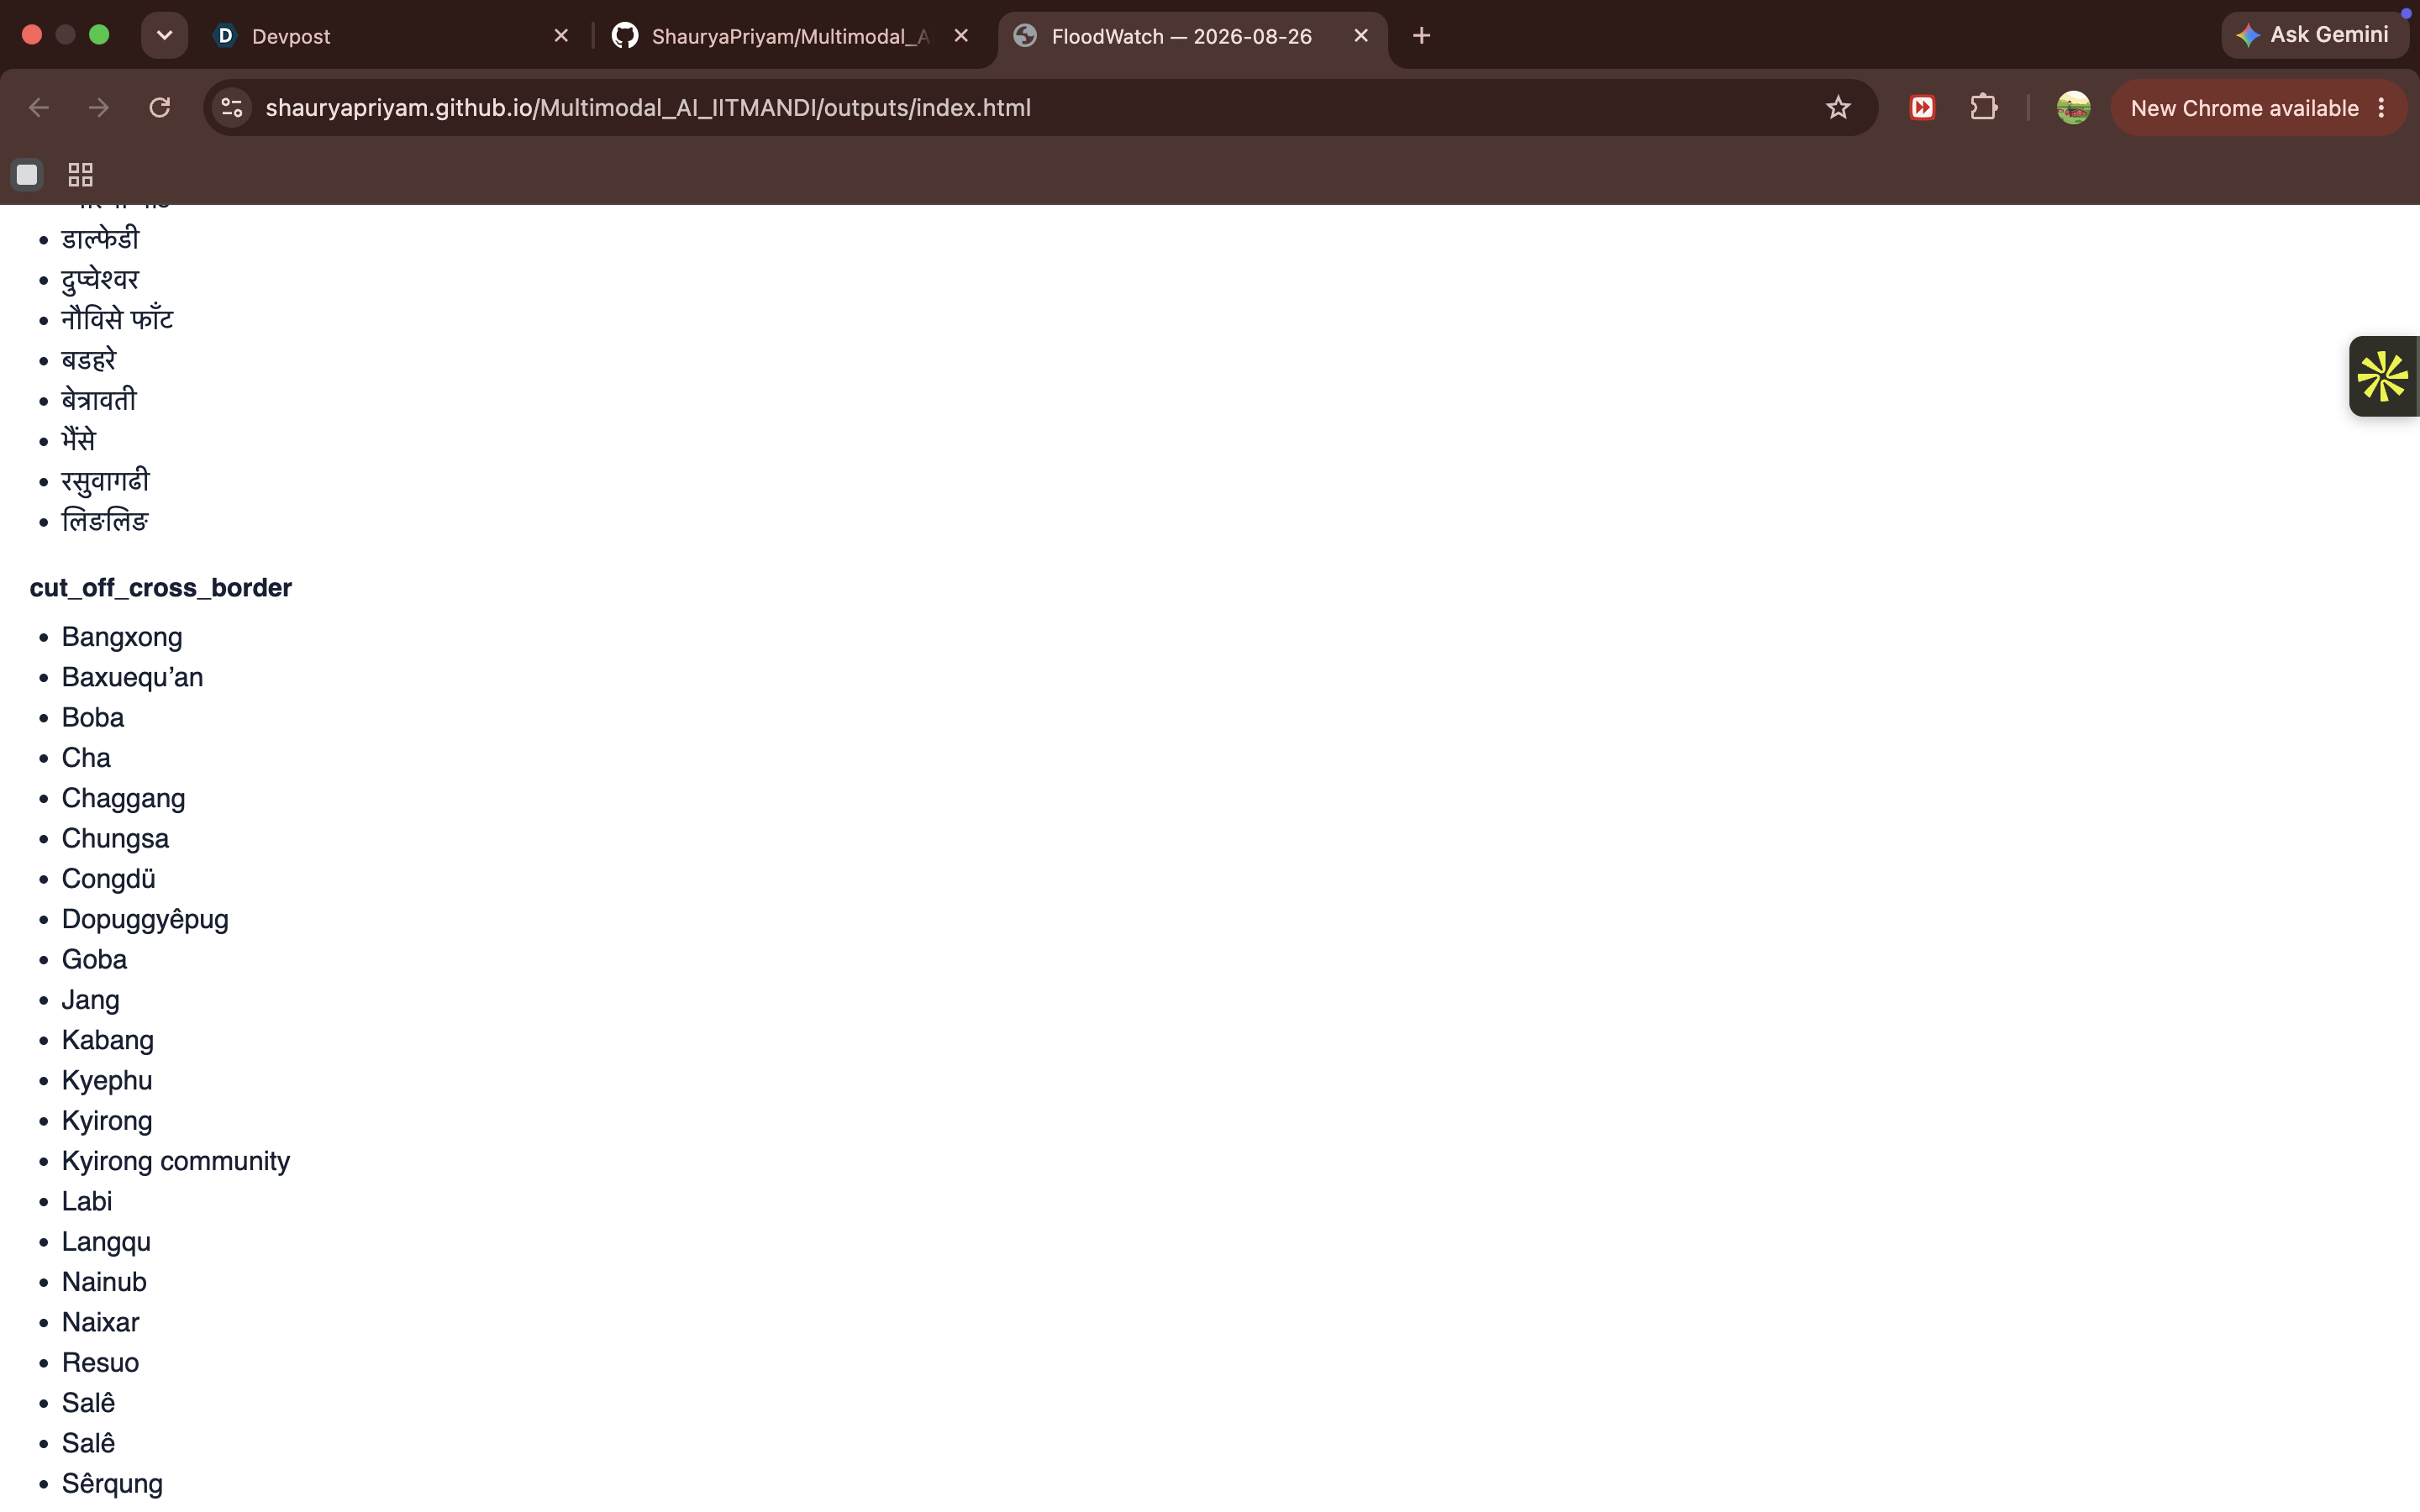
Numbers tab: places with Chinese-script names, probably across the border, kept separate from the Nepal-side result.
-
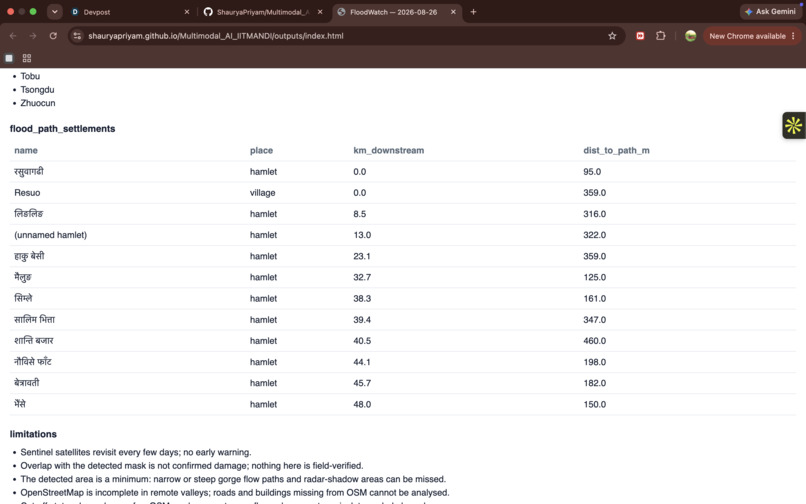
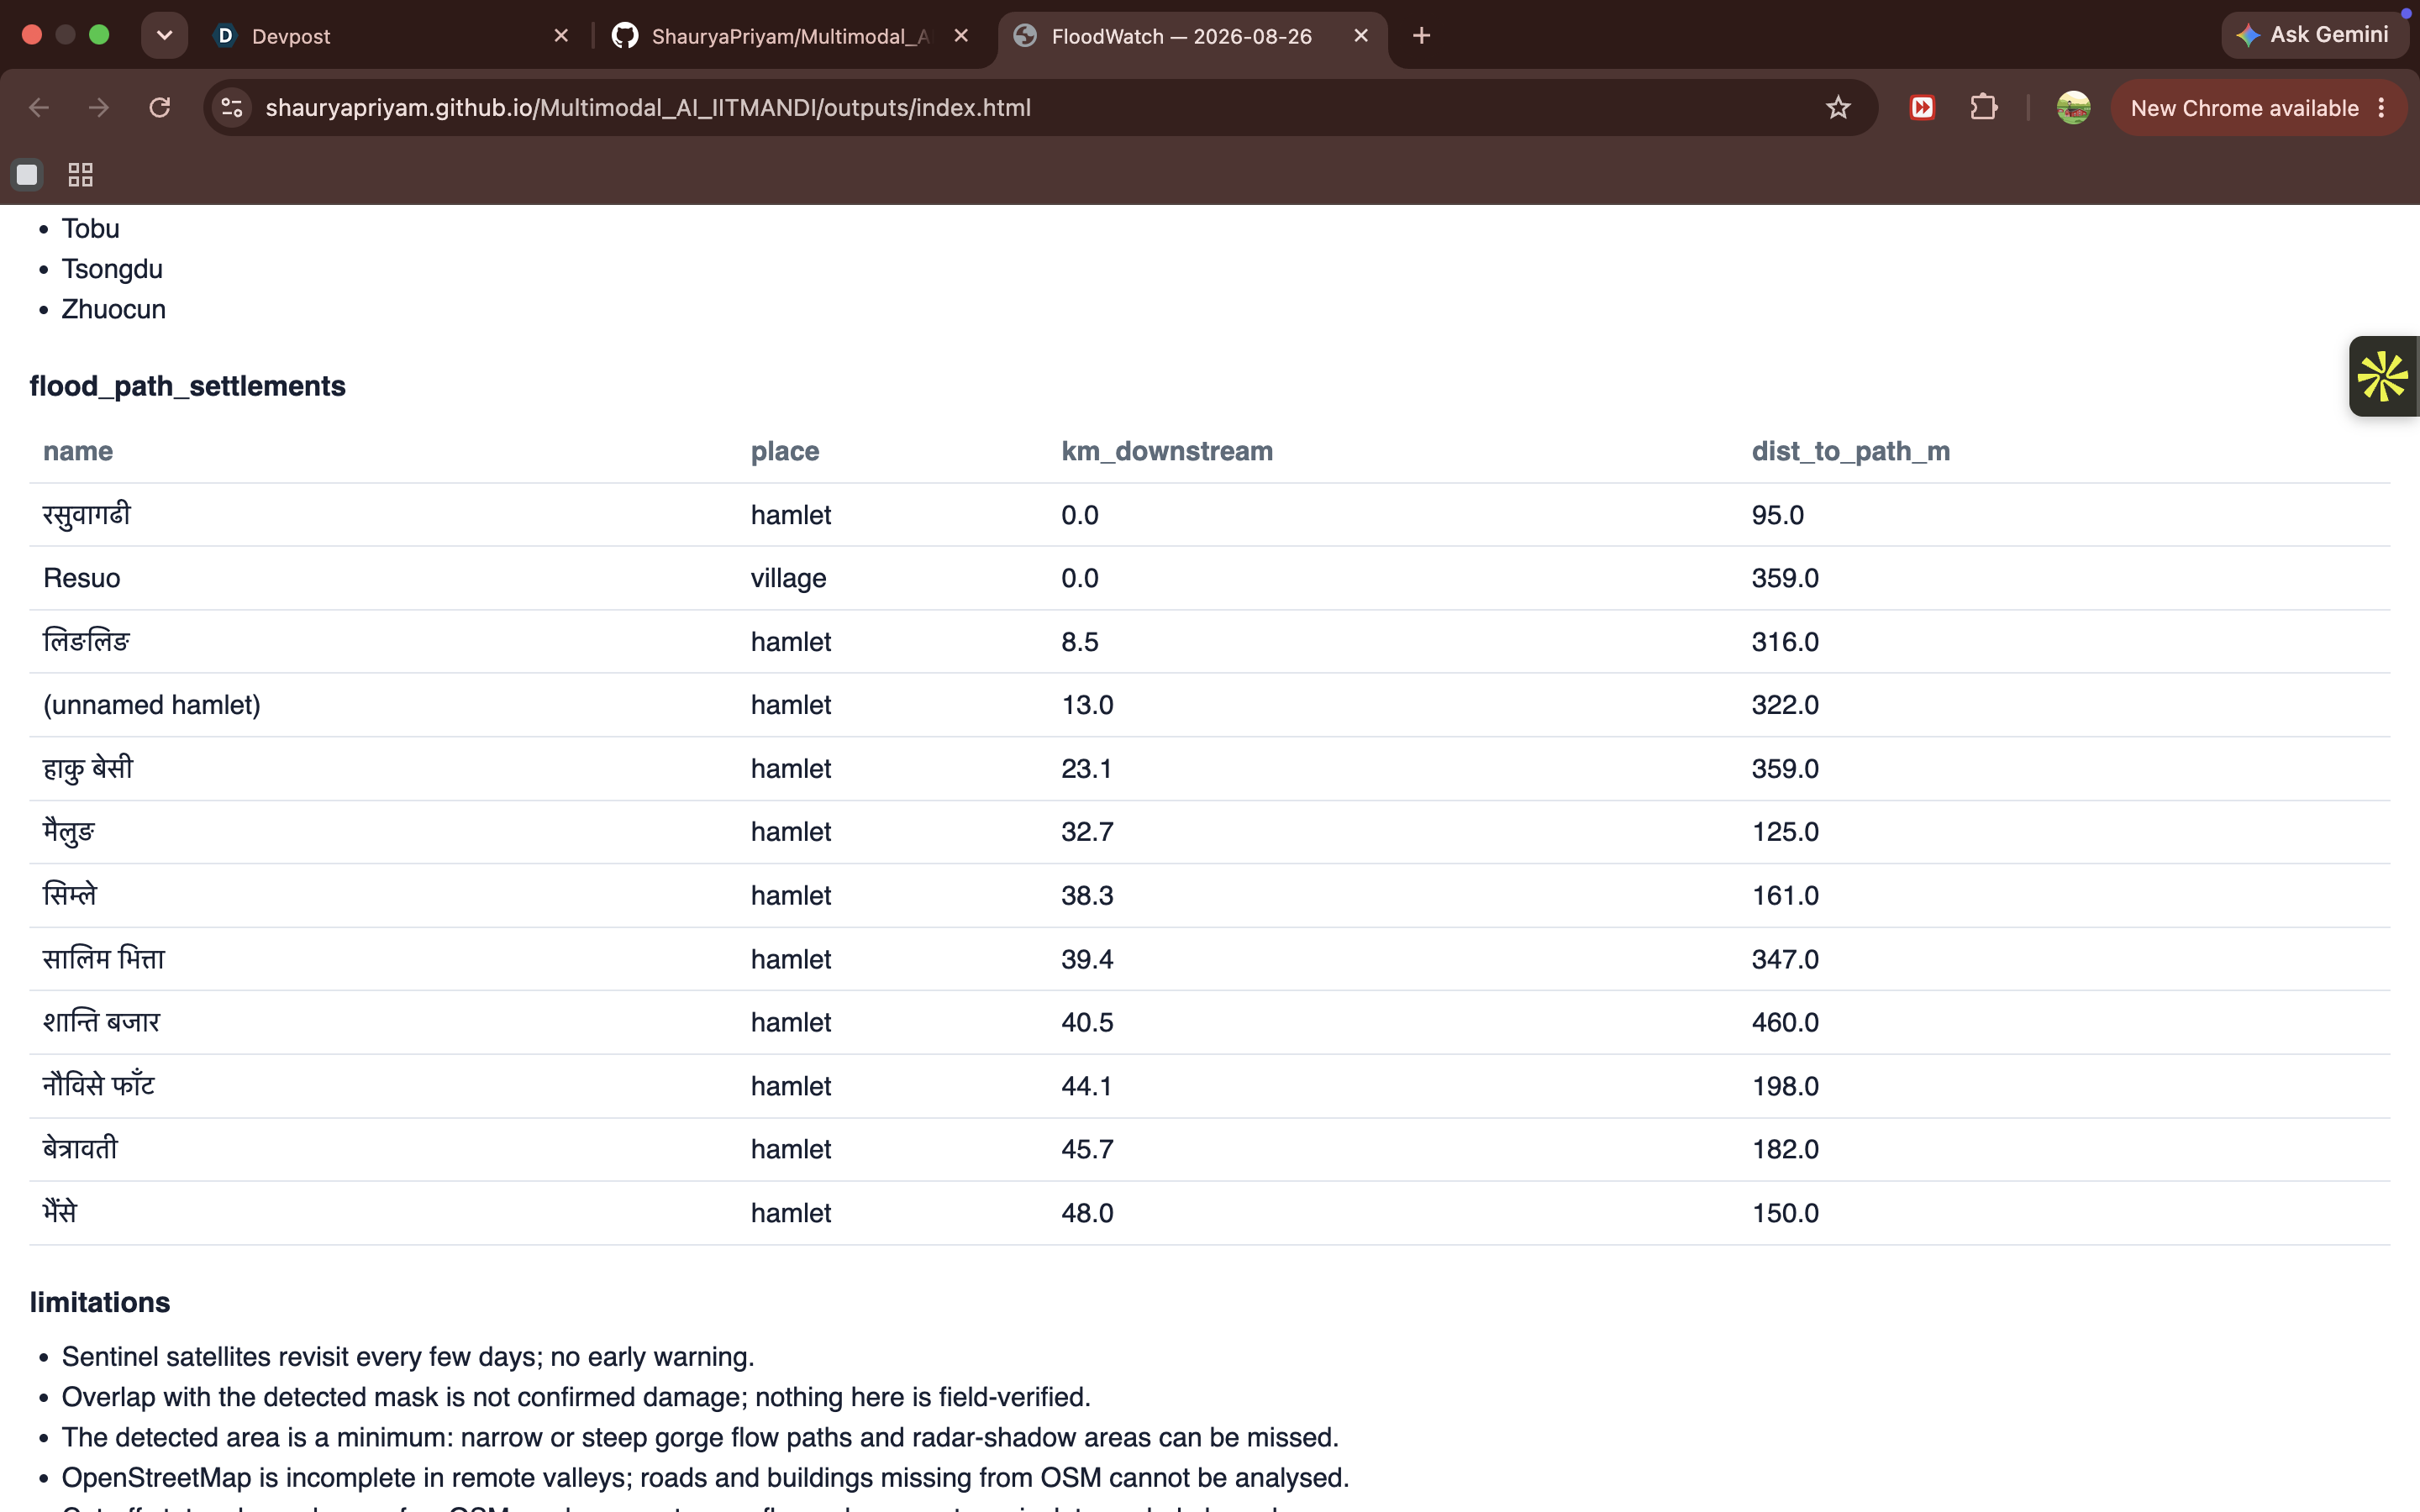
Numbers tab: settlements along the traced flood path, with distance downstream and distance from the path.
-
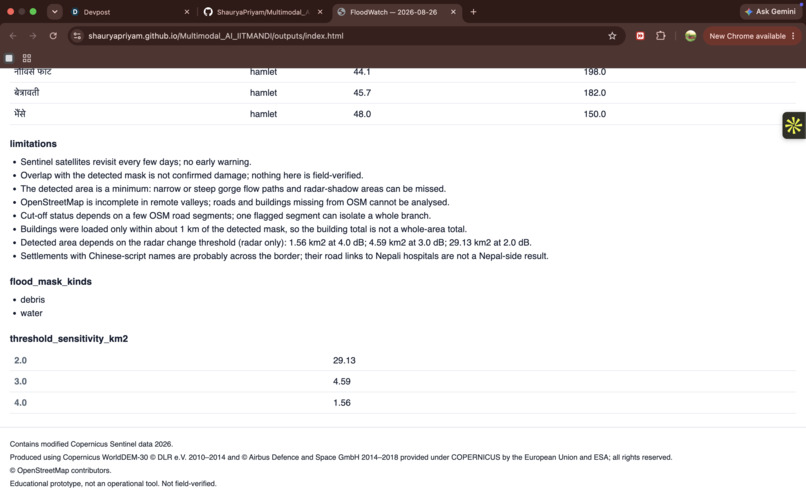
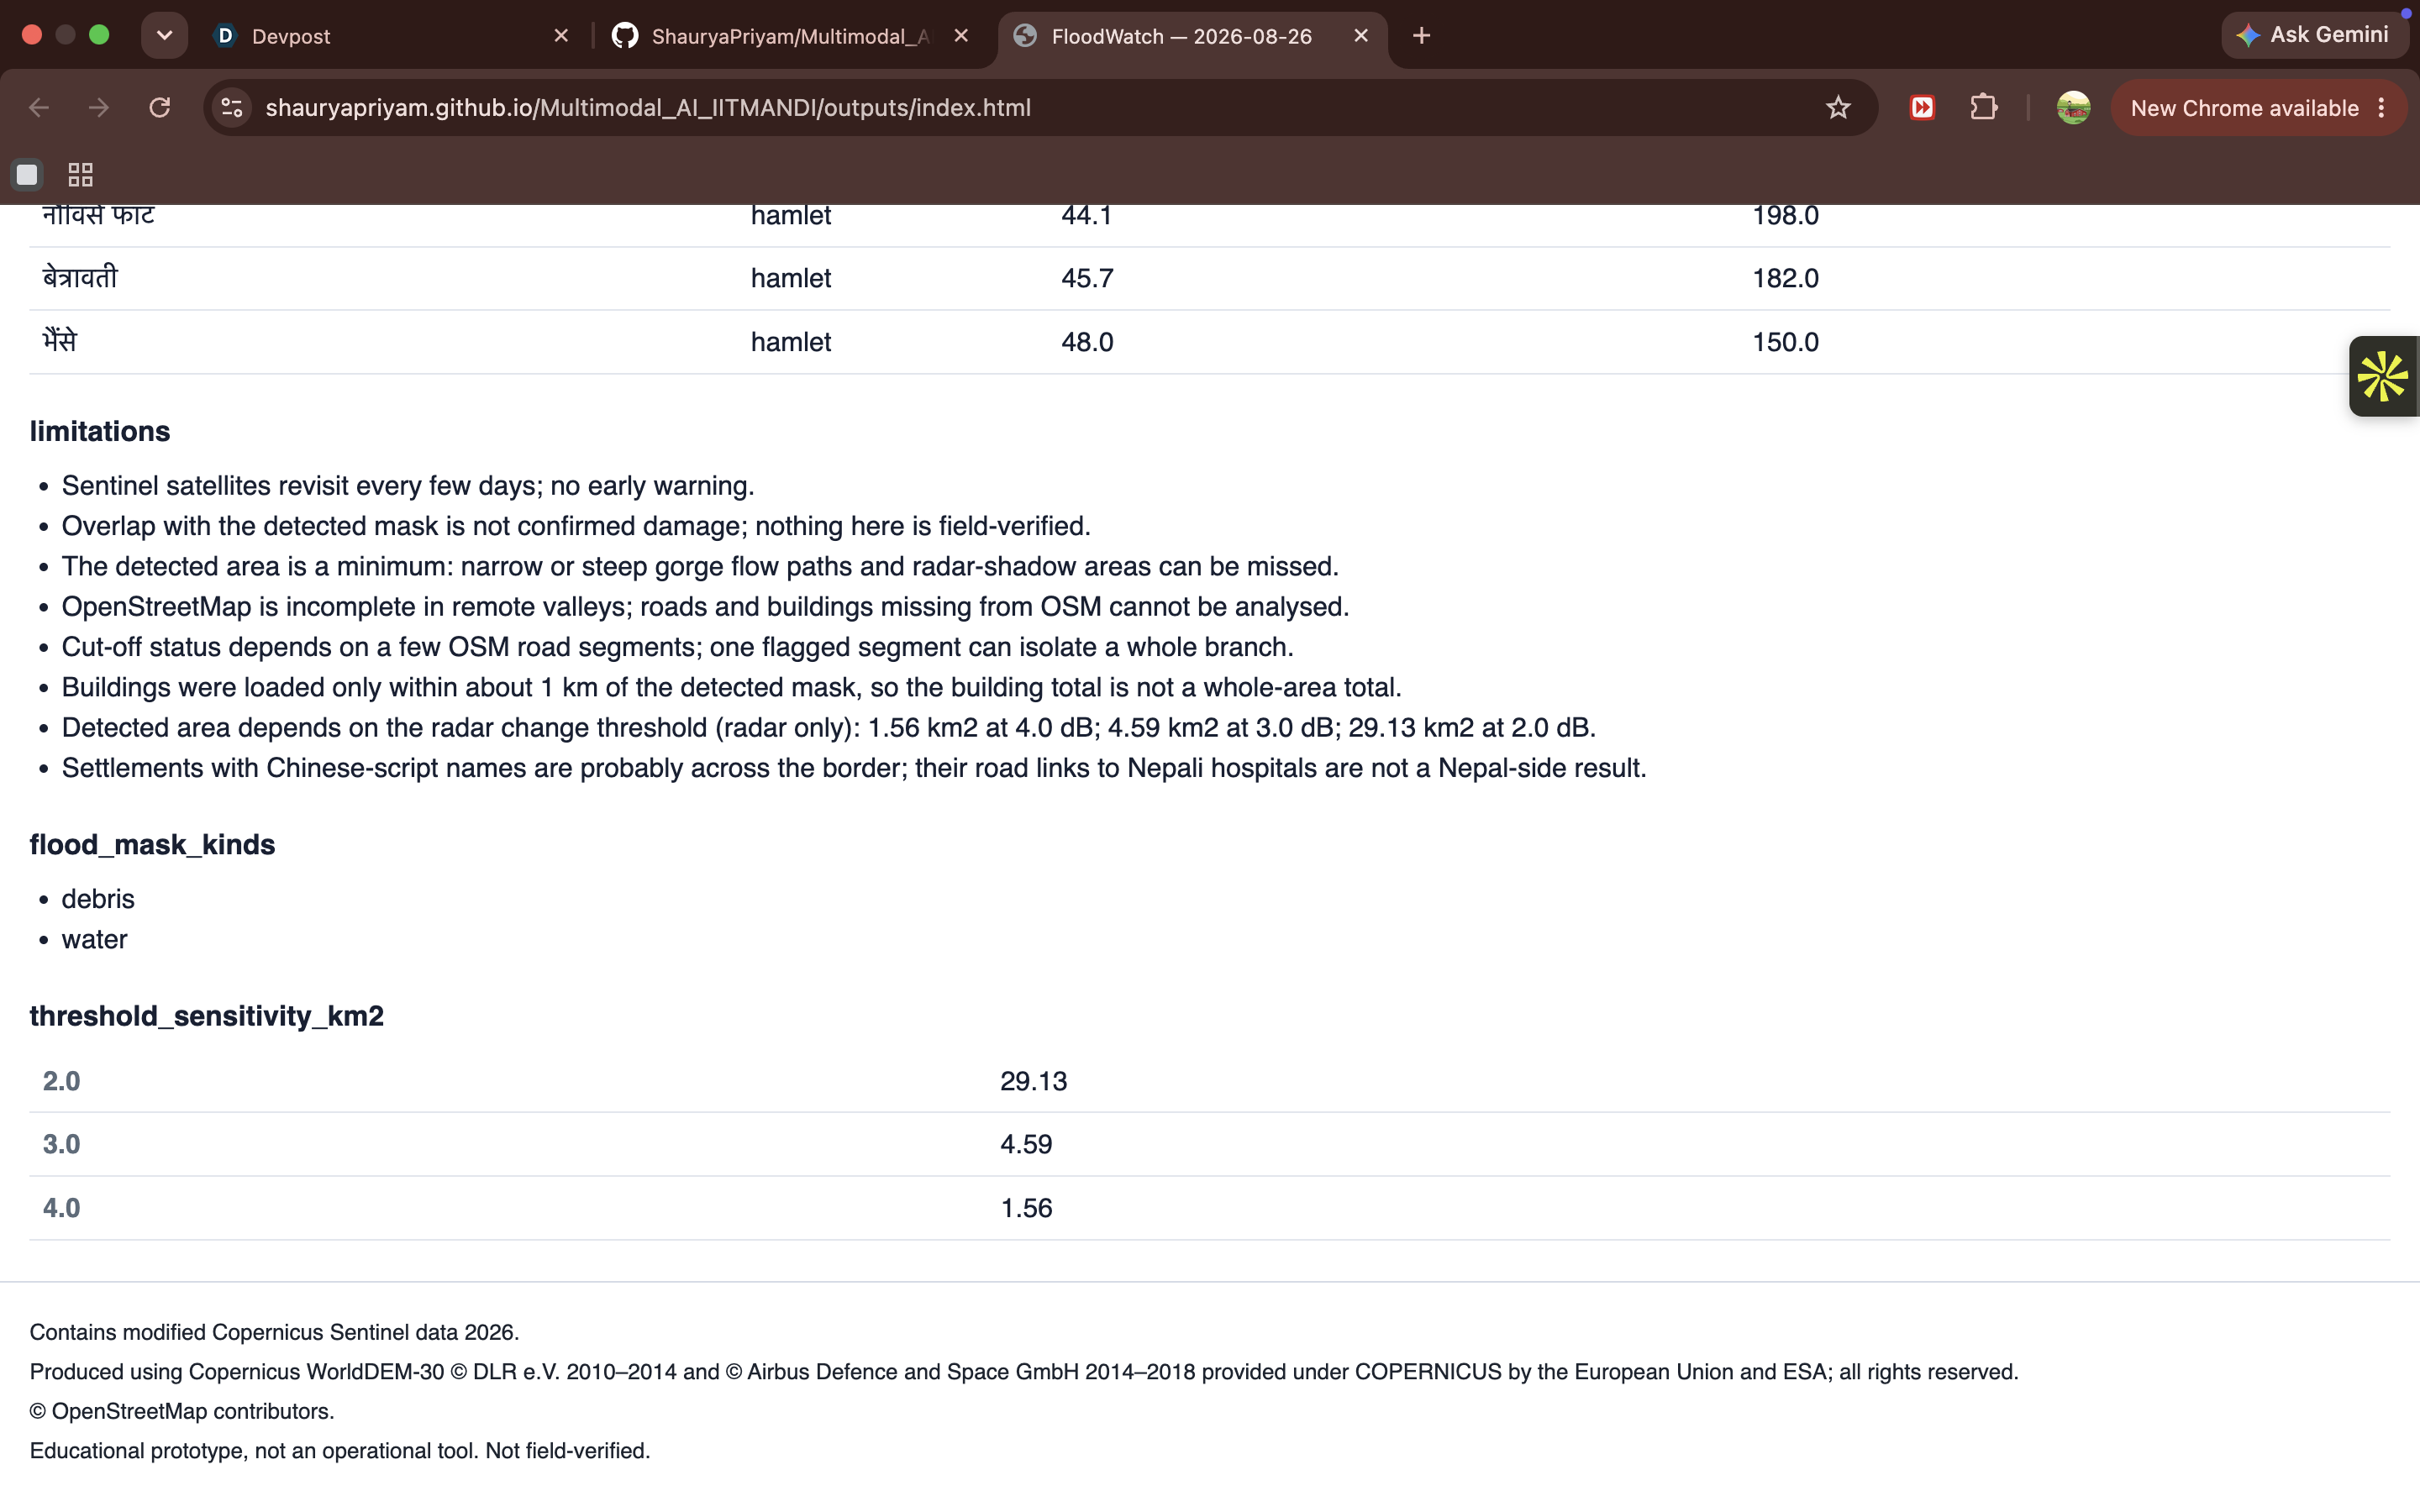
Numbers tab: limitations, and detected area at three radar thresholds (1.56, 4.59 and 29.13 km²).
Inspiration
The problem statement was about the August 2026 Trishuli flood where roads, bridges and phone lines went down simultaneously and rescuers were not aware of the cut off villages. We were interested in how useful free satellite data could be to answering three basic questions: where did the flood hit, what was damaged, and who is cut off, and we wanted to see how far free satellite data could go in answering these questions.
What it does
You specify area and the date of the flood. It then:
- analyses radar images from the Sentinel-1 mission before and after event (16 Aug - 28 Aug) on the same orbit track and maps flooded and debris-affected areas; analyses Sentinel-2 data only if the sky was clear on both dates
- overlays pre-event OpenStreetMap buildings, roads and bridges (27 July snapshot) and counts the ones that intersect the mask
- maps a road graph, clears flooded roadways and places settlements that lose their access to the nearest hospital or town on the list
- traces the flood path from a point upstream to the downstream point with the help of Copernicus DEM
- creates an interactive map dashboard and one-page situation report in English and Nepali
The figures for the AI part are directly taken from a facts.json file. A language model just writes a short summary from that file, and all the numbers in that file are verified by the model. The AI text is omitted if the number doesn't match.
How we built it
All these things are stored in one Google Colab notebook, including the raw satellite data. We use Copernicus Data Space API for Sentinel-1 and Sentinel-2, as well as the Copernicus DEM, and Overpass for the OSM Snapshot, all with the same pre-event date (ohsome returned a 403 for us). Change detection relies on the difference, in dB, between the two radar dates, at two smoothing scales, with the VH channel confirming the VV change. The dashboard is created with folium and the copilot uses Groq's gpt-oss-120b. No training data were used since we did not train any model.
Challenges
We ran the first time and only found 0.07 km2 and it did not score any overlap against the Copernicus EMS reference (EMSR927). We discovered that narrow flow paths in the gorge were being deleted as a part of our own clean up efforts, so we changed the detector. Openly I state that these were changes to the structure and not tuned to the reference. We also suffered a few Overpass timeouts, a Copernicus connection timeout, and a settlement list with some places on both sides of the border.
Results, honestly
Inside the EMSR927 areas the refined run gets IoU 0.16, precision 0.93 and recall 0.16 (the first run was 0). The unchecked area, being the 9.77 km2 minus the 0.42 km2 in those areas, is 9.35 km2. The area detected can vary significantly depending on the threshold, ranging from 1.56 km2 at 4 dB to 29.13 km2 at 2 dB. The list of 27 potentially cut-off settlements is a candidate list, not a final outcome, because the one flagged segment of the road can potentially cut off an entire branch of settlements. In the reference, we have 6 bridges destroyed, and we have 15 flags, so we over-count.
What we learned
An honest comparison of the radar change detection in a steep gorge with the reference is more important than a good-looking map, and the change detection is sensitive to smoothing and thresholds. Also, many settlements (96 out of 380) were not connected to the road network within 500 m of the OSM coverage area, which restricts the conclusions that could be drawn by a cut-off analysis.
What's next
Set thresholds on additional flood events, include more information from the road network than OSM, and validate with field and responder data.
It is an educational prototype, not an operational tool and there is nothing field-verified.
Based on Copernicus Sentinel data 2026 modified. All data of Copernicus WorldDEM-30 is produced by Copernicus WorldDEM-30 © DLR e.V. 2010-2014 and Copernicus WorldDEM-30 © Airbus Defence and Space GmbH 2014-2018; all rights reserved, and all data of OpenStreetMap is taken from OpenStreetMap contributors. Reference maps for checking purposes only: data from Copernicus Emergency Management Service (EMSR927) from European Union.
Built With
- copernicus-data-space
- copernicus-dem
- folium
- geopandas
- google-colab
- groq
- networkx
- openstreetmap
- overpass-api
- python
- rasterio
- sentinel-1
- sentinel-2


Log in or sign up for Devpost to join the conversation.