-
-

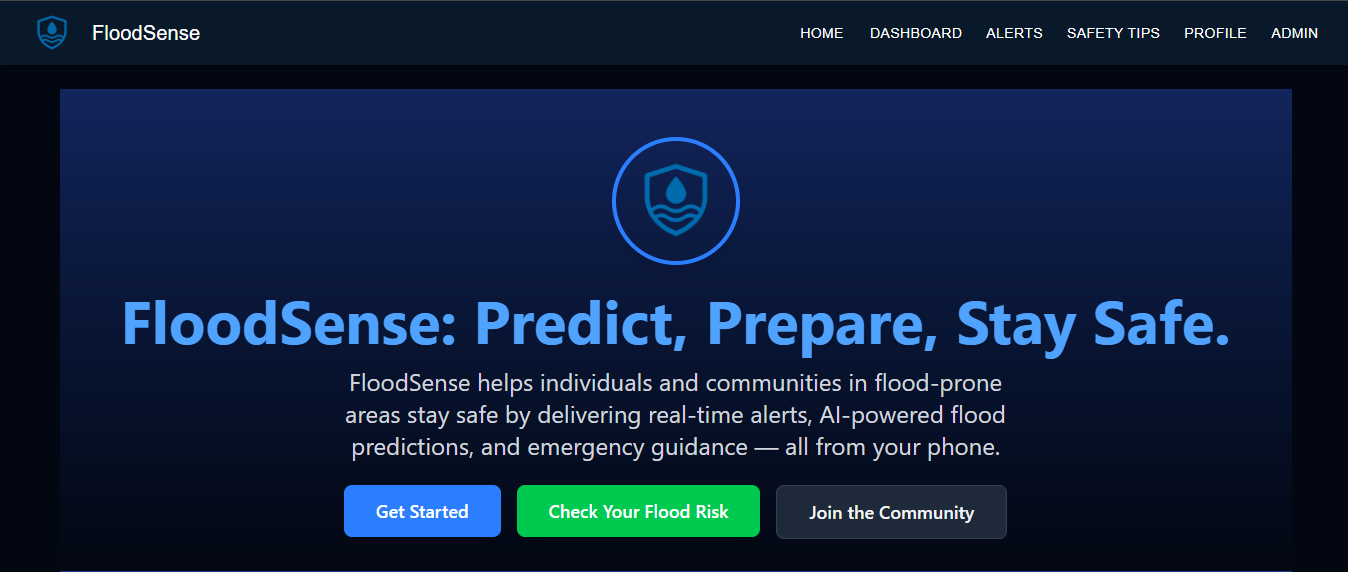
Hero Section of the landing page.
-
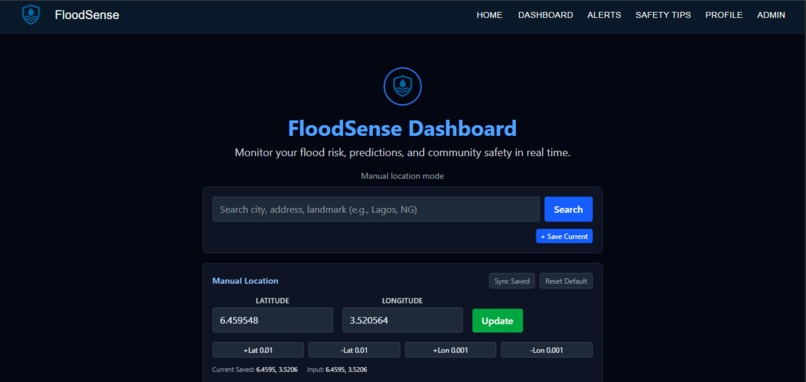
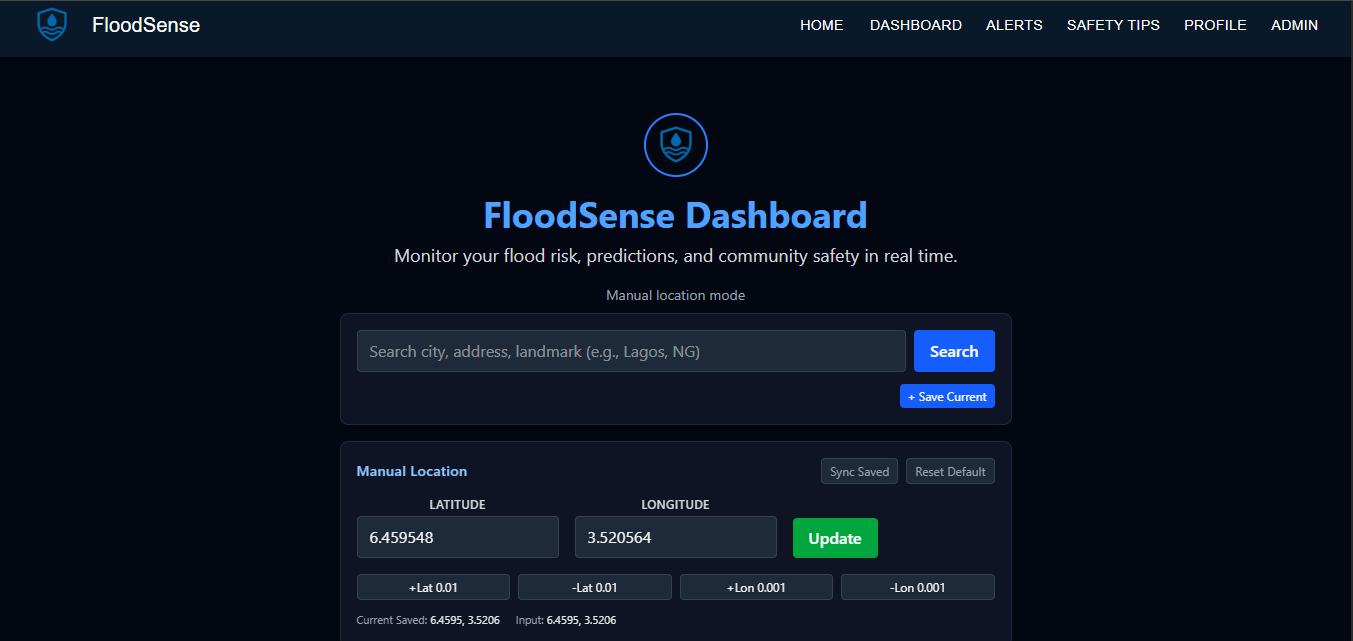
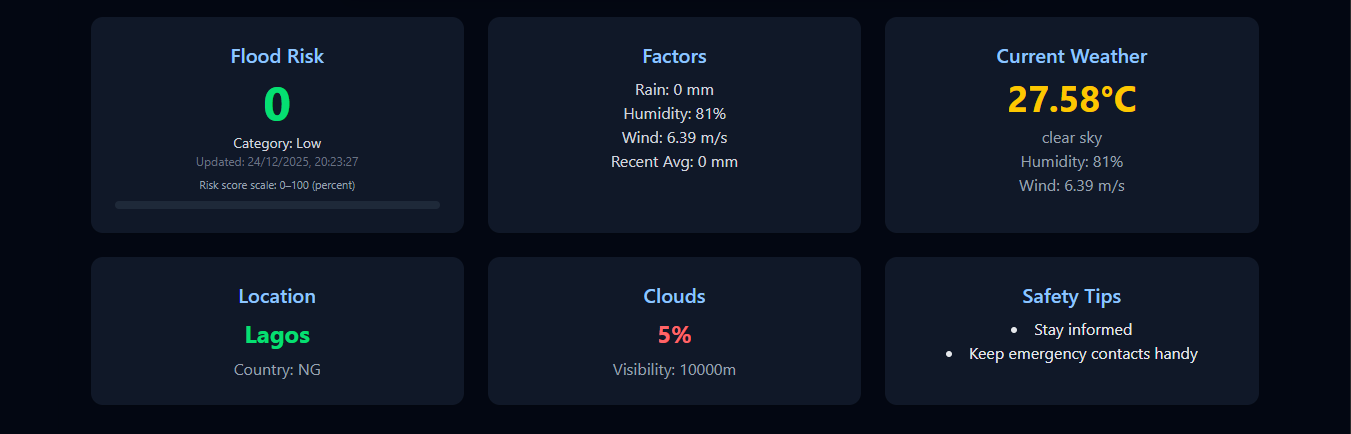
FloodSense dashboard getting real-time flood risk for a selected location.
-
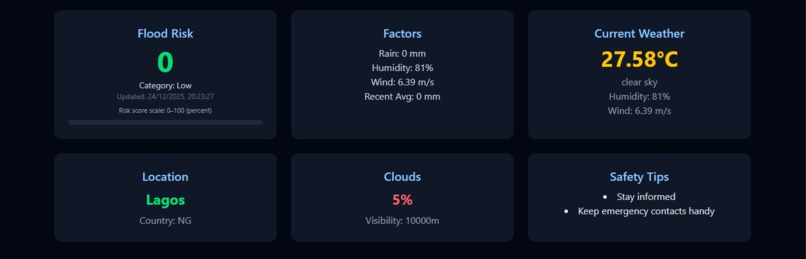
FloodSense dashboard showing real-time flood risk for a selected location.
-
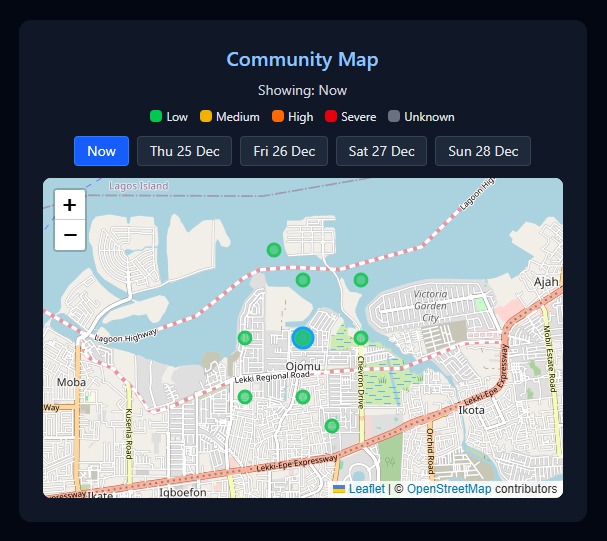
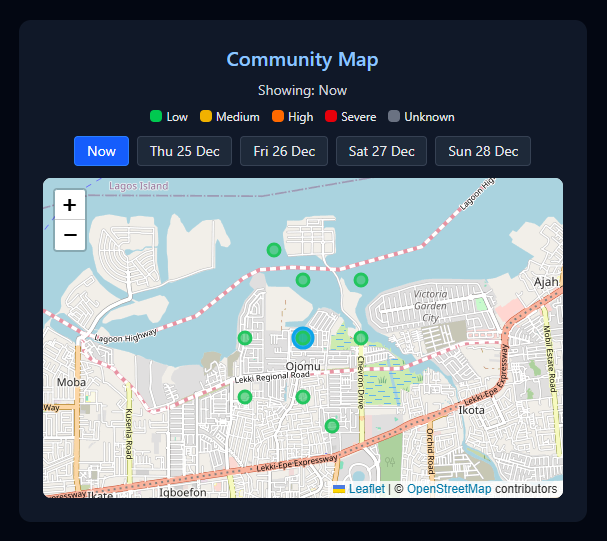
Interactive map with nearby flood-risk markers and day-based forecasting.
-
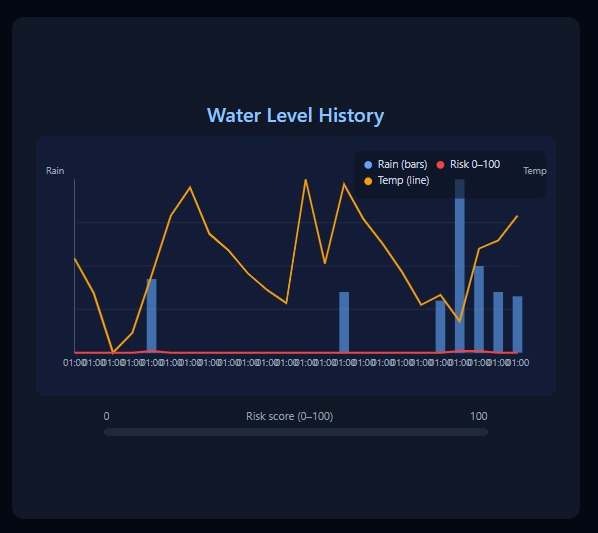
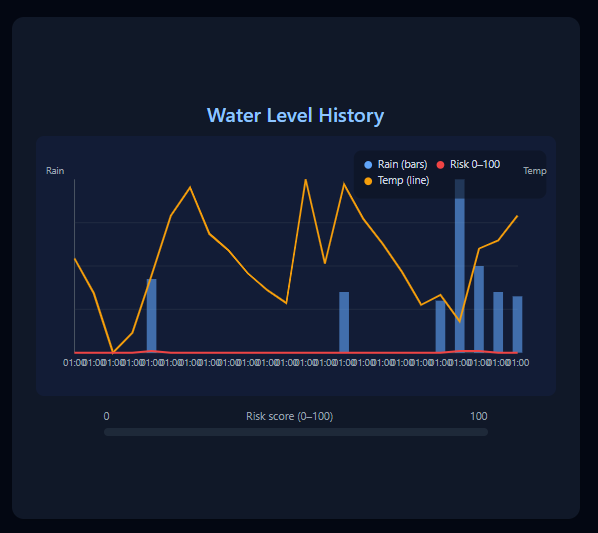
Water level history combining rainfall, temperature, and flood-risk proxy.
-
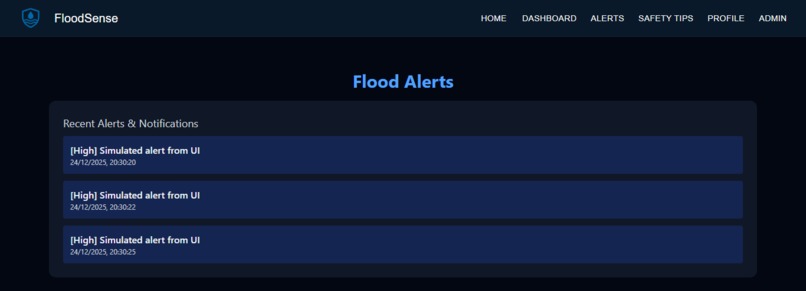
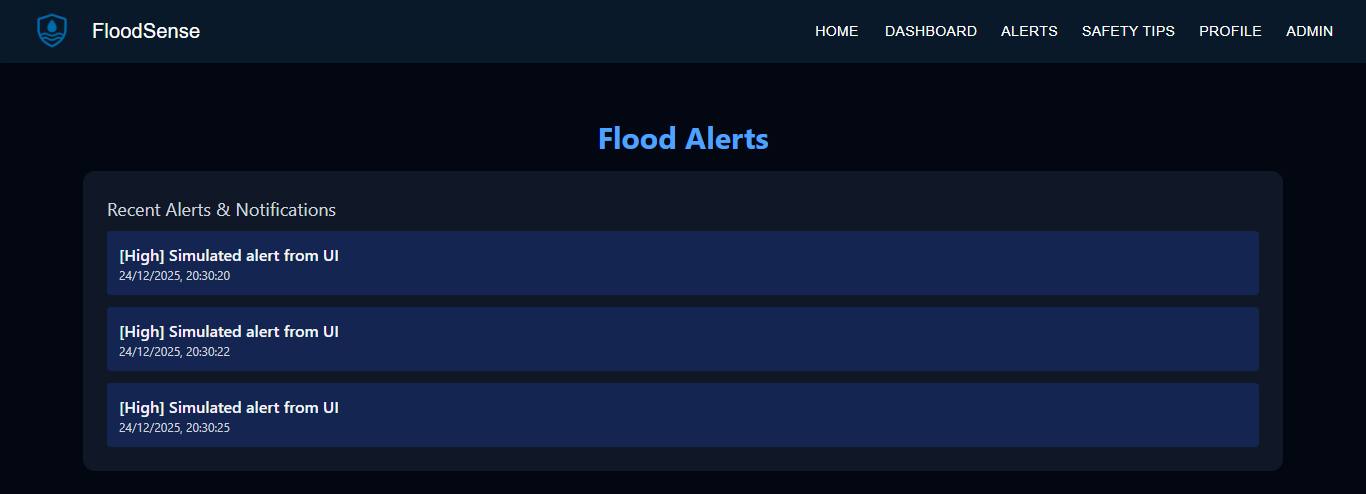
Live alerts that update automatically as flood risk increases.
-

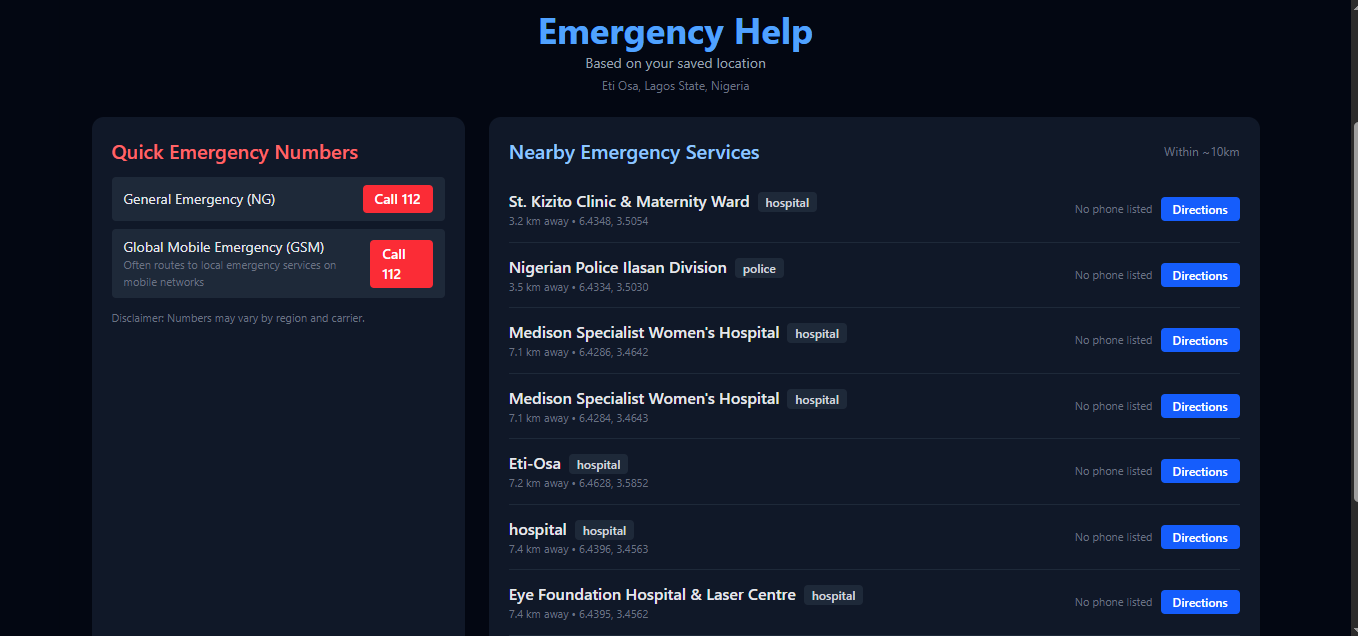
Emergency Help page showing nearby services based on user location.
-
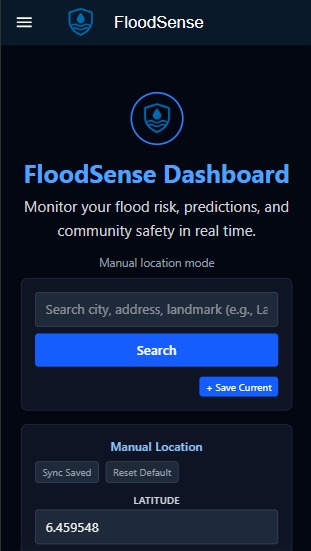
Mobile-first design optimized for real-world, on-the-go usage.

🌊 FloodSense — Project Story
Inspiration
Flooding impacts millions every year, damaging homes, roads, and livelihoods. In many communities especially in some remote parts of Africa where I visit often, there’s no timely, local early‑warning. We set out to build something simple, accessible, and practical — a tool to help people predict, prepare, and stay safe.
What it does
FloodSense keeps people informed before, during, and after flood events:
- Real‑time flood risk at your location (0–100 score, Low → Severe)
- Interactive map (React‑Leaflet + OSM) with nearby risk markers and a day selector
- Water Level History chart (rain bars, temperature line, red 0–100 risk proxy)
- Recent Alerts card that updates live
- Safety Tips that adapt to the latest risk
- Emergency Help page with nearby police/hospitals/fire stations and quick emergency numbers
How we built it
- Frontend: React (Vite), Tailwind CSS, Material UI, React Router
- Maps: React‑Leaflet with OpenStreetMap tiles
- Backend: Node.js + Express (endpoints:
/api/weather,/api/forecast,/api/risk,/api/alerts) - Data/APIs: OpenWeatherMap (current and forecast), Nominatim (search/reverse geocoding), Overpass (nearby emergency services)
- Hosting: Netlify (frontend) + Render (backend)
- Notifications: Service worker for local notification on risk escalation
Risk scoring is a fast, interpretable heuristic that blends weather features and clamps to $[0,100]$:
$\text{risk} = \mathrm{clip}_{[0,100]}\big(w_r\,\text{rain} + w_h\,\text{humidity} + w_w\,\text{wind} + w_a\,\text{recentAccumulation}\big)$
Forecast views use a rain‑based proxy (sum rainfall per day → category and a 0–100 proxy line in the chart).
Challenges we ran into
- Normalizing multiple APIs (current vs. forecast, geocoding vs. emergency services)
- Handling sparse or delayed data gracefully with clear messages
- Designing mobile‑first flows for search, favorites, and manual coordinates
- Making the map and chart intuitive (legends, scales, colors, and tooltips)
- Providing notifications without a full push infrastructure
Accomplishments that we're proud of
- A clean, responsive dashboard with an interpretable risk score and clear category colors
- A highly interactive map: center marker, nearby sampling, day selector, and click‑to‑check risk anywhere
- A readable Water Level History visualization (rain bars, temp line, risk proxy with legends and tooltips)
- Recent Alerts surface with periodic polling
- An Emergency Help page that automatically lists nearby services and quick numbers based on saved location
What we learned
- Orchestrating multiple real‑time APIs efficiently and defensively
- Designing user‑facing disaster heuristics that are simple and explainable
- Geospatial visualization patterns with React‑Leaflet and OSM
- Performance tuning (caching, request shaping) for responsive UX
- Balancing clarity and density in mobile‑first UI design
What's next for FloodSense
- ML‑powered flood prediction with terrain/elevation/hydrology features
- SMS/WhatsApp alerts and true web push subscriptions (VAPID)
- Community flood reporting with triage and deduplication via embeddings
- Offline safety guides and localized preparedness content
- Partnerships with emergency agencies and local responders
Built With
- axios
- cors
- cors.-data/apis:-openweathermap-(current-+-forecast)
- css
- css.-frontend:-react-(vite)
- dotenv
- express.js
- favorites
- github
- in-memory-alerts-store-(prototype).-hosting/infra:-netlify-(frontend)
- javascript-(esnext)
- jsx
- last-risk)
- localstorage
- material-ui-(+-icons)
- netlify
- node.js
- nominatim
- nominatim-(search/reverse-geocode)
- openstreetmap
- openstreetmap-tiles.-charts:-custom-svg-charting-(rain/temperature/risk-proxy).-backend:-node.js
- openweathermap
- overpass-api-(nearby-emergency-services).-notifications:-service-worker-(web-notifications-on-risk-escalation).-storage:-localstorage-(coords
- overpassapi
- react-(vite)
- react-leaflet-+-leaflet
- react-router
- react-router.-mapping:-react-leaflet-+-leaflet
- render
- render-(backend)
- service-worker
- tailwind-css

Log in or sign up for Devpost to join the conversation.