Inspiration
Floods and landslides can damage infrastructure, disrupt roads, and isolate settlements, making it difficult for responders to understand the extent of potential disruption. Satellite imagery offers a way to assess large affected areas, while geospatial infrastructure data helps connect observed environmental changes to the places and communities that may be impacted.
I built FloodLens to explore how satellite-based change detection and geospatial analysis can work together to provide a clearer picture of potential flood-related disruption. My goal was to create an educational prototype that connects environmental observations with infrastructure and accessibility insights, rather than simply generating a flood mask.
What it does
FloodLens combines satellite imagery analysis with pre-event OpenStreetMap (OSM) data to produce a geospatial assessment of potential flood and debris-related changes.
- Satellite-based change detection: Compares pre-event and post-event Sentinel-1 SAR imagery to identify significant changes using image differencing and Otsu thresholding.
- Optical water detection: Optionally uses Sentinel-2 imagery to calculate the Normalized Difference Water Index (NDWI) and identify reliable new-water signals.
- Infrastructure impact assessment: Overlays detected change areas with mapped buildings, roads, and bridges to flag potentially affected infrastructure.
- Settlement accessibility analysis: Examines road-network connectivity to identify settlements that may have disrupted access to mapped facilities.
- Uncertainty-aware model utilities: Includes an EfficientNet-B0 U-Net segmentation model builder and Monte Carlo Dropout inference utilities for generating predictions and uncertainty estimates.
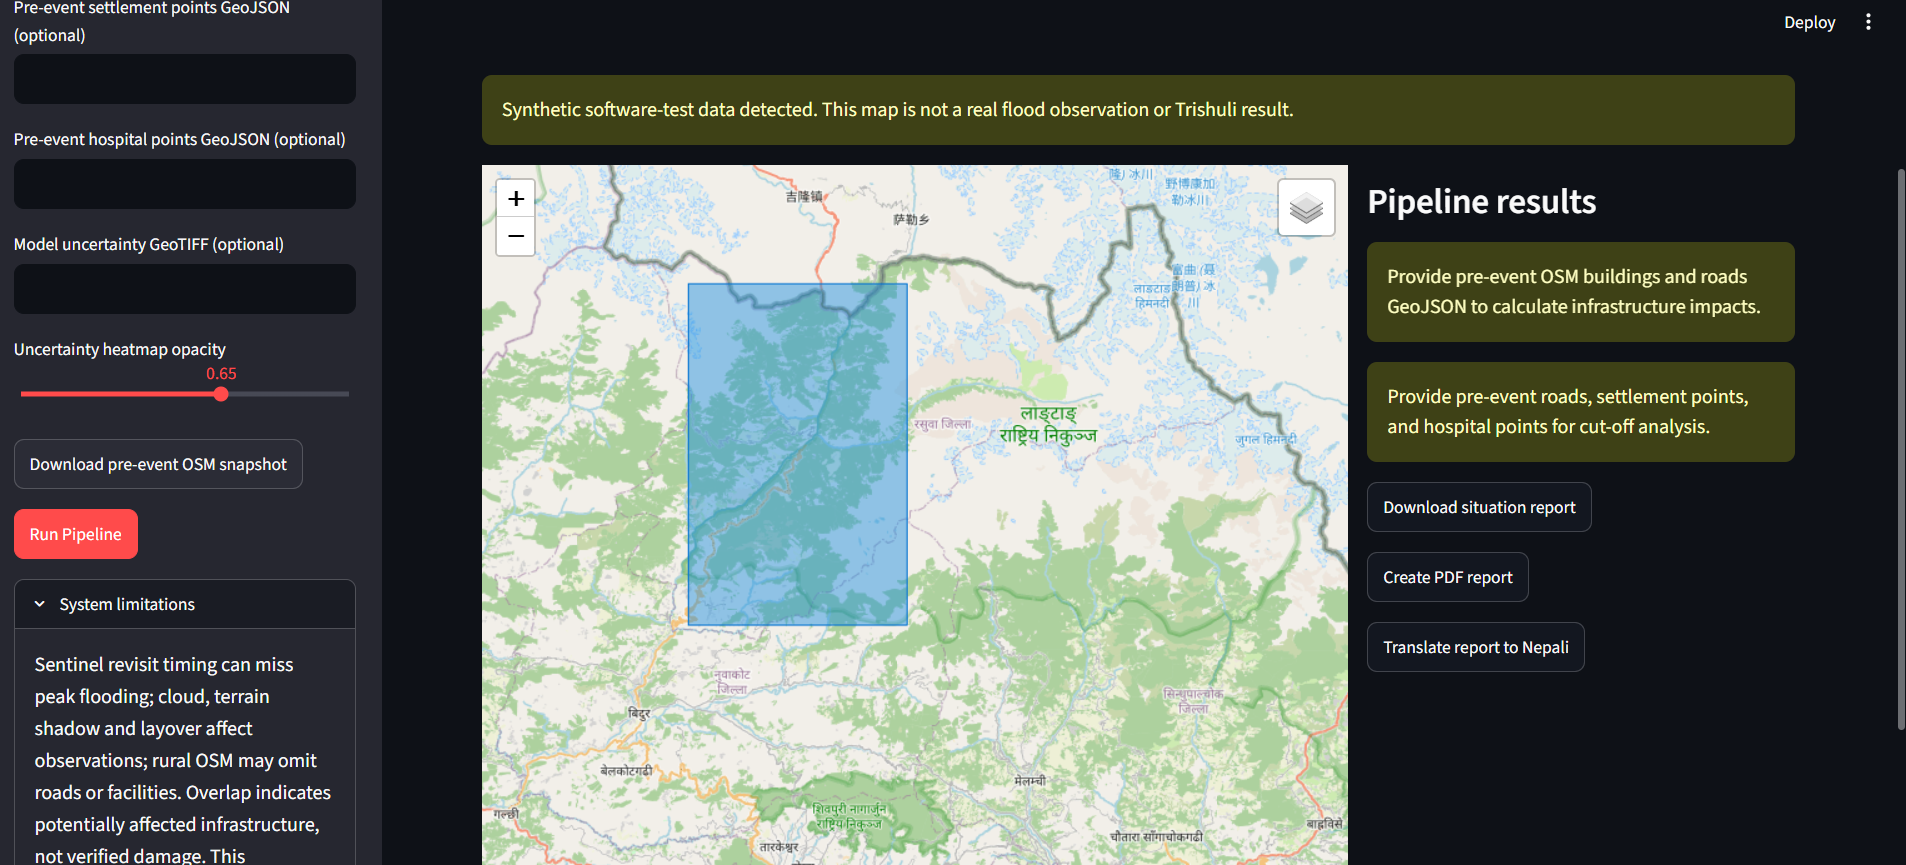
- Situation reporting: Generates geospatial outputs, a text-based situation report, and optional PDF reports and Nepali translations.
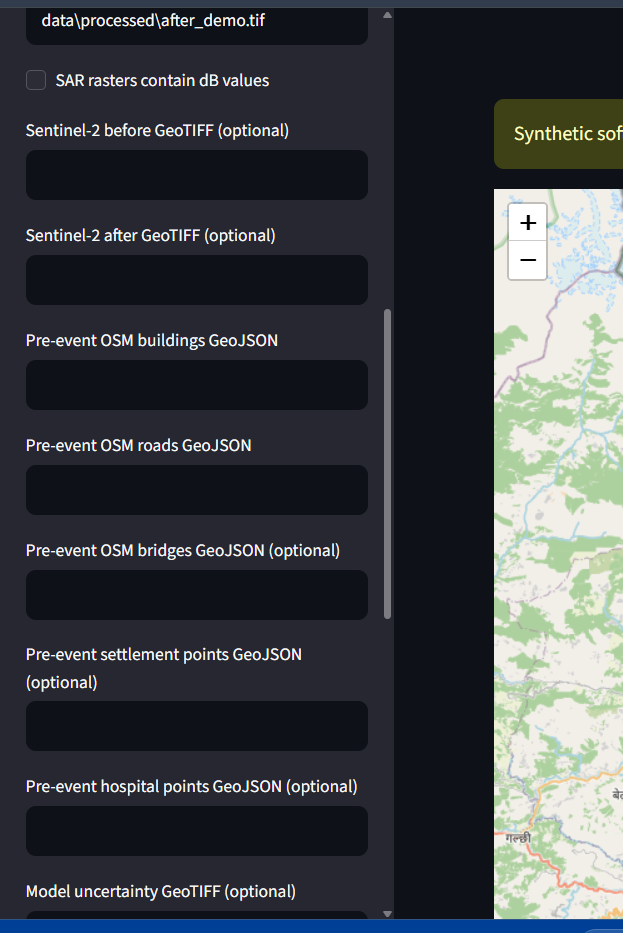
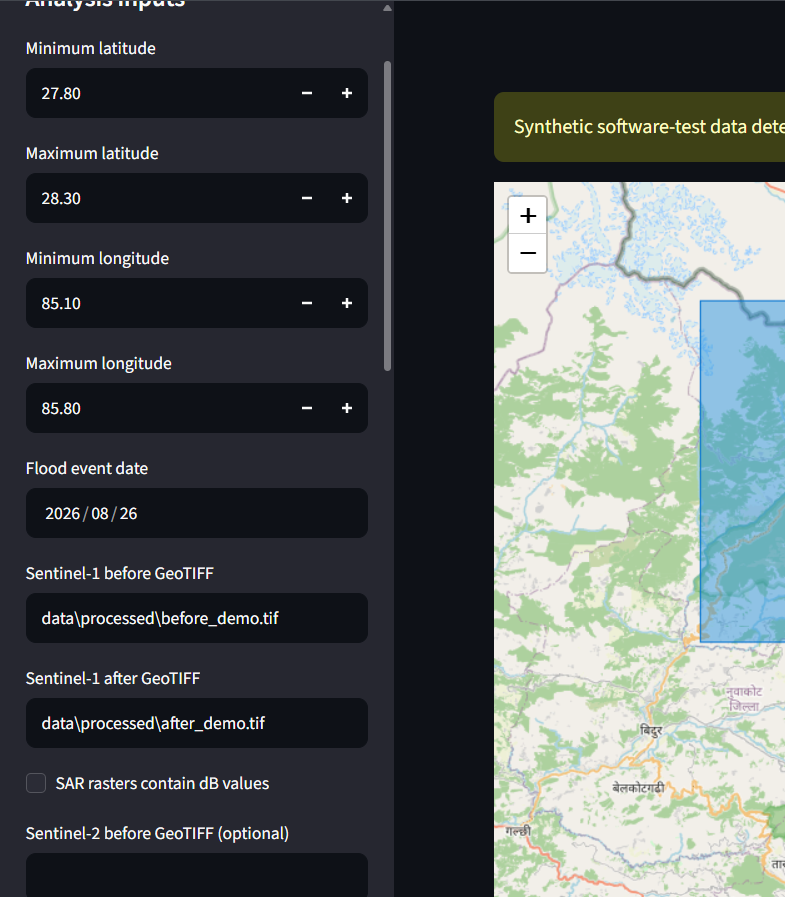
The interactive Streamlit dashboard allows users to provide preprocessed satellite rasters, select a geographic bounding box, and configure available infrastructure layers. The pipeline generates GeoTIFF masks and GeoJSON outputs for further inspection.
How I built it
I built FloodLens in Python, combining geospatial processing, image analysis, machine learning utilities, and an interactive dashboard.
The primary pipeline uses Rasterio, GeoPandas, Shapely, NumPy, SciPy, and scikit-image to process raster imagery and vector geometries. Sentinel-1 change detection operates on consistently preprocessed before-and-after imagery, using log-ratio change for linear intensity data or subtraction for dB data, followed by Otsu thresholding.
When optical data is available, the pipeline uses Sentinel-2 Green and Near-Infrared bands to calculate NDWI and incorporate reliable new-water signals. Detected change areas can then be intersected with pre-event OSM infrastructure layers to identify potential overlaps and assess road-network connectivity.
I used Streamlit and Folium to make the workflow accessible through an interactive geospatial interface. The project also includes utilities for deep-learning segmentation, uncertainty estimation, raster export, report generation, and optional translation.
To support reproducible testing without misrepresenting synthetic data as real observations, FloodLens includes a synthetic SAR demonstration and automated tests using temporary test fixtures.
Challenges I faced
One of the main challenges was ensuring that satellite comparisons are meaningful. Differences in polarization, relative orbit, preprocessing, raster alignment, or measurement scale can produce misleading change signals. I therefore designed the workflow around consistently preprocessed, aligned Sentinel-1 inputs and explicit checks for available orbit metadata.
Another challenge was connecting pixel-level changes to real-world infrastructure. Raster and vector data must share compatible coordinate systems, and apparent overlap does not necessarily mean that a building or road is damaged. Similarly, settlement accessibility results depend on the completeness and connectivity of mapped roads and facilities.
I also considered uncertainty and data integrity. Published damage maps must not leak into model training or threshold selection, and synthetic demonstrations must be clearly distinguished from actual satellite observations. These constraints shaped my testing approach and the way FloodLens communicates its results.
What I learned
Developing FloodLens helped me understand how remote sensing, image processing, machine learning, and geographic information systems can be integrated into a single analytical workflow. I learned the importance of consistent satellite preprocessing, spatial alignment, raster-vector operations, network topology, uncertainty estimation, and reproducible testing.
I also learned that a useful disaster-assessment tool must communicate the limitations of its data and outputs, not just visualize predictions. Infrastructure overlap should be treated as a potential impact indicator, while accessibility analysis should be interpreted in the context of incomplete map data and real-world conditions.
What's next
My next steps include automating raw Sentinel data acquisition and preprocessing, evaluating the segmentation model on properly separated flood-event datasets, validating predictions against independent reference maps, and improving uncertainty-aware infrastructure and accessibility assessments.
FloodLens is an educational prototype, not an operational flood-warning, damage-confirmation, or rescue-routing system. Its outputs require independent validation before they can support real-world decisions.
Built With
- analysis
- efficientnet
- geopandas
- geospatial
- gis
- imagery
- machine-learning
- numpy
- openstreetmap
- osmnx
- pandas
- python
- pytorch
- rasterio
- remote
- satellite
- scikit-image
- scipy
- sensing
- sentinel-1
- sentinel-2
- streamlit

Log in or sign up for Devpost to join the conversation.