-
-
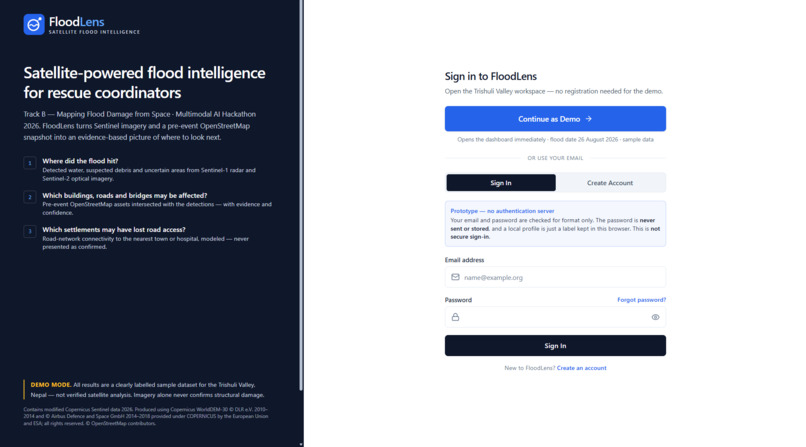
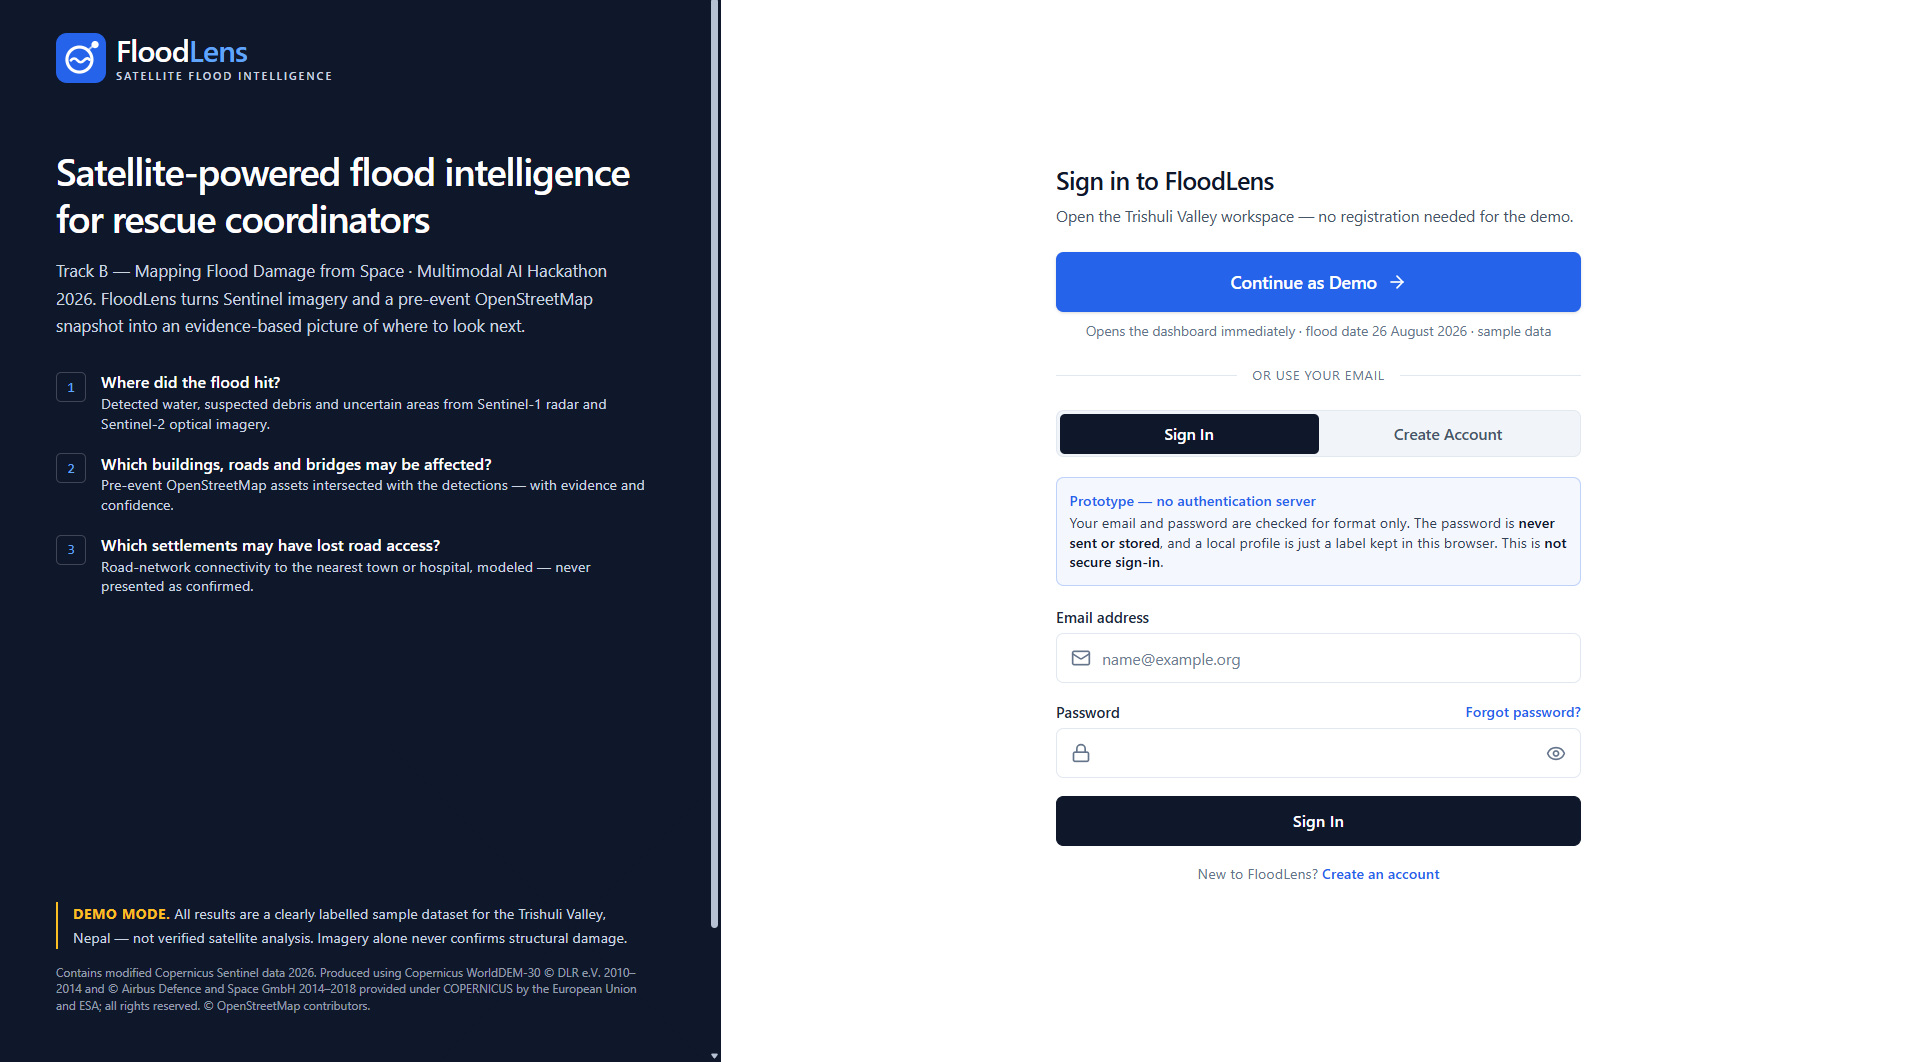
project Interface
- Inspiration
Natural disasters can transform remote communities into isolated areas within minutes. During severe floods, roads and bridges may be damaged, communication networks may fail, and ground-based monitoring systems may become unavailable. For rescue teams, one of the biggest challenges is understanding the extent of the damage when reaching the affected area is difficult or dangerous.
This inspired us to build FloodLens, a satellite-powered flood intelligence platform designed to help transform Earth observation data into meaningful geographic insights.
Our inspiration comes from a simple question: When the ground becomes inaccessible, can satellites help us see what has happened and understand where assistance may be needed most?
By combining satellite imagery, geographic information, and AI-assisted reporting, we aim to make flood assessment more accessible, transparent, and efficient. Our project focuses on three critical questions: Where did the flood hit? What infrastructure may have been affected? And which settlements may have lost road connectivity?
FloodLens represents our vision of using technology not merely to visualize a disaster, but to help people interpret its potential impact.
- What It Does
FloodLens is a web-based satellite intelligence prototype designed to support flood-impact assessment through geospatial analysis.
The platform focuses on three essential capabilities:
- Flood Extent and Change Analysis
FloodLens is designed to compare satellite observations from before and after a flood to identify areas showing potential flood-related changes. Sentinel-1 Synthetic Aperture Radar (SAR) imagery is particularly useful under cloudy conditions, while Sentinel-2 optical imagery can provide complementary information when the sky is sufficiently clear.
- Infrastructure Impact Assessment
By combining estimated flood-affected areas with pre-event OpenStreetMap data, the proposed analysis can identify buildings, roads, and bridges that may be exposed to flooding. It distinguishes potential exposure from confirmed structural damage.
- Settlement Connectivity Analysis
FloodLens aims to analyze road-network connectivity to identify settlements that may have lost road access to nearby towns or hospitals when potentially disrupted road segments are excluded.
The project also explores an AI-assisted situation-report copilot that could summarize verified analysis results in English and Nepali. A central design principle is that numerical claims must come from computed system outputs rather than being invented by a language model.
Our case-study objective is to analyze the August 2026 Trishuli flood in Nepal and evaluate independently generated results against the official Copernicus Emergency Management Service reference maps under activation EMSR927.
FloodLens is an educational prototype. Its complete satellite-processing and analytical capabilities must be validated before its outputs can support real emergency-response decisions.
- How We Built It
We developed FloodLens as a web-based geospatial intelligence application, with an emphasis on presenting complex geographic information through an accessible interface.
Technology Stack
React: Builds the interactive user interface and organizes the application into reusable components. TypeScript: Adds type checking to help structure the application and reduce programming errors. Vite: Provides the development environment and production build process. Tailwind CSS: Supports consistent styling and responsive interface design. Leaflet: Provides a foundation for interactive geographic maps. Lucide React: Supplies interface icons. Git and GitHub: Support source-code management and project documentation. Vercel: Hosts the deployed web prototype.
The planned analytical workflow begins with an area of interest and a flood date. Suitable satellite observations are then acquired and processed to estimate flood-related changes. Geographic infrastructure data and road-network analysis can subsequently help identify potentially affected assets and disconnected settlements.
For the Trishuli case study, results must be generated independently from permitted inputs before they are compared with EMSR927 reference maps. Published damage maps are reserved for validation, not prediction.
We also considered the importance of presenting analytical uncertainty clearly, maintaining appropriate data attribution, and documenting the limitations of satellite-based assessment.
The current project provides the web prototype and its interface. The complete end-to-end processing of raw satellite imagery and the associated analytical results still need to be implemented and verified before these capabilities can be claimed as operational.
- Challenges We Ran Into
One of our main challenges was translating a complex geospatial problem into an interface that people could understand without requiring extensive technical knowledge.
Flood assessment involves more than displaying satellite imagery. Reliable results depend on suitable image acquisition dates, compatible viewing geometry, accurate geographic alignment, and careful interpretation of observed changes.
Mountainous regions present additional difficulties. Steep terrain can introduce radar shadow and layover effects, while clouds can limit the usefulness of optical imagery. Different satellite viewing geometries can also create apparent changes that are unrelated to flooding.
Another challenge is distinguishing potential exposure from confirmed damage. A building appearing within an estimated flood-affected area does not prove that it has been destroyed. Similarly, a road-network model cannot independently confirm that a road is physically blocked or unsafe.
We also had to consider the strict data-use rules of the challenge. Reference maps from Copernicus EMS, UNOSAT, and other restricted sources must not leak into the prediction pipeline.
Finally, designing an AI-assisted reporting workflow introduced an important reliability question: how can we prevent a language model from inventing statistics or presenting uncertain estimates as facts?
These challenges shaped our approach toward transparent outputs, traceable data sources, and clearly communicated limitations.
- Accomplishments That We're Proud Of
We are proud to have established a web-based prototype for FloodLens and made it accessible through a live deployment.
We have developed a project foundation that connects the problem of satellite-based flood assessment with a user-facing geospatial interface. We have also organized the project's technical direction around three meaningful objectives: flood-extent analysis, infrastructure exposure assessment, and settlement connectivity.
Another accomplishment is establishing a validation-first approach for the Trishuli case study. Rather than treating published disaster maps as prediction inputs, our evaluation plan requires independently generated results to be compared against the official reference data.
We are also proud of the emphasis on responsible AI. Our intended reporting workflow requires numerical statements to be grounded in computed analysis results and recognizes that an AI-generated explanation must not replace evidence.
Most importantly, we have identified the difference between a visually accessible prototype and a scientifically evaluated analysis system. This distinction helps us set meaningful development priorities and communicate our progress honestly.
Our achievement so far is building the project's web foundation and a defined analytical approach. We recognize that demonstrating reliable flood maps, infrastructure-impact calculations, and settlement-connectivity results is the next major milestone.
- What We Learned
Developing FloodLens has helped us understand that building a meaningful disaster-intelligence system requires more than combining a map interface with AI.
We learned that data quality is as important as algorithm design. Satellite observations must be carefully selected and processed before conclusions can be drawn. In mountainous terrain, differences in viewing geometry, surface characteristics, and image quality can substantially affect change detection.
We also learned the importance of geospatial network analysis. Identifying a potentially damaged road is only part of the problem; understanding how that disruption affects connectivity between settlements and essential destinations requires additional analysis.
Another important lesson concerns AI reliability. Language models are useful for explaining results, but critical values should be retrieved from trusted computational outputs rather than generated freely.
We further learned that validation must be independent. A predicted flood map should be evaluated against appropriate reference data, using transparent methods and measurable metrics, without using restricted validation materials to generate the prediction itself.
Finally, we learned that limitations are not weaknesses to hide. Clearly stating what a system cannot determine is essential when designing technology for high-stakes applications.
- What's Next for FloodLens
Our next goal is to move FloodLens from a web prototype toward a reproducible, end-to-end flood-analysis system.
- Automate Satellite Data Processing
Integrate data acquisition and processing for Sentinel-1 and Sentinel-2, allowing users to select an area and event date and obtain analysis from suitable observations.
- Improve Flood Mapping
Develop and evaluate a flood-detection pipeline capable of producing an independently generated flood-extent layer. If a segmentation model is selected, evaluate it on geographically unseen Himalayan scenes.
- Add Infrastructure Impact Analysis
Integrate pre-event OpenStreetMap data to estimate the exposure of buildings, roads, and bridges while clearly separating estimated impact from confirmed damage.
- Implement Settlement Connectivity Analysis
Develop road-network algorithms that identify potentially disconnected settlements under explicitly stated road-disruption assumptions.
- Develop a Grounded AI Copilot
Connect an English-and-Nepali situation-report assistant to structured analysis results. Require every reported measurement to be traceable to computed outputs, and ensure that unavailable information is not invented.
- Validate Against EMSR927
Complete the Trishuli flood case study by comparing independently generated predictions with the official Copernicus EMS reference maps. Report actual evaluation metrics, document uncertainties, and explain any observed errors.
- Strengthen Reproducibility and Responsible Use
Document data provenance, preprocessing decisions, model settings, limitations, and required attributions. Improve the system's ability to communicate uncertainty and avoid claims that are not supported by evidence.
Our long-term vision is to make satellite-based flood assessment more transparent, reproducible, and accessible. FloodLens is a step toward turning complex Earth observation data into understandable geographic information that can support better-informed disaster assessment.
Built With
- ai-assisted
- css3
- disaster-management
- flood-mapping
- geospatial-mapping
- gis
- git
- github
- html5
- javascript
- leaflet.js
- lucide-react
- openstreetmap
- react
- react-leaflet
- satellite-imagery
- sentinel-1
- sentinel-2
- tailwind-css
- typescript
- vercel
- vite


Log in or sign up for Devpost to join the conversation.