Inspiration
Floods don't just damage buildings. They can isolate settlements, cut off roads, disrupt access to essential services, and make it harder for response teams to decide where help is needed first.
Yet, turning satellite imagery and geographic data into a useful picture of potential impact requires multiple steps and different data sources. We built FloodIntel to bring these pieces together into a single flood-impact assessment workflow.
Our goal was to go beyond identifying water and explore a more important question: What could a flood mean for the people, roads, bridges, and settlements in its path?
What it does
FloodIntel is an AI-powered flood-impact assessment prototype that combines satellite imagery, geospatial analysis, and infrastructure data to support disaster-response planning.
Its workflow brings together:
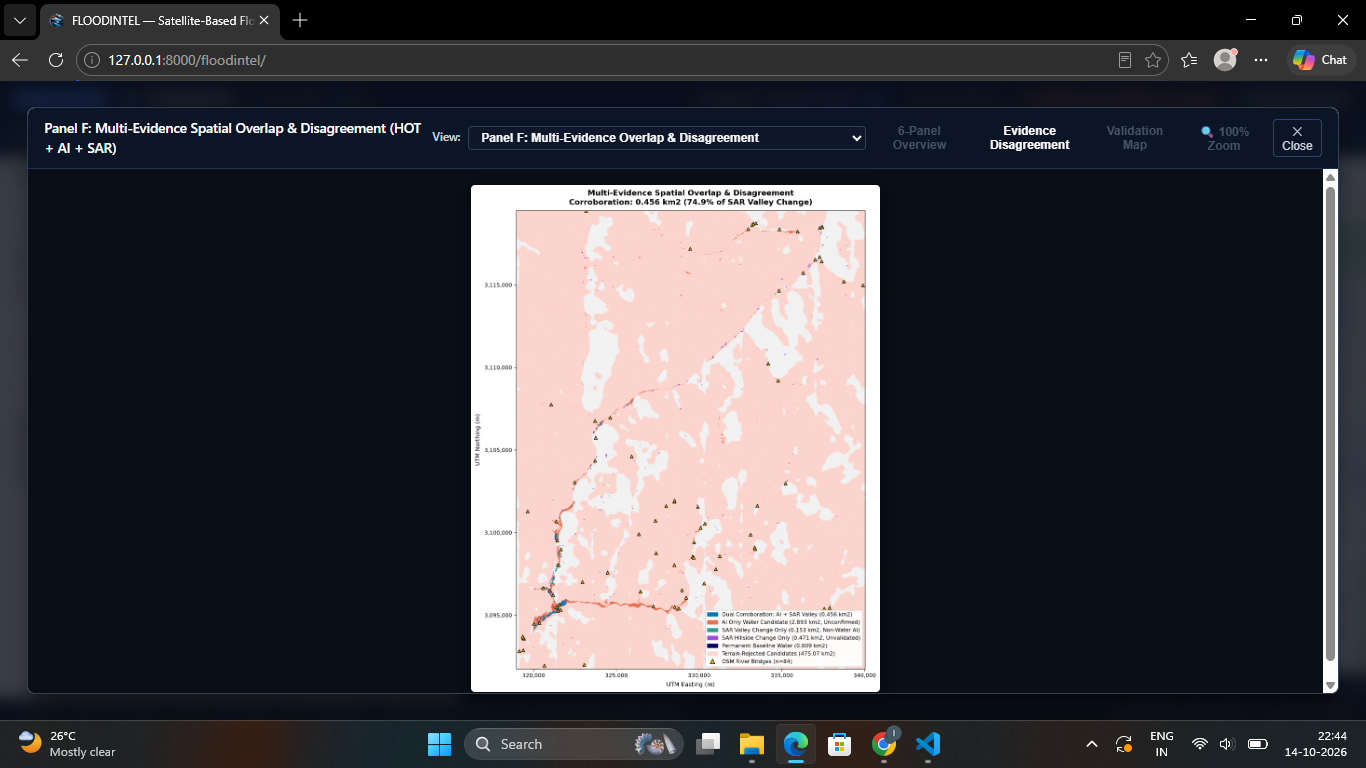
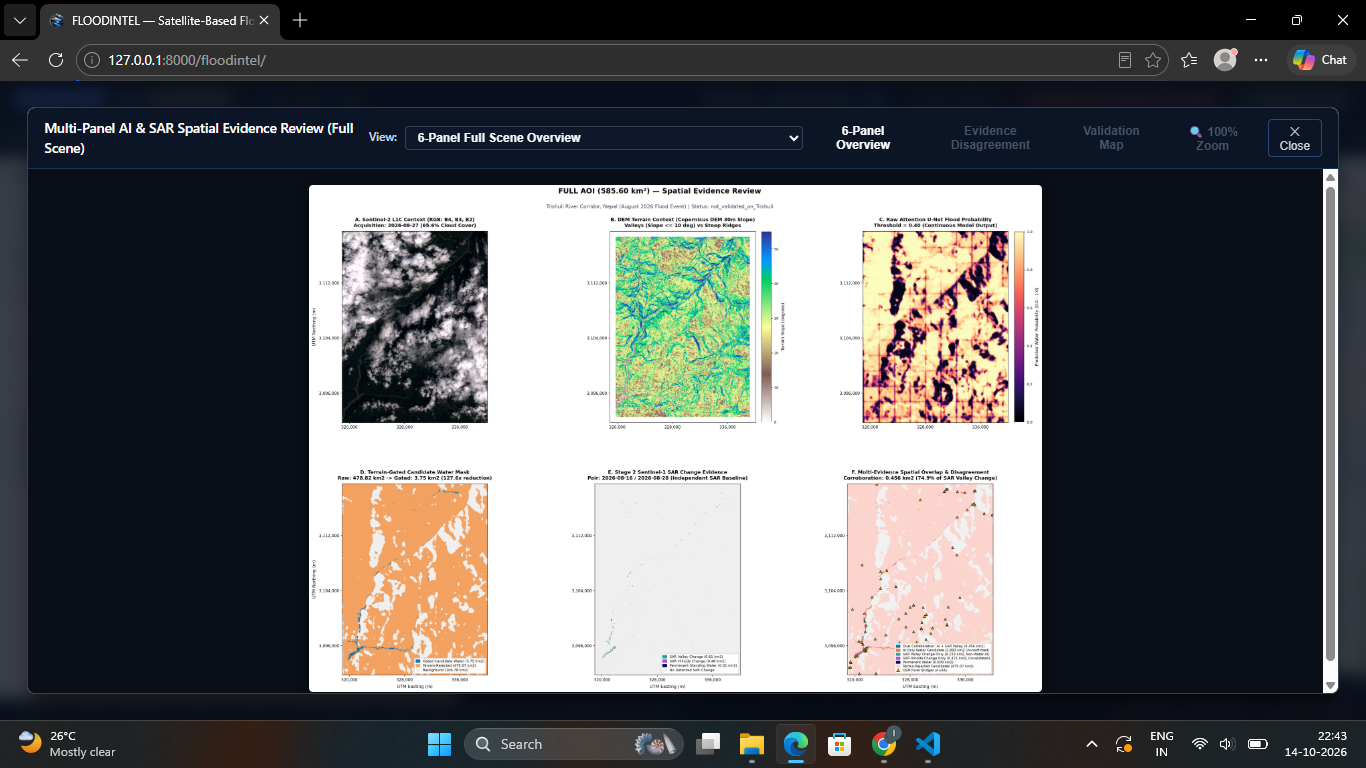
- AI-based flood mapping: Uses an Attention U-Net model to identify potential water-affected areas from satellite data.
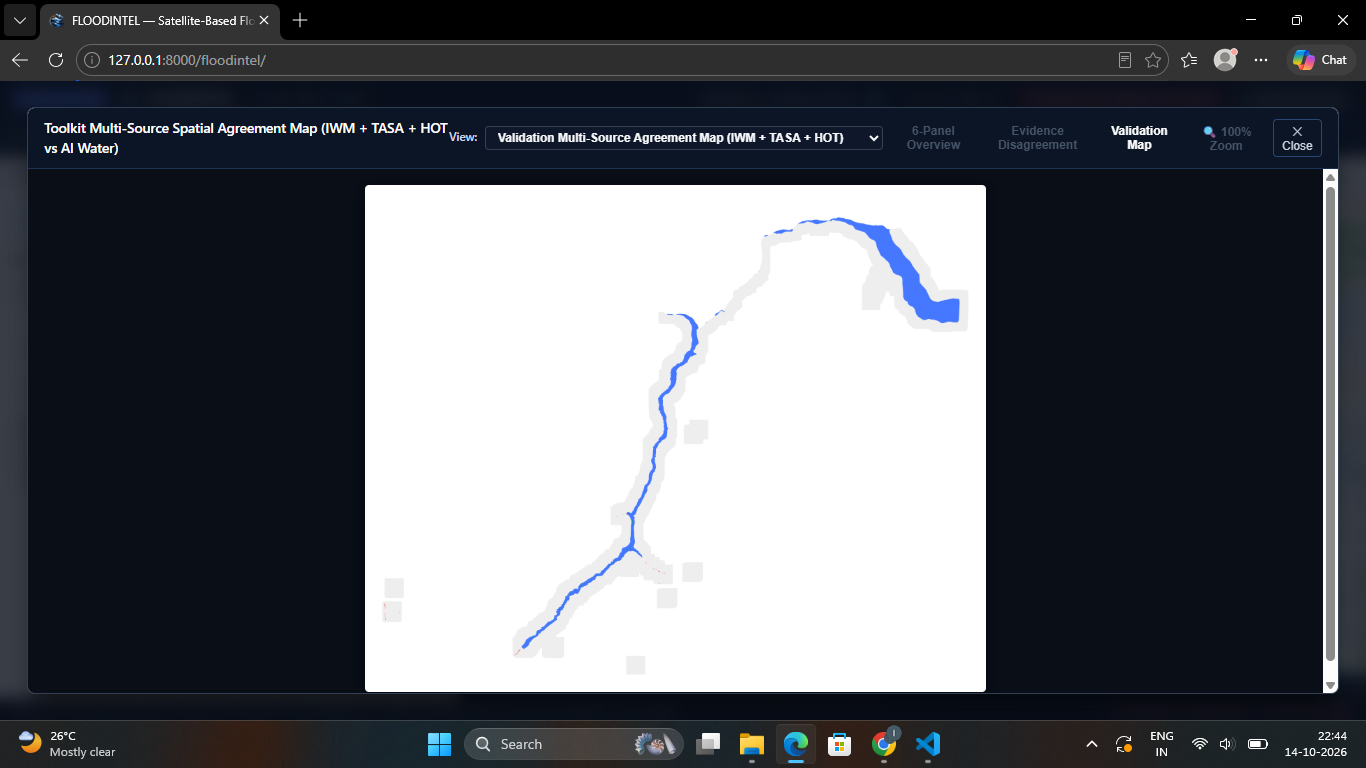
- SAR change analysis: Uses before-and-after Sentinel-1 imagery to identify changes in radar observations associated with possible flooding.
- Multimodal evidence: Combines AI-derived water candidates with satellite-based change analysis to provide complementary evidence.
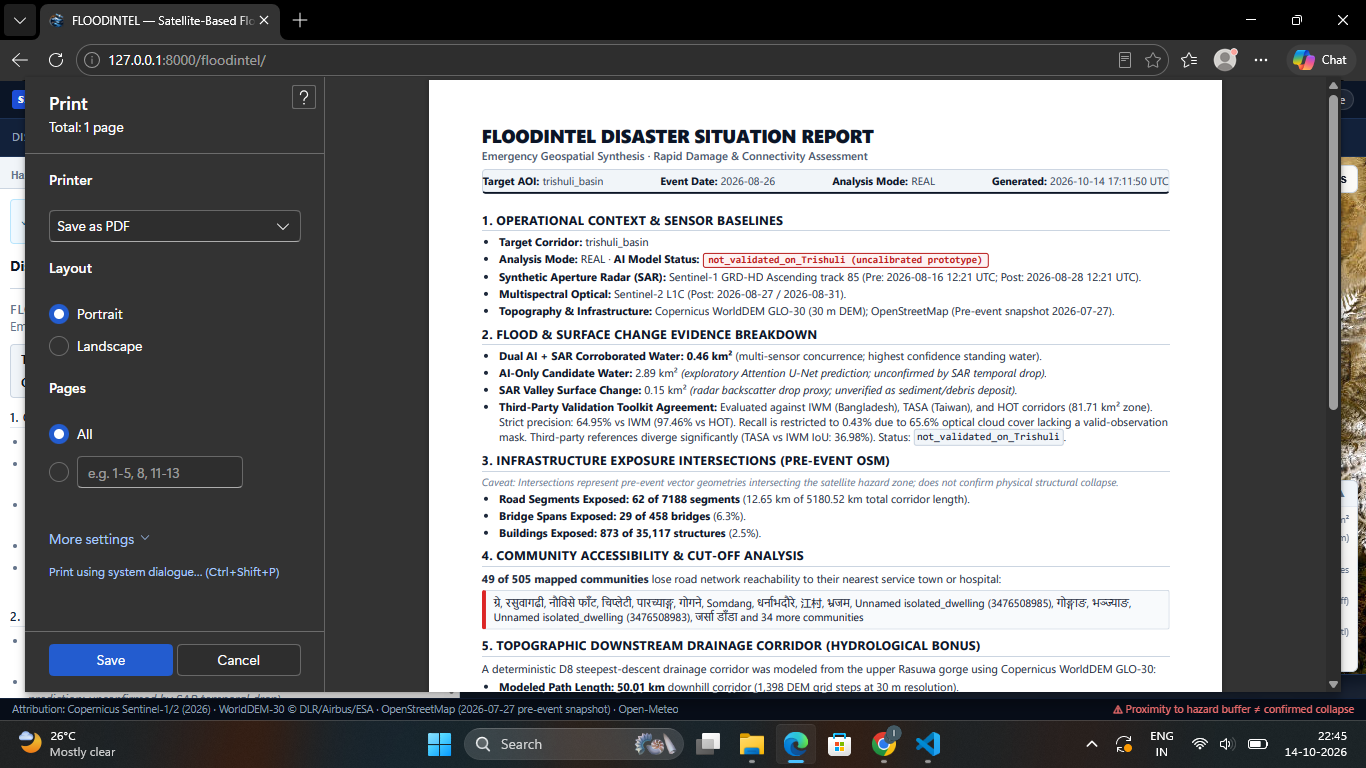
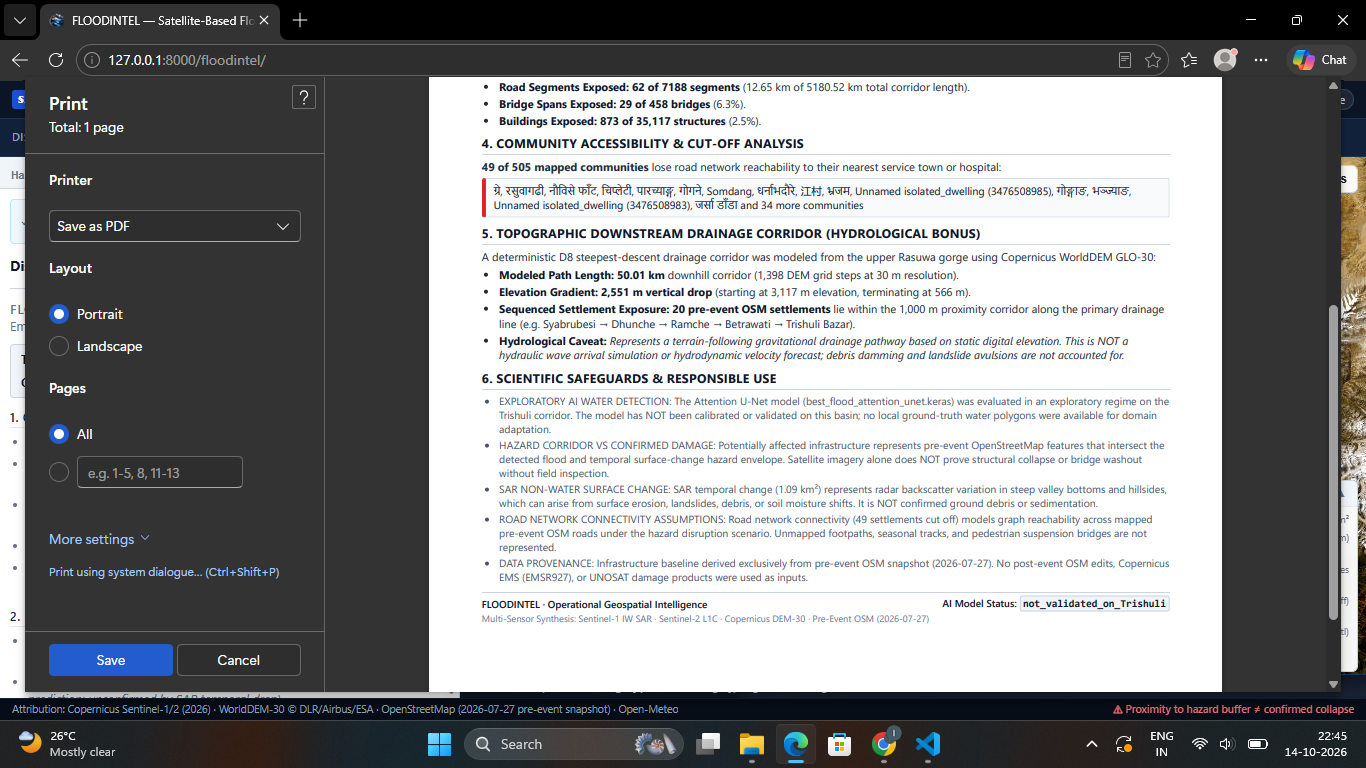
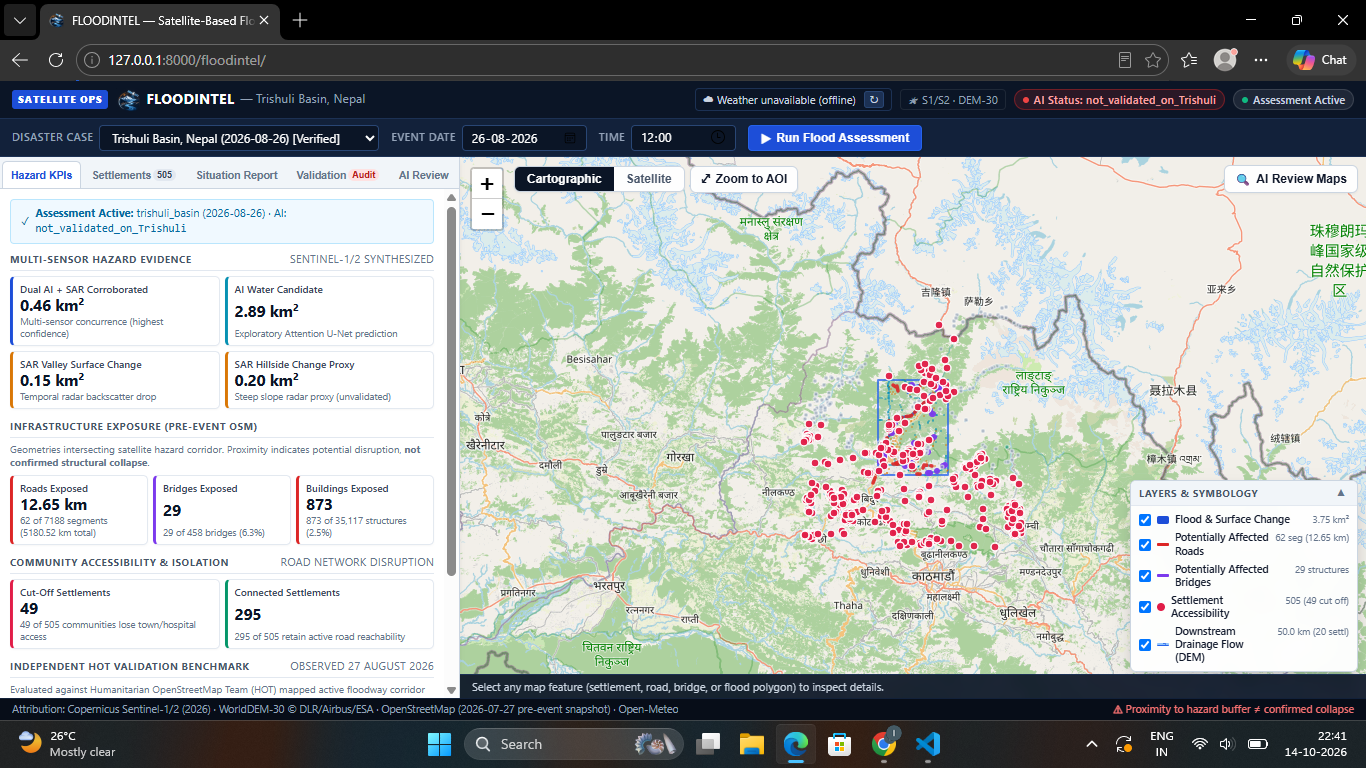
- Infrastructure exposure: Identifies potentially affected buildings, roads, and bridges in the prepared assessment area.
- Settlement connectivity: Analyses road-network connectivity to identify settlements that may become disconnected from the wider network.
- Terrain-based drainage analysis: Uses elevation data to derive a modelled downstream drainage corridor that adds topographic context to the assessment.
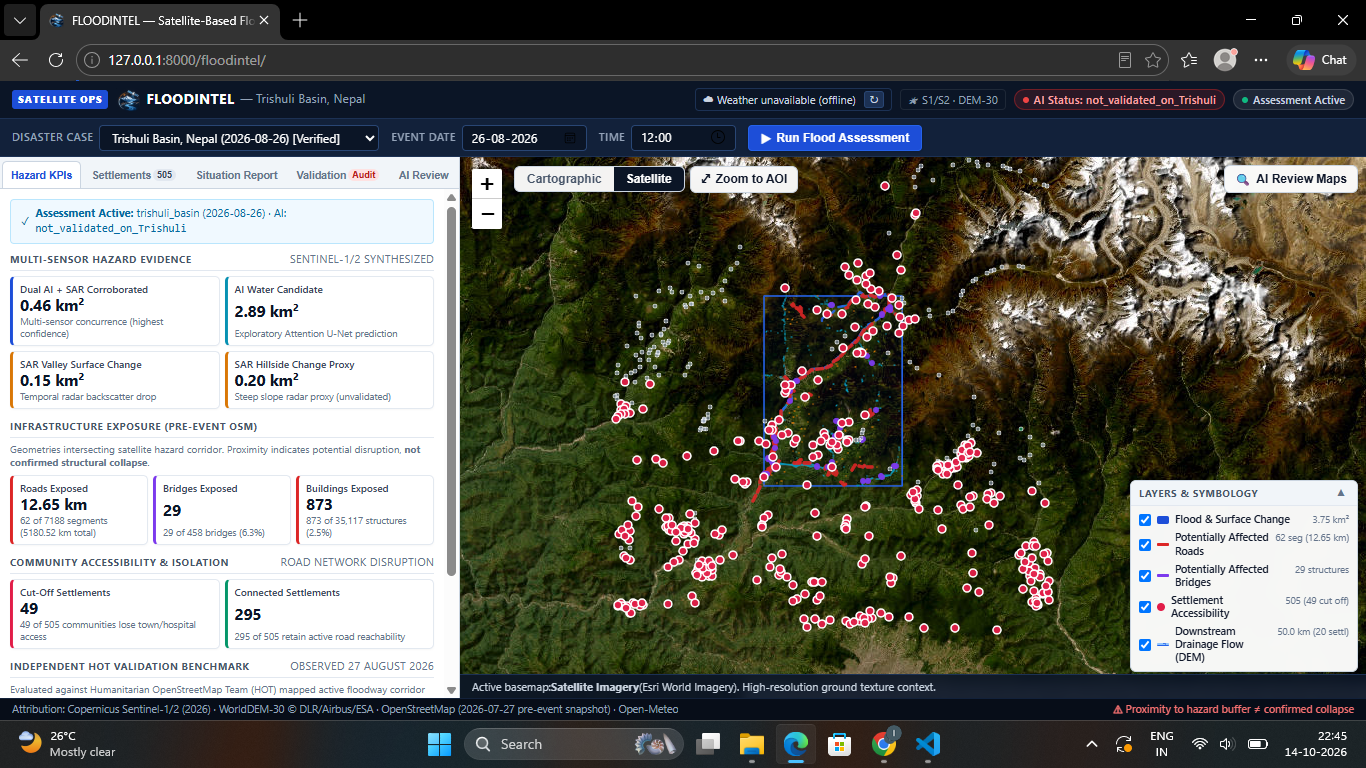
The current prepared case study focuses on the Trishuli Basin, Nepal. FloodIntel presents these outputs through a dashboard designed to make complex geospatial results easier to explore.
How we built it
We developed FloodIntel as a modular application, separating the processing pipeline, AI components, geospatial analysis, API, and dashboard.
The main components include:
- Python for data processing and geospatial workflows.
- TensorFlow/Keras for the Attention U-Net segmentation model.
- Sentinel-1 and Sentinel-2 data for radar and optical satellite analysis.
- GeoPandas, Rasterio, Shapely, and related geospatial tools for working with raster imagery, geographic features, and infrastructure data.
- OpenStreetMap-derived infrastructure and road-network data for exposure and connectivity analysis.
- Digital elevation data for terrain and drainage-corridor analysis.
- FastAPI for the backend API.
- A web dashboard for exploring assessment outputs.
Instead of treating flood mapping as an isolated prediction task, we designed the workflow to connect satellite-derived evidence with infrastructure exposure and network accessibility.
Challenges we ran into
One of our biggest challenges was integrating different kinds of geospatial data into a coherent workflow. Satellite imagery, elevation rasters, buildings, and road networks have different formats, spatial resolutions, and processing requirements.
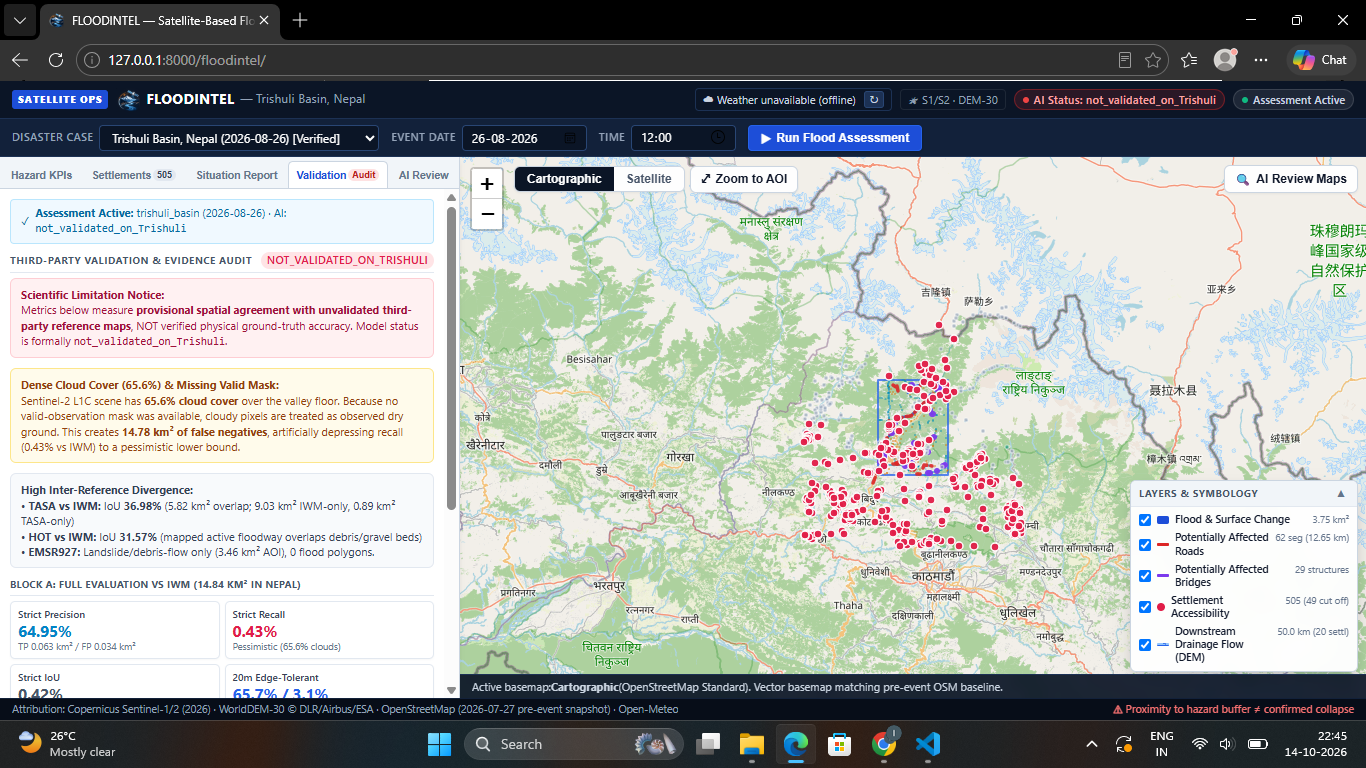
Another challenge was distinguishing between a potential flood signal and confirmed flooding. Radar changes can also result from factors other than water, while optical imagery can be affected by cloud cover and other observation conditions. AI predictions and satellite change signals therefore need to be interpreted carefully.
We also had to consider the computational cost of processing large geospatial scenes and the difficulty of assessing model outputs when reliable ground-truth data is unavailable.
These challenges shaped our approach: present complementary evidence, connect it to potential real-world impacts, and make the limitations of the current prototype explicit.
Accomplishments that we're proud of
We are proud to have brought together AI-based water segmentation, satellite change analysis, infrastructure exposure, settlement connectivity, and terrain-derived drainage analysis in one working prototype.
For the prepared Trishuli Basin case, the workflow produces outputs that go beyond a water mask, including potentially affected infrastructure and settlements whose road-network connectivity may be disrupted.
We also built a dashboard that brings these different layers of analysis into one place, making the results easier to inspect and communicate.
Most importantly, FloodIntel demonstrates how satellite-based evidence and geospatial analysis can be connected to the practical questions that matter during disaster response.
What we learned
We learned that useful disaster intelligence requires more than a model with good benchmark results. Data quality, spatial alignment, infrastructure completeness, computational constraints, and independent validation all influence how outputs should be interpreted.
We also learned the value of combining complementary sources of evidence rather than relying on a single prediction. Radar changes, optical observations, terrain, and infrastructure networks each contribute a different perspective.
Finally, we learned to distinguish between a promising prototype and a validated operational system. FloodIntel is a step toward more integrated flood-impact assessment, but its outputs require further ground-truth validation before they can support operational decisions.
What's next for FloodIntel
Our next steps are to validate the workflow against independent flood reference data, improve the reliability of infrastructure exposure estimates, and test the system across additional prepared study areas.
We also aim to improve processing efficiency and make it easier to incorporate updated satellite observations as they become available.
Our long-term vision is to make flood intelligence more accessible by connecting where flooding may be occurring with which infrastructure and communities could be affected—helping response teams investigate risks and prioritise further assessment.
Built With
- ai
- computer-vision
- css
- digital-elevation-model
- fastapi
- geopandas
- geospatial-analysis
- html
- javascript
- keras
- numpy
- openstreetmap
- python
- rasterio
- remote-sensing
- scikit-image
- scipy
- sentinal-2
- sentinel-1
- shapely
- tensorflow

Log in or sign up for Devpost to join the conversation.