Inspiration
Floods don't just cover land with water — they can cut off roads, isolate settlements, and make hospitals and emergency services difficult to reach. We wanted to build something that could answer a more useful question than “Where is the flood?”: “What is the impact of the flood, and which areas should responders prioritize?”
This inspired us to build flood_detection_system, an interactive flood-impact mapping and decision-support platform.
What it does
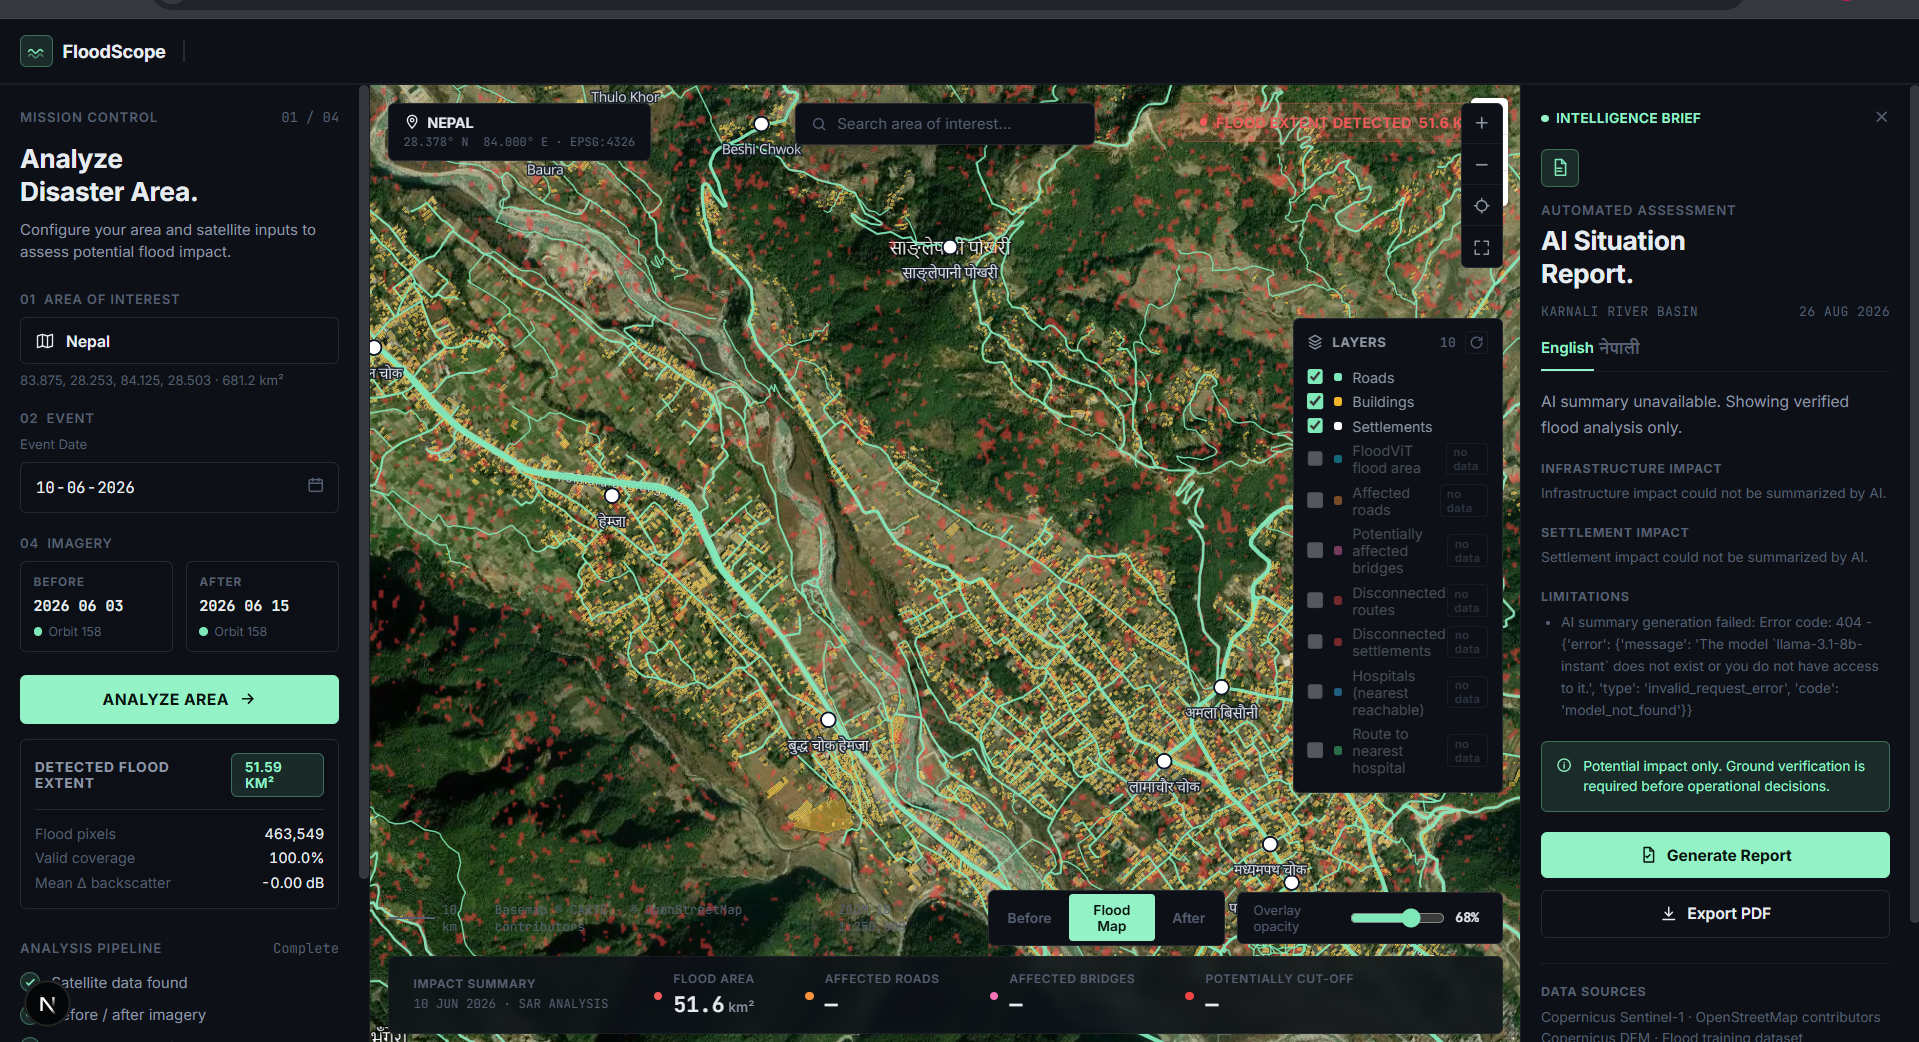
The system combines flood detection with geospatial infrastructure and connectivity analysis.
Detects and maps flood-affected areas using satellite-based data and a flood segmentation model. Converts detected flood regions into flood polygons for visualization. Maps roads, bridges, buildings, settlements, and hospitals using OpenStreetMap data. Identifies infrastructure located within or near affected areas. Analyzes the road network to find potentially disconnected settlements. Provides an interactive MapLibre dashboard for exploring the results. Generates an AI-powered flood impact summary using Groq, based only on verified analysis results. Highlights important locations with interactive map markers.
The goal is to turn raw geospatial analysis into information that can support faster disaster-response decisions.
How we built it
We built the system as a combination of geospatial processing, machine learning, backend analysis, and an interactive web dashboard.
The backend processes satellite imagery and runs flood segmentation to produce geographic flood polygons. We then combine these results with OpenStreetMap infrastructure data and use road-network analysis to understand accessibility and connectivity.
The processed results are stored as structured analysis data and exposed through APIs. The frontend uses MapLibre to visualize flood polygons, roads, bridges, settlements, hospitals, and other important features.
For the AI component, verified results from the analysis pipeline are sent to Groq, which generates a concise impact assessment and recommended actions. The AI is used to explain the results rather than inventing or calculating the underlying statistics.
Challenges we ran into
One of our biggest challenges was bringing different types of geospatial data into a single pipeline. Satellite imagery, flood segmentation outputs, OpenStreetMap features, and road networks all have different formats and geographic representations.
We also had to handle large satellite datasets and model outputs while keeping the web application responsive.
Another challenge was making sure the AI-generated information remained grounded in actual analysis. We designed the workflow so that the geospatial pipeline remains the source of truth, while the LLM only converts verified results into an understandable summary.
Accomplishments that we're proud of
We're proud that we moved beyond simply displaying a flood map.
Our system connects:
Flood detection → infrastructure impact → road connectivity → potentially isolated settlements → AI-powered response summary
We also built an interactive map where users can explore individual hospitals, settlements, bridges, roads, and flood-affected regions instead of looking at a static damage map.
Most importantly, the system attempts to connect technical flood detection with a practical emergency-response question: which locations may be hardest to reach and should receive attention first?
What we learned
We learned that building a real geospatial AI system requires much more than training a model. Data preprocessing, coordinate systems, GeoJSON, spatial relationships, network graphs, API design, and visualization are all equally important.
We also learned how important it is to distinguish between detected flood exposure and confirmed damage. A location inside a detected flood area should not automatically be described as destroyed.
Finally, we learned how LLMs can be useful as a reasoning and communication layer on top of structured analysis, rather than being treated as the source of factual geographic information.
What's next for flood_detection_system
We want to evolve the project from a flood-mapping dashboard into a more complete disaster-response decision-support system.
Future improvements include:
Real-time or near-real-time flood monitoring. More accurate building and infrastructure impact estimation. Better alternative-route and evacuation-route planning. Population and vulnerability data integration. Multi-event comparison to understand how impacts evolve over time. Improved flood prediction before an event occurs. Nepali-language situation reports for local responders. Automated alerts for newly disconnected settlements. Integration of additional elevation and hydrological information to improve flood-path analysis.
Ultimately, we want flood_detection_system to help transform satellite and geospatial data into actionable information that emergency responders can understand and use quickly.
Built With
- fastapi
- geopandas
- groq
- javascript
- networkx
- openstreetmap
- osmnx
- python
- pytorch
- rasterio
- react
- sentinel-1
- typescript

Log in or sign up for Devpost to join the conversation.