-
-
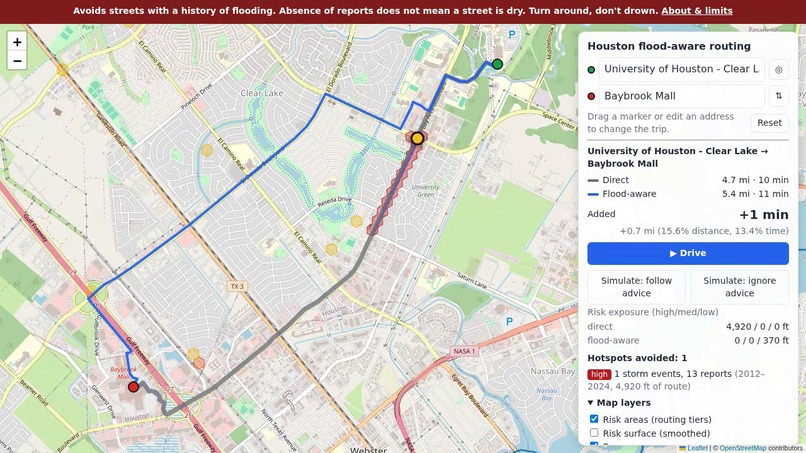
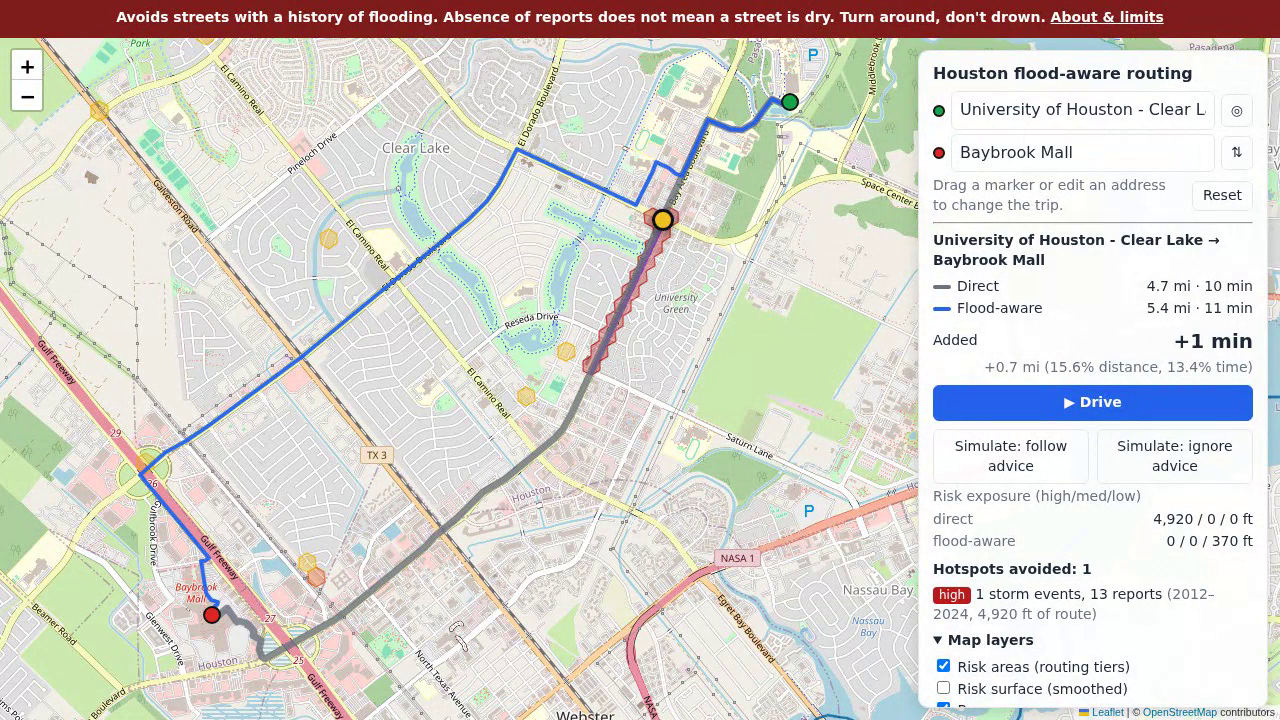
Normal route (grey) vs. flood-aware route (blue): one extra minute avoids the stretch of Bay Area Blvd where firefighters can't get out.
-
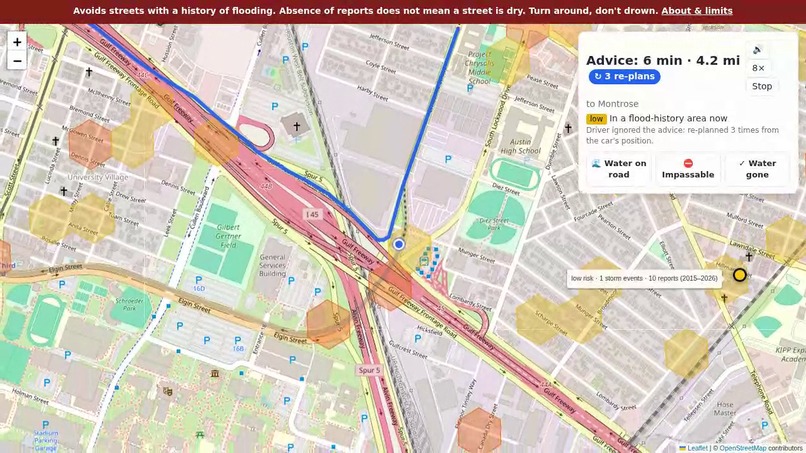
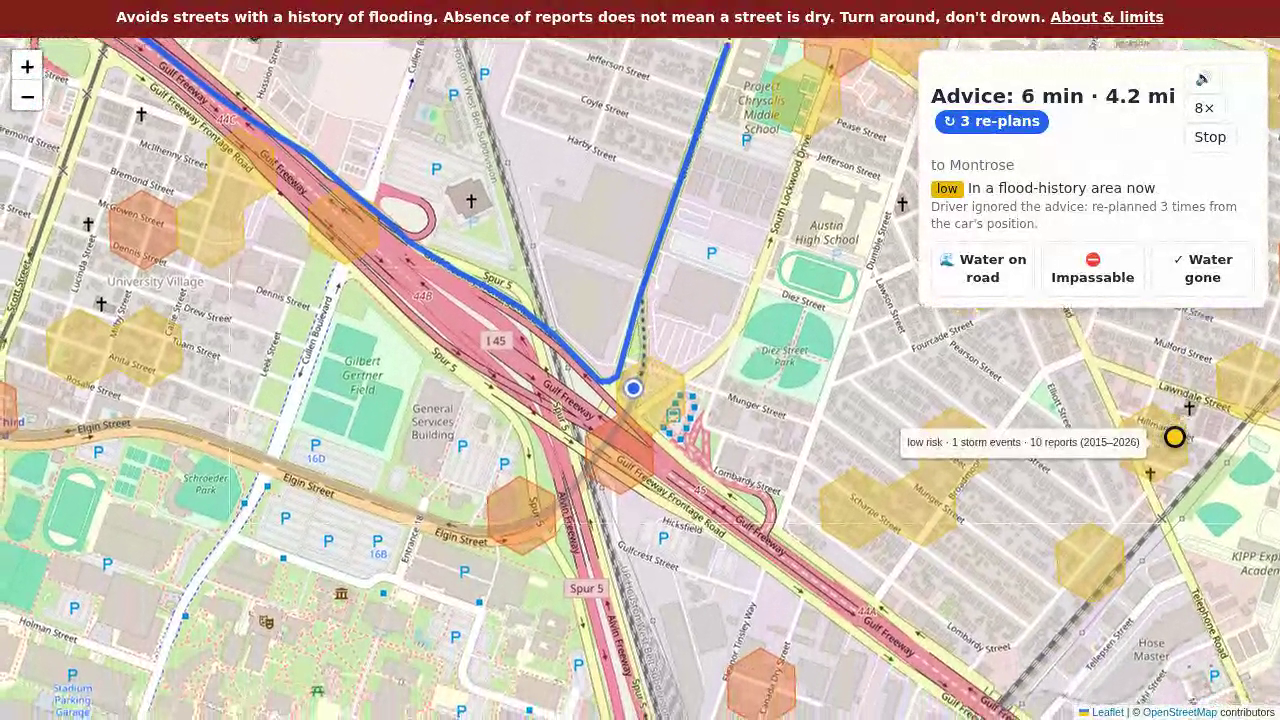
Simulated driver ignoring the advice: the app re-plans from the car's position each time it leaves the flood-aware route.
-
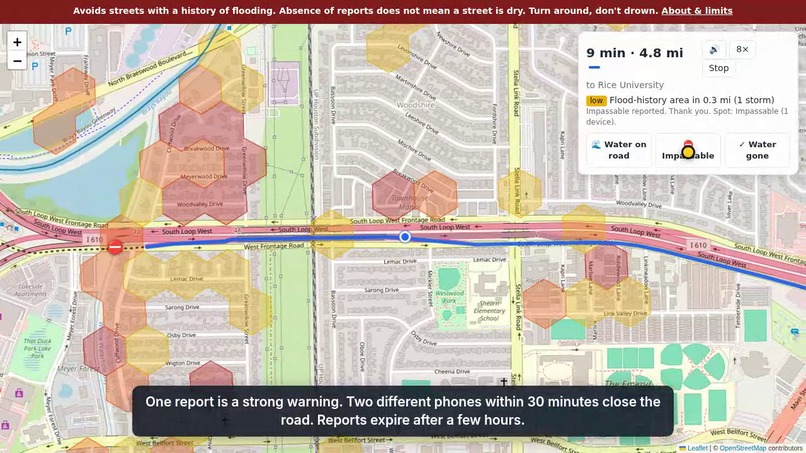
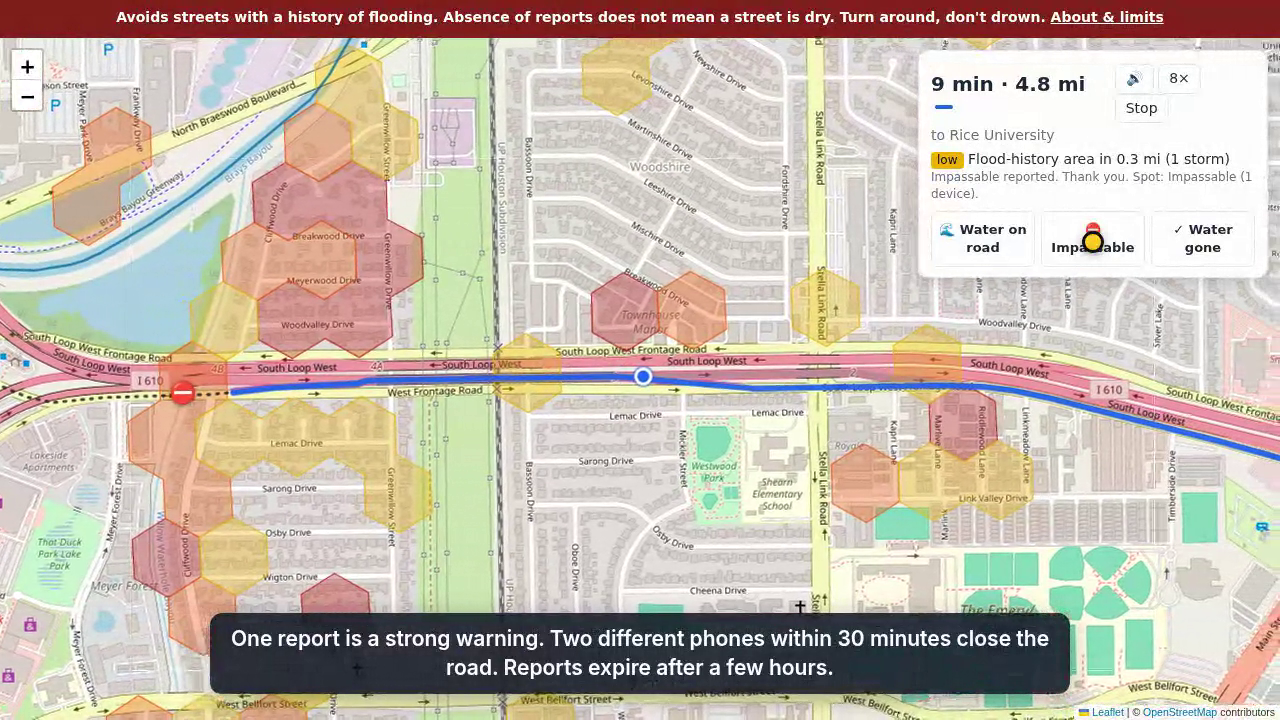
Live reports: one "Impassable" is a strong warning; two phones within 30 minutes close the road.
-
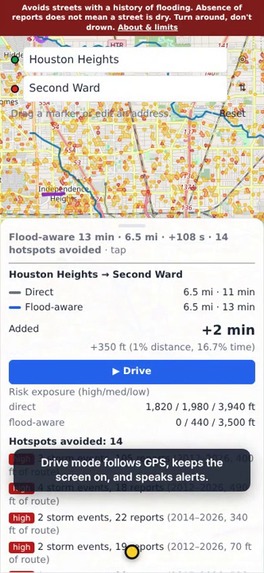
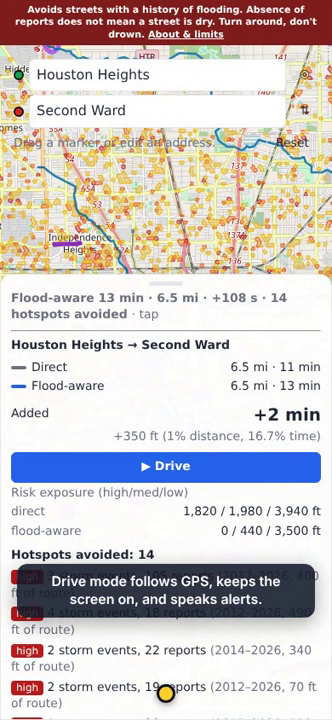
On a phone: added time, risk exposure of both routes, and every flood hotspot avoided.
-
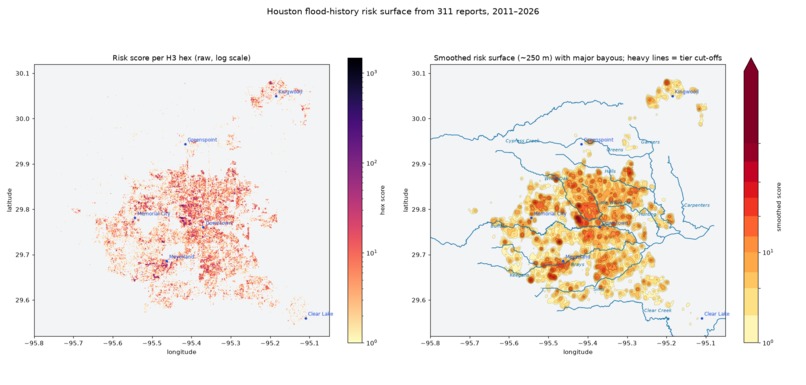
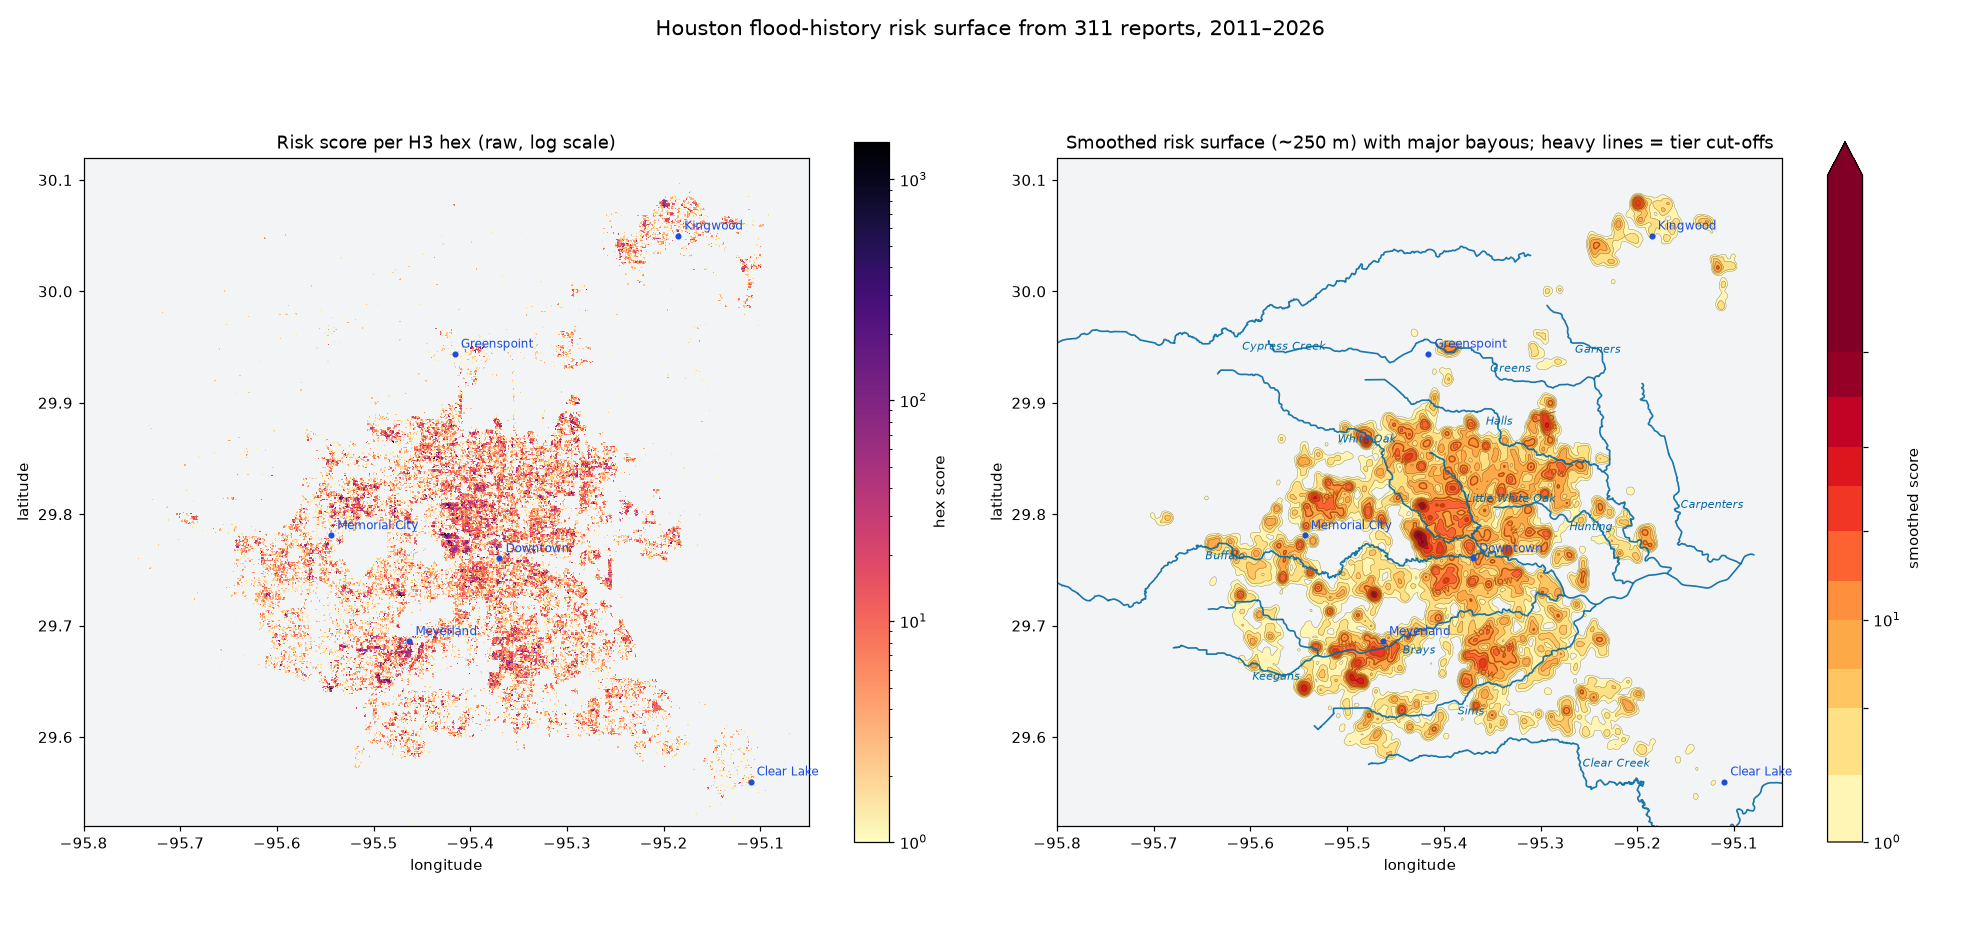
Where Houston's streets flood again and again, from 163,000 flood and drainage reports.
Inspiration
Real time driving routes have become surprisingly easy to program lately. But they lack data. I decided I would take my best shot at collecting the historical street flooding data and build a routing layer. I hope that more historical and live data becomes available to make this project really useful in our next big storm.
Every heavy rain, Houston drivers get stranded, and some drown, on the same streets. The city already knows where many of them are: residents have been calling 311 about flooded streets and blocked drains for fifteen years, and firefighters know the roads their trucks can't get down. But none of that reaches a driver when it matters: in the car, in the rain, choosing a route. Navigation apps route the same way on a storm day as on a dry one.
What it does
floodroutes is a map and driving app that works in any phone or desktop browser at https://floodroutes.nbolt.com, with no install and no login.
- Two routes for every trip: the normal car route (grey) and a flood-aware route (blue) that steers around streets with a history of flooding, with the added time and the flood hotspots avoided.
- The cost is small: over 200 random city trips, the flood-aware route adds a median of about 30 seconds (2–3%). About 80% of trips whose normal route crosses a high-risk area avoid high-risk areas entirely.
- ▶ Drive: follows your GPS, re-routes when you leave the route, keeps the screen on, and speaks warnings: "High flood-risk area ahead in 1,200 feet. Flooded in 5 storms."
- Live flood reports: drivers tap 🌊 Water on road, ⛔ Impassable or ✓ Water gone. Reports snap to the nearest road and change everyone's flood-aware route: one "Impassable" is a strong penalty, two from different phones within 30 minutes close the road, and reports expire after 2–3 hours.
- Map layers: risk areas, a smoothed risk surface, bayous, and firefighter-reported flood locations with the officers' own words.
- Simulate drive: watch a car follow the advice, or ignore it and see how often the app has to re-plan.
History only lowers a road's priority; it never closes a road. Only live reports close roads. A permanent banner says: "Absence of reports does not mean a street is dry. Turn around, don't drown."
How we built it
- 311 archive: every public City of Houston 311 file, 2011 to today plus the Harvey extract: 5.6 million service requests, loaded into PostgreSQL/PostGIS with provenance on every row and a nightly refresh.
- Classification: rules on request type and text find 163,000 flood and drainage reports, in three confidence tiers. I checked random samples by hand and tuned the rules (strong tier about 90% precise). Daily counts detect 25 storm events, which caught every named Houston flood.
- Geocoding: 97.7% of flood reports located, with a self-hosted address index and the Census geocoder.
- Risk surface: reports go onto a hexagon grid (Uber H3, ~130 m cells), scored by how many separate storms flooded each spot, so one-off maintenance calls don't count. Result: 4,095 risk areas in three tiers; high risk covers 0.7% of the city.
- Firefighters: I transcribed 26 place-specific officer comments from Rice/Kinder's 2018 survey of the Houston Fire Department (Measuring Flooding with the Houston Fire Department, Perry & Stein) and mapped 22 onto streets. They raised the risk of 294 hexes that 311 under-reports.
- Routing: GraphHopper, an open-source routing engine, on OpenStreetMap roads. A small Java plugin stores each road segment's flood risk at import, and the flood-aware profile lowers priority by 20× on high-risk segments. Both routes plus the map overlay come back in about 22 ms.
- App: FastAPI backend and a Leaflet web page, with browser speech for voice alerts. Hosted on one small NixOS server; the data pipeline runs on a separate machine.
- Privacy: 311 text includes residents' names and phone numbers. It stays in the database only; the API, map and repo carry aggregates (tiers, counts, year ranges). Live reports store a road point and a hashed device token, nothing else.
- With help from: Claude Code (Anthropic) as an AI pair programmer.
Challenges we ran into
- 311 is noisy. "Drainage" requests are mostly ditch mowing and trash, and "flood" appears in unrelated requests. The fix was to score recurrence across storms: dry-day maintenance calls don't repeat storm after storm, real flooding does.
- 311 is where residents call from. Freeways and bayou-side roads with few front doors barely show up. The firefighter survey filled some of those gaps; river gauges and TranStar sensors would fill more.
- Speed. Checking flood polygons on every road segment during each route made the flood-aware route take up to ~850 ms. Moving flood risk into a per-segment value at graph import brought it to ~22 ms.
- How much to avoid. Too strong a penalty sends drivers on long detours; too weak and the route drives through hotspots. The setting is a policy choice and is one line in a config file.
- Trusting live reports. One phone shouldn't close a road for the whole city, and a road shouldn't stay closed after the water drains. Hence two-device rules and expiry.
Accomplishments that we're proud of
- A working public site that anyone in Houston can use today, on the phone they already have.
- Avoiding the city's flood history costs about half a minute on a typical trip.
- The data checks out: 25 detected storm events matched every named flood, and Hurricane Beryl was correctly not flagged, because 311 shows it as a wind storm (trees, debris and signals), not a flood.
- Firefighters' knowledge, written down in a 2019 report, is now on the map and in the route, with the officers' quotes.
What we learned
- Fifteen years of 311 calls are a surprisingly good flood map, as long as you count storms rather than calls.
- Where 311 is silent tells you as much as where it's loud: firefighters and residents see different floods.
- The street grid is so dense that avoiding a hotspot almost always costs tens of seconds, not minutes.
What's next for floodroutes
- Who would use it: drivers during storms; school-bus and delivery fleets; 911 and HFD dispatch choosing routes for units; the City and TxDOT as a public flood-aware routing service.
- Live data: Harris County Flood Control District river gauges (close Braeswood when Brays Bayou leaves its banks) and TranStar underpass flood sensors, as hard road closures.
- HFD water-rescue incidents: 1,570 flood incidents from 2019–2025 are loaded but not yet used. 80% fall outside the current risk areas. The next step is to ask Rice and HFD for permission and provenance.
- Other cities: everything is open source and built from public data. Any city with a 311 archive and OpenStreetMap roads can run the same pipeline.
- Funding: a flood-resilience grant or a City partnership would pay for one server day to day plus cloud servers during storms: about $150 to serve 15,000 drivers at once through a 48-hour event (
docs/SCALING.md).
Part of a Houston flood toolkit: Know it (fasthouston.org, the civic data analyst), See it (Flood AR: demo), Act on it (floodroutes).
Built With
- claude
- fastapi
- graphhopper
- h3
- java
- javascript
- leaflet.js
- nginx
- nixos
- openstreetmap
- playwright
- polars
- postgis
- postgresql
- python
- shapely
- sqlite

Log in or sign up for Devpost to join the conversation.