-
-
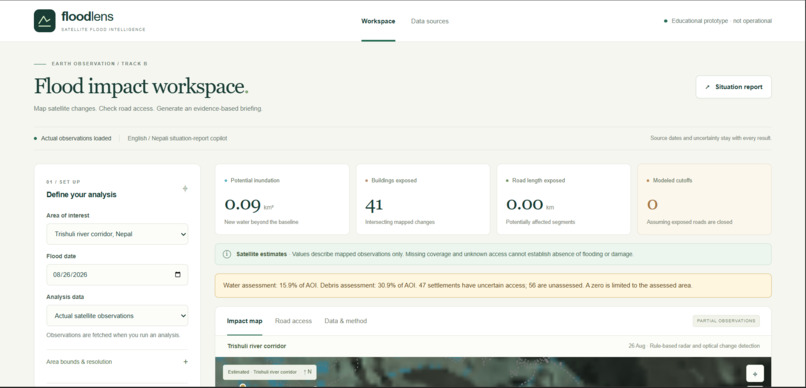
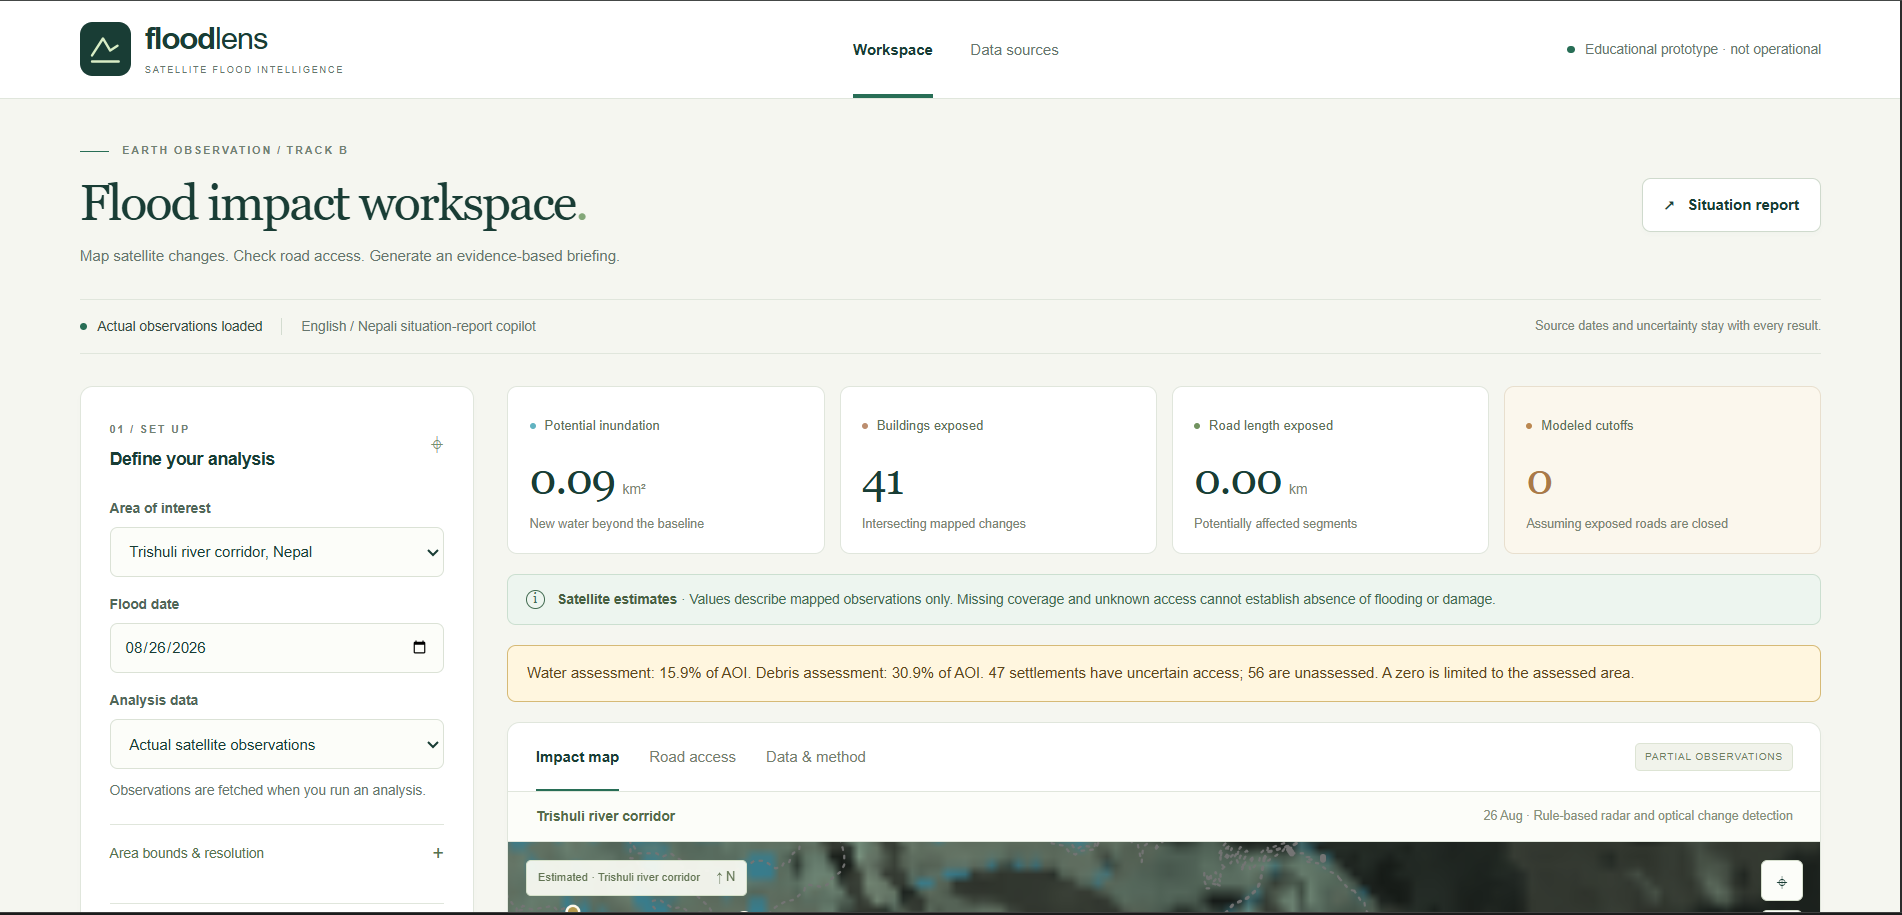
Home page
-
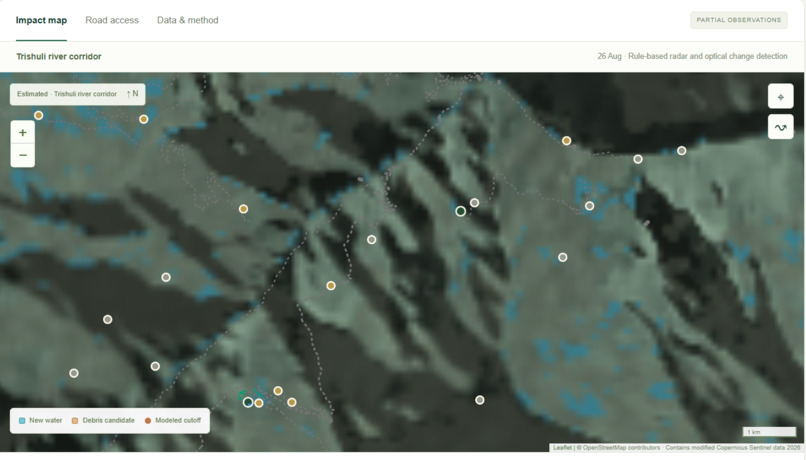
Dashboard
-
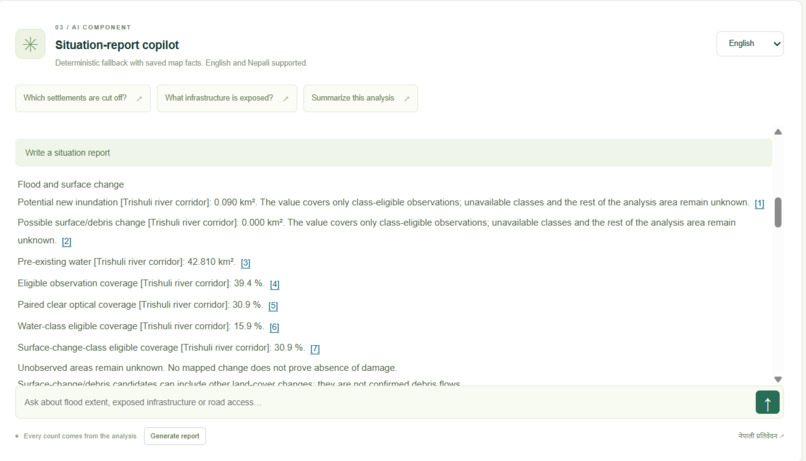
Chat Copilot
Inspiration
On 26 August 2026, a glacier partially collapsed in northern Nepal, sending a devastating flood of water, mud and debris down the Bhote Koshi–Trishuli river corridor. Over 1,300 lives were lost and nearly 5,000 people remained missing or out of contact. Roads, bridges and phone lines were destroyed — leaving rescuers blind to where the damage was worst and which villages had been cut off.
We asked ourselves: when ground infrastructure fails, can space fill the gap? Free satellite data from ESA's Sentinel constellation covers every valley of the Himalaya. Radar sees through monsoon clouds; optical sensors reveal surface detail. The raw data exists — the challenge is turning it into trustworthy, actionable answers fast enough to matter. That's what Flood Lens was built to do.
We were also inspired by the critical gap in bilingual disaster communication. Nepal's official language is Nepali, yet most satellite analysis tools produce English-only outputs. Rescuers, local authorities and affected communities need information in their own language — with numbers they can trust, not hallucinated by an AI.
What it does
Flood Lens is an end-to-end satellite flood-impact mapping system with a bilingual AI situation-report copilot. Given any area and flood date, it:
🛰️ Maps flood damage from space
- Acquires Sentinel-1 SAR radar imagery (pre-event and post-event) from the same orbital track, ensuring pixel-comparable observations that see through monsoon clouds
- Processes Sentinel-2 optical imagery when clear skies are available, providing additional vegetation/debris change detection
- Performs local terrain correction using Copernicus DEM GLO-30, including annotation-driven incidence angle computation, local layover detection and DEM shadow screening
- Applies rule-based change detection with configurable thresholds: radar backscatter drop for new water, NDWI changes for optical water, and vegetation-index shifts for debris candidates
- Enforces terrain eligibility (slope screening) and minimum-component-size filtering to reduce false positives
🏗️ Assesses infrastructure exposure
- Intersects detected flood/debris extents with historical pre-event OpenStreetMap buildings, roads and bridges
- Computes area-weighted building footprint coverage and per-hazard-class assessment fractions
- Measures exposed road lengths with continuous overlap requirements
🚗 Models settlement connectivity
- Builds a directed road graph honoring one-way streets and basic vehicle restrictions from pre-event OSM
- Simulates road closure scenarios where flood candidates overlap road segments beyond a half-cell threshold
- Computes shortest-path distances to hospitals and towns — both before and after disruption
- Identifies settlements that have lost their modeled road connection, with separate hospital-access and town-access analysis
🤖 AI Situation-Report Copilot (Track B AI Component)
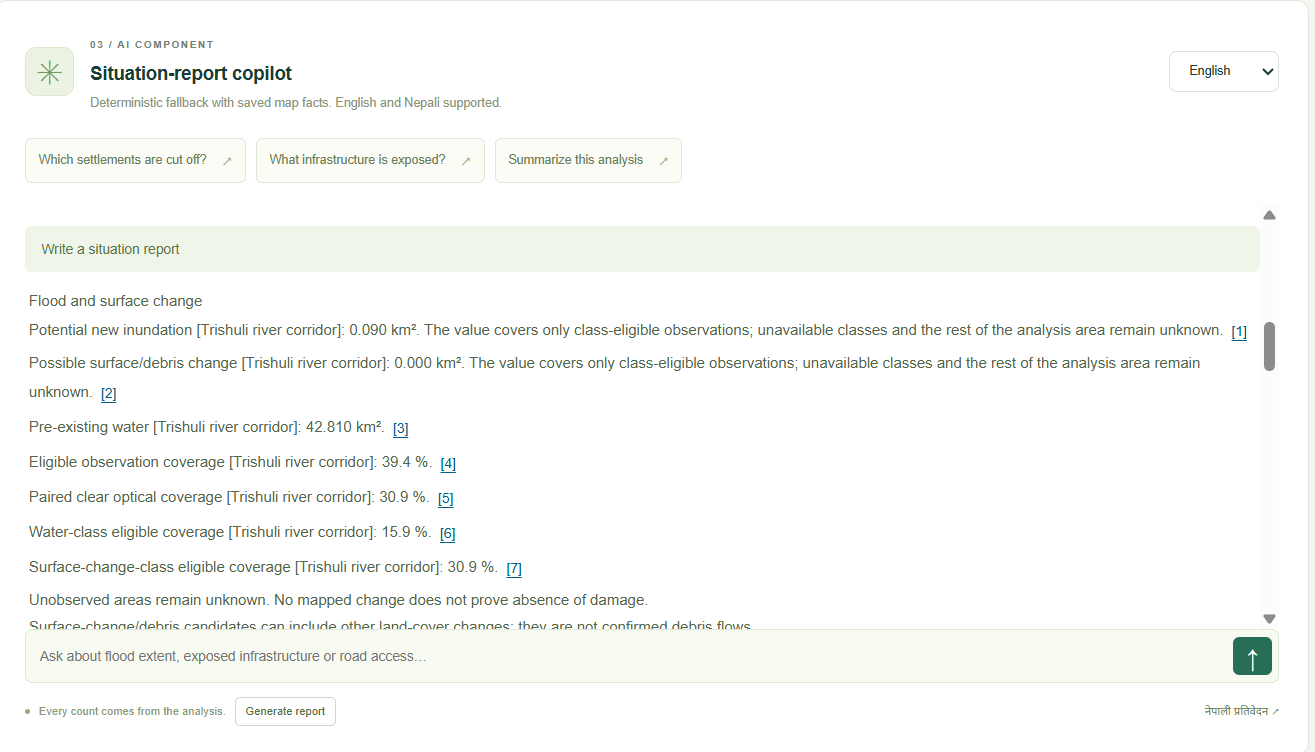
- Ask questions about flood extent, infrastructure exposure, road access, acquisition dates or limitations — in English or Nepali
- Every number, date and settlement name comes from the saved analysis; the LLM cannot invent values
- Powered by Groq's SDK (hosted
openai/gpt-oss-120b), with strict tool-calling and structured claim validation - Deterministic bilingual fallback available when the LLM is disabled or unavailable
- Generates one-page PDF/HTML situation reports with full provenance, uncertainty disclaimers and proper attribution
🗺️ Interactive Dashboard
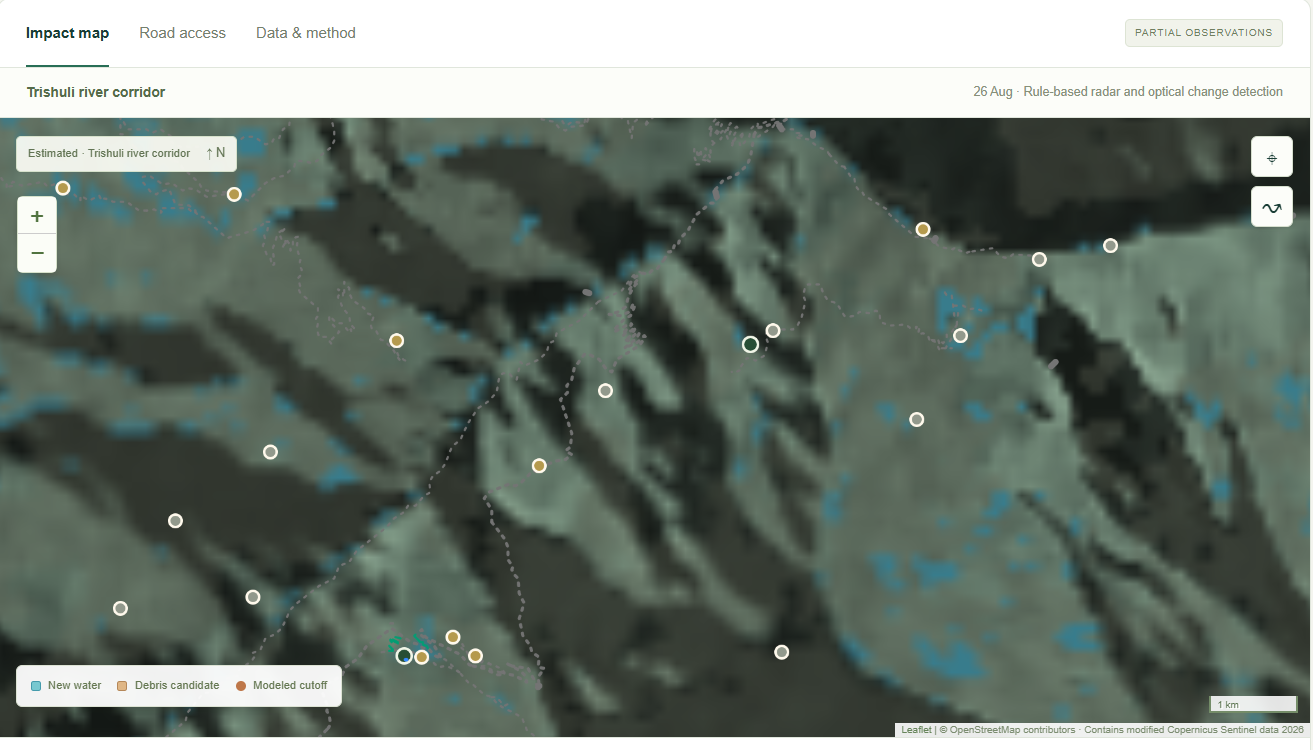
- Leaflet-based map showing flood extent, debris candidates, exposed buildings, disrupted roads and cut-off settlements
- Real-time analysis progress with stage-by-stage updates
- Clickable features with evidence drilldown — every map element links to its source data
- Settlement cards showing before/after route distances and connectivity status
- Observation coverage indicators and class availability tracking
📊 Bonus: Downhill Flood Trace
- Given any upstream point, traces the D8 flow path down the valley using DEM elevation data and lists settlements along it
How we built it
Backend — Python 3.12 + FastAPI
- The core pipeline (
pipeline.py) orchestrates the full workflow: satellite acquisition → terrain correction → change detection → impact assessment → report generation - Two satellite data providers: Copernicus Sentinel Hub (CDSE OAuth) for on-demand processing, and a public Microsoft Planetary Computer path that downloads raw GRD measurement/annotation files and performs local gamma0 terrain correction using the
sarsenlibrary - Local SAR processing includes thermal noise removal from annotations, beta0 calibration, Copernicus DEM terrain correction, mask-aware median speckle filtering (3×3, minimum 3 valid samples), and annotation-driven terrain screening (self-shadow, layover, occlusion flags via ray casting)
- Historical OSM snapshots from the ohsome API, strictly dated before the event (27 July 2026 cutoff for the Nepal case)
- Road-network analysis with NetworkX: directed multigraph with one-way edges, 100m snap-to-road tolerance, and continuous overlap closure simulation
- Impact assessment (
impact.py) with per-hazard-class eligibility tracking — unavailable observations remain unknown, never zero
Copilot — Evidence-Grounded AI
evidence.py: ~410 lines of typed evidence extraction with 40+ validated fact fields, each with English/Nepali labels, units, interpretation semantics and uncertainty disclaimersgrounding.py: Semantic claim validation — the LLM can only reference fact IDs from approved tools; Python resolves the actual values with fixed display precisioncopilot_service.py: Bounded Groq tool loop (2 retrieval rounds, 6 tool calls, 1 draft, 1 repair attempt, 30-second budget)- 6 approved read-only tools:
event_summary,flood_surface_change,infrastructure_impacts,settlement_connectivity,sources_limitations,feature_evidence— no filesystem, SQL, shell or web access - Compound questions, named feature references and follow-ups like "What about the villages on that road?" work through saved route identifiers and contextual evidence
Reports — Bilingual PDFs
- WeasyPrint + Pango rendering with bundled Noto Sans Devanagari fonts
- Typed
SituationReportPydantic model with sections, facts, attributions and generation metadata - Reports include satellite observations, flood findings, infrastructure exposure, modeled connectivity, sources, and always-present limitations sections
Frontend — Vanilla JS + Leaflet
- Single-page dashboard with real-time polling of analysis progress
- GeoJSON layers with feature-specific evidence popups
- Settlement connectivity cards with on-demand route geometry loading
- Synthetic vs. actual run distinction throughout the UI
Testing — 18 test files, 100+ test cases
- Comprehensive pytest suite covering analysis, copilot Q&A, evidence grounding, LLM config, provider behavior, impact repairs, delivery quality and more
Challenges we ran into
Terrain complexity in the Himalayas: The steep terrain of the Trishuli corridor creates severe radar shadow, layover and foreshortening. We had to implement annotation-driven incidence angle computation and finite-range DEM ray casting to screen out unreliable observations — only ~13.6% of the AOI had eligible water observations in our real analysis
Preventing AI hallucination: The core challenge of the copilot was ensuring the LLM never invents numbers. We built a full evidence-grounding system where the model can only select from pre-computed facts via approved tools. Every claim references a specific
fact_id, and Python validates subject identity, field type and interpretation before rendering the actual value. This required ~1,000 lines of validation codeBilingual output with technical accuracy: Nepali translations of technical terms like "potential infrastructure exposure" or "modeled loss of road connection" don't have standard equivalents. We created a full Nepali glossary and authored controlled bilingual phrases rather than allowing free-form translation, which would risk changing the certainty level of claims
Observation availability tracking: Different hazard classes (water vs. debris) have different observation requirements. We had to build a full class-availability system where unavailable measurements remain
nullthroughout the pipeline, UI and reports — never silently becoming zeroOSM data integrity: Historical OSM needed to be strictly pre-event. Post-event OSM edits (added after the disaster) and published damage maps had to be rigorously excluded from analysis inputs while still being available for evaluation
SAR processing from raw GRD: Building a public-path SAR processor that downloads original measurement and annotation files, applies thermal noise removal, beta0 calibration and gamma0 terrain correction locally (without relying on pre-processed RTC products that use different DEMs) was a significant engineering effort
Accomplishments that we're proud of
Zero-hallucination copilot: The LLM physically cannot supply a number — it can only reference fact IDs from approved tools. Python resolves every value, unit, label and uncertainty disclaimer. Schema or semantic failures trigger a deterministic fallback, never a made-up answer
End-to-end from raw satellite data: The system runs from raw Sentinel-1 GRD downloads to a printable bilingual PDF situation report, with no manual steps and no pre-processed inputs
Honest uncertainty: Flood Lens never claims certainty it doesn't have. Unobserved areas stay "unknown," not "undamaged." Mapped intersections are "potential exposure," not "confirmed damage." Modeled road closures are explicitly labeled as scenarios, not verified field conditions. We believe this honesty is critical for tools used in disaster response
Real-data validation: We completed a full analysis of the actual August 2026 Nepal disaster using real Sentinel-1 acquisitions from orbit 85 and real pre-event OSM from ohsome, with independent EMSR927 evaluation (even though the reference polygons were landslide-class, making cross-validation difficult)
Robust bilingual reporting: One-page PDF reports in both English and Nepali, with proper Devanagari rendering using bundled fonts, complete attribution chains, and consistent terminology throughout
Comprehensive test suite: 18 test files with 100+ test cases covering everything from copilot question understanding to impact calculation edge cases to LLM configuration validation
What we learned
Radar change detection is powerful but limited: SAR sees through clouds (critical during monsoon season), but mountain terrain creates severe geometric distortions. Only a fraction of a mountainous AOI may have usable observations — understanding and communicating this coverage limitation is as important as the detection itself
Grounding AI in evidence is hard but essential: Building a copilot that never lies requires far more code than the LLM integration itself. The evidence typing, tool registry, claim validation and deterministic fallback together represent the largest module in the application
"Not zero" ≠ "unknown": The distinction between "we looked and found nothing" vs. "we couldn't look" is critical in disaster mapping. This required a fundamental rethinking of how null values propagate through every layer — from raster processing to JSON APIs to PDF reports to copilot answers
Bilingual technical communication requires domain expertise: Machine translation of disaster-response terminology can change the meaning of uncertainty qualifiers. Controlled authoring of parallel phrases, while less flexible, preserves the intended certainty level
Data provenance matters: In disaster response, knowing which satellite, which orbit, which date, which processing produced a result is as important as the result itself. We learned to thread provenance metadata through every layer of the system
What's next for Flood Lens
Native Nepali language review: Our Nepali terminology needs verification by native speakers with disaster-response domain knowledge
Field validation: Ground-truth comparison with actual damage surveys to establish Himalayan accuracy metrics
Improved optical integration: Better cloud masking and multi-temporal compositing to increase debris-class coverage in cloudy mountain environments
Real-time alerting: Integration with Sentinel-1 near-real-time data feeds for faster post-event analysis
Broader geographic coverage: Testing and calibrating detection thresholds for different terrain types beyond steep Himalayan valleys
Community integration: Working with Nepal's NDRRMA and local disaster response teams to validate the tool's usefulness in actual operational workflows
Enhanced copilot capabilities: Supporting more complex analytical queries like temporal comparisons between multiple analysis runs and trend monitoring
Mobile-optimized dashboard: A lightweight interface for field teams with limited connectivity
Built With
- copernicus-data-space-ecosystem
- copernicus-dem
- fastapi
- geopandas
- groq
- httpx
- javascript
- leaflet.js
- microsoft-planetary-computer
- networkx
- numpy
- ohsome
- openstreetmap
- pillow
- pydantic
- pyproj
- python
- rasterio
- sarsen
- scipy
- sentinel-1
- sentinel-2
- shapely
- uvicorn
- weasyprint

Log in or sign up for Devpost to join the conversation.