-
-
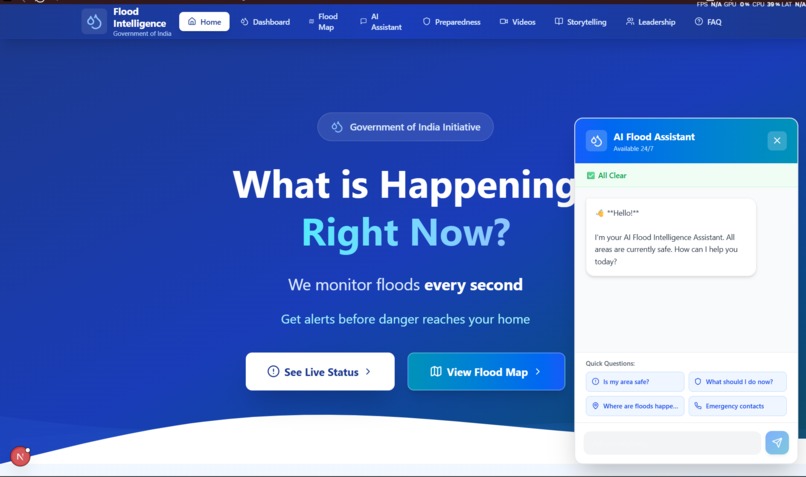
Real-time flood monitoring to keep India safe, every second.
-

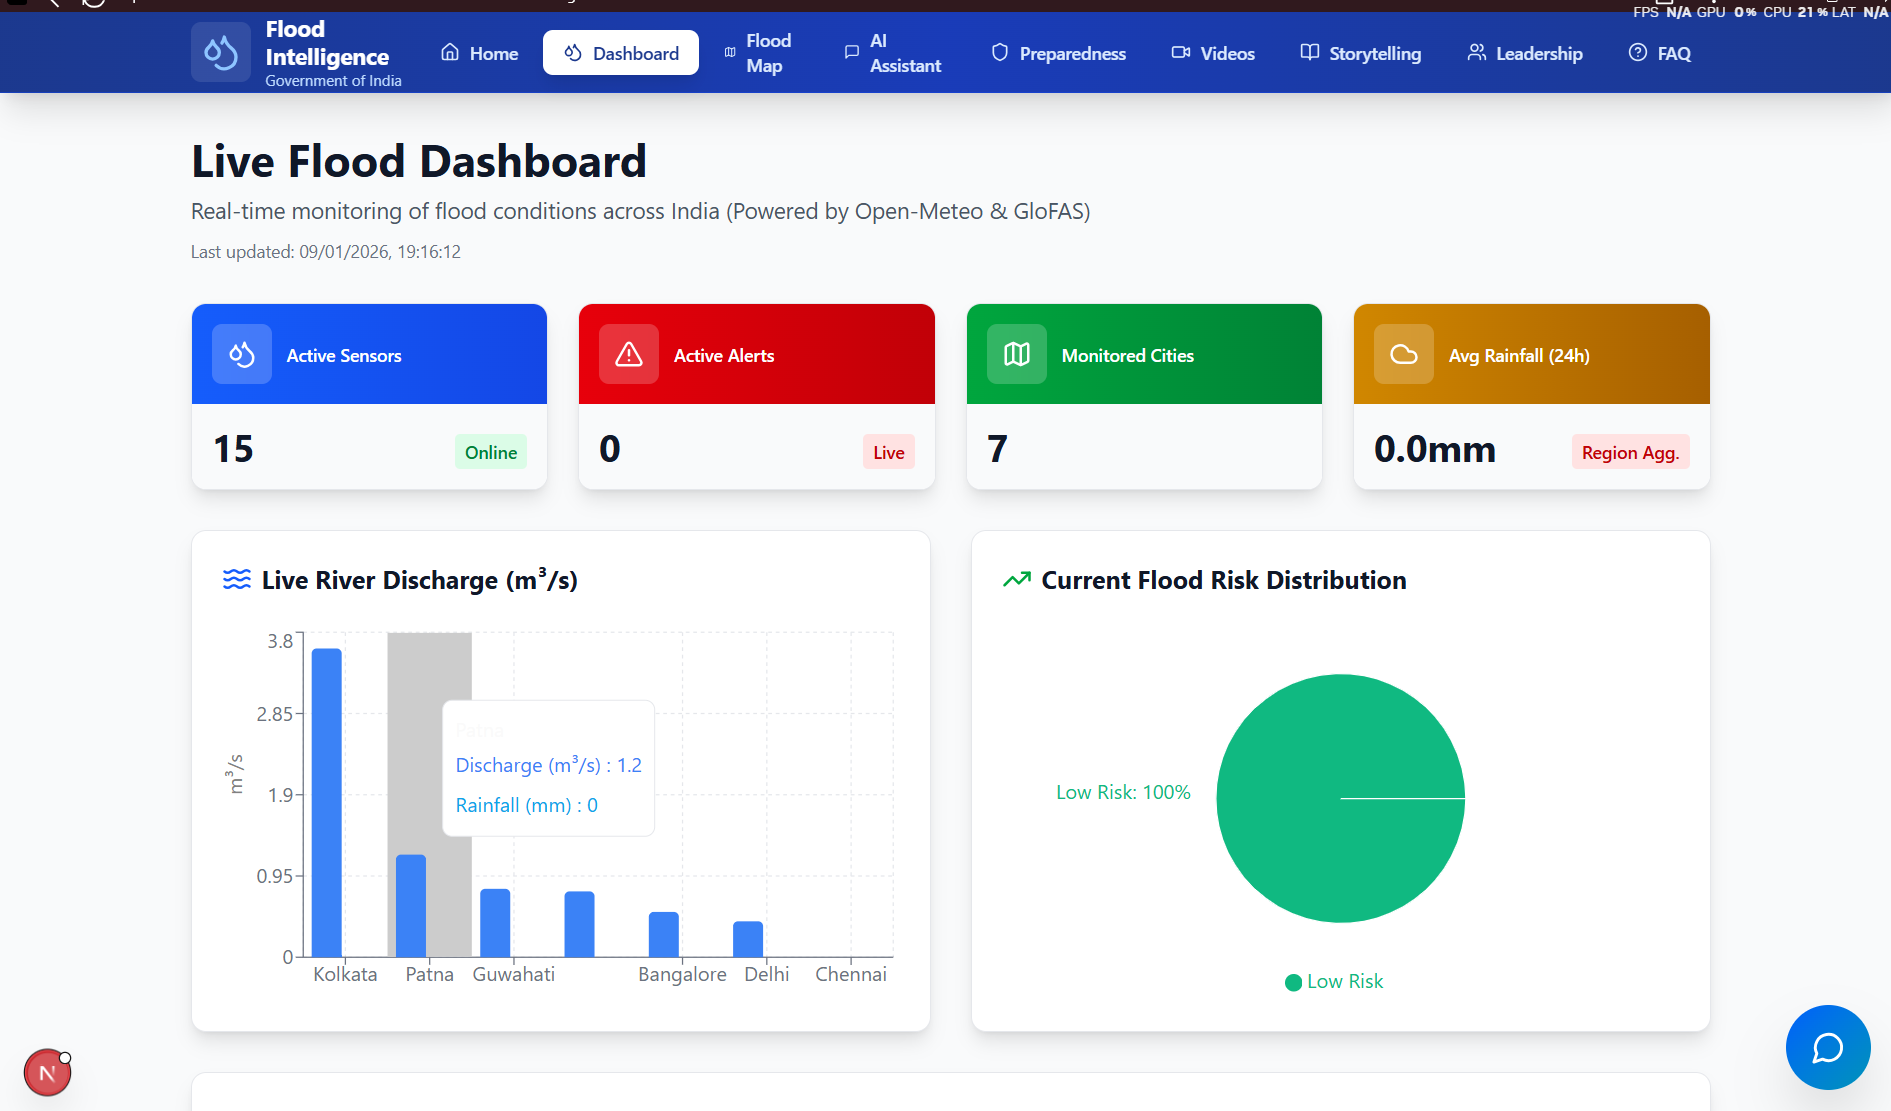
Live flood status, alerts, and risk insights across monitored regions
-
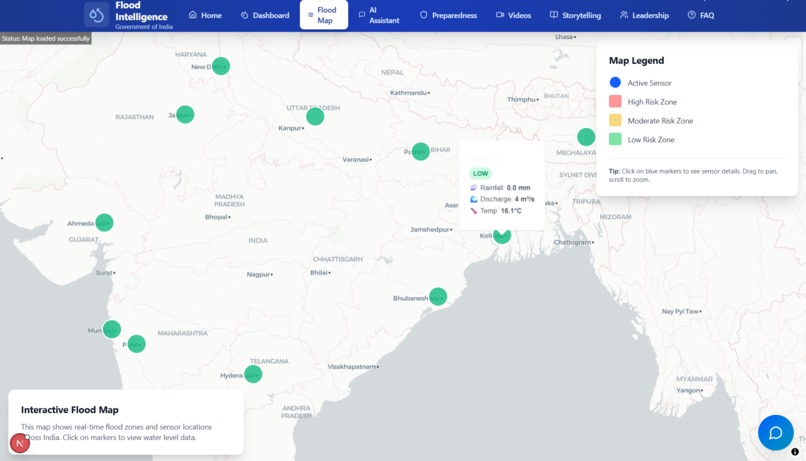
Interactive map showing real-time flood risk zones and sensor data
-
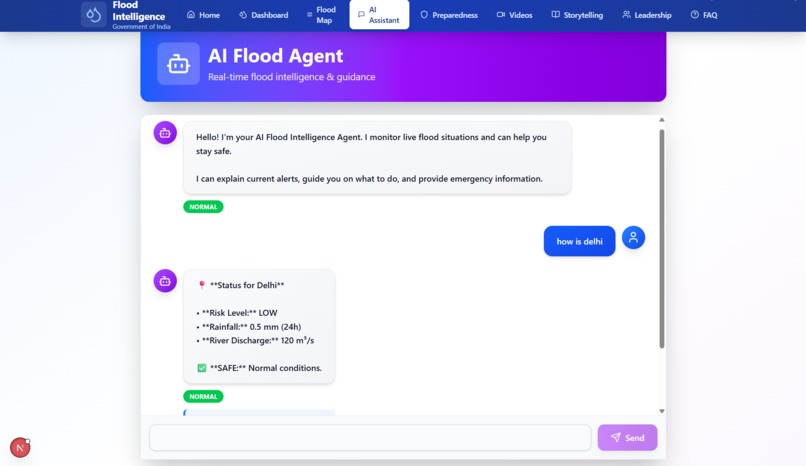
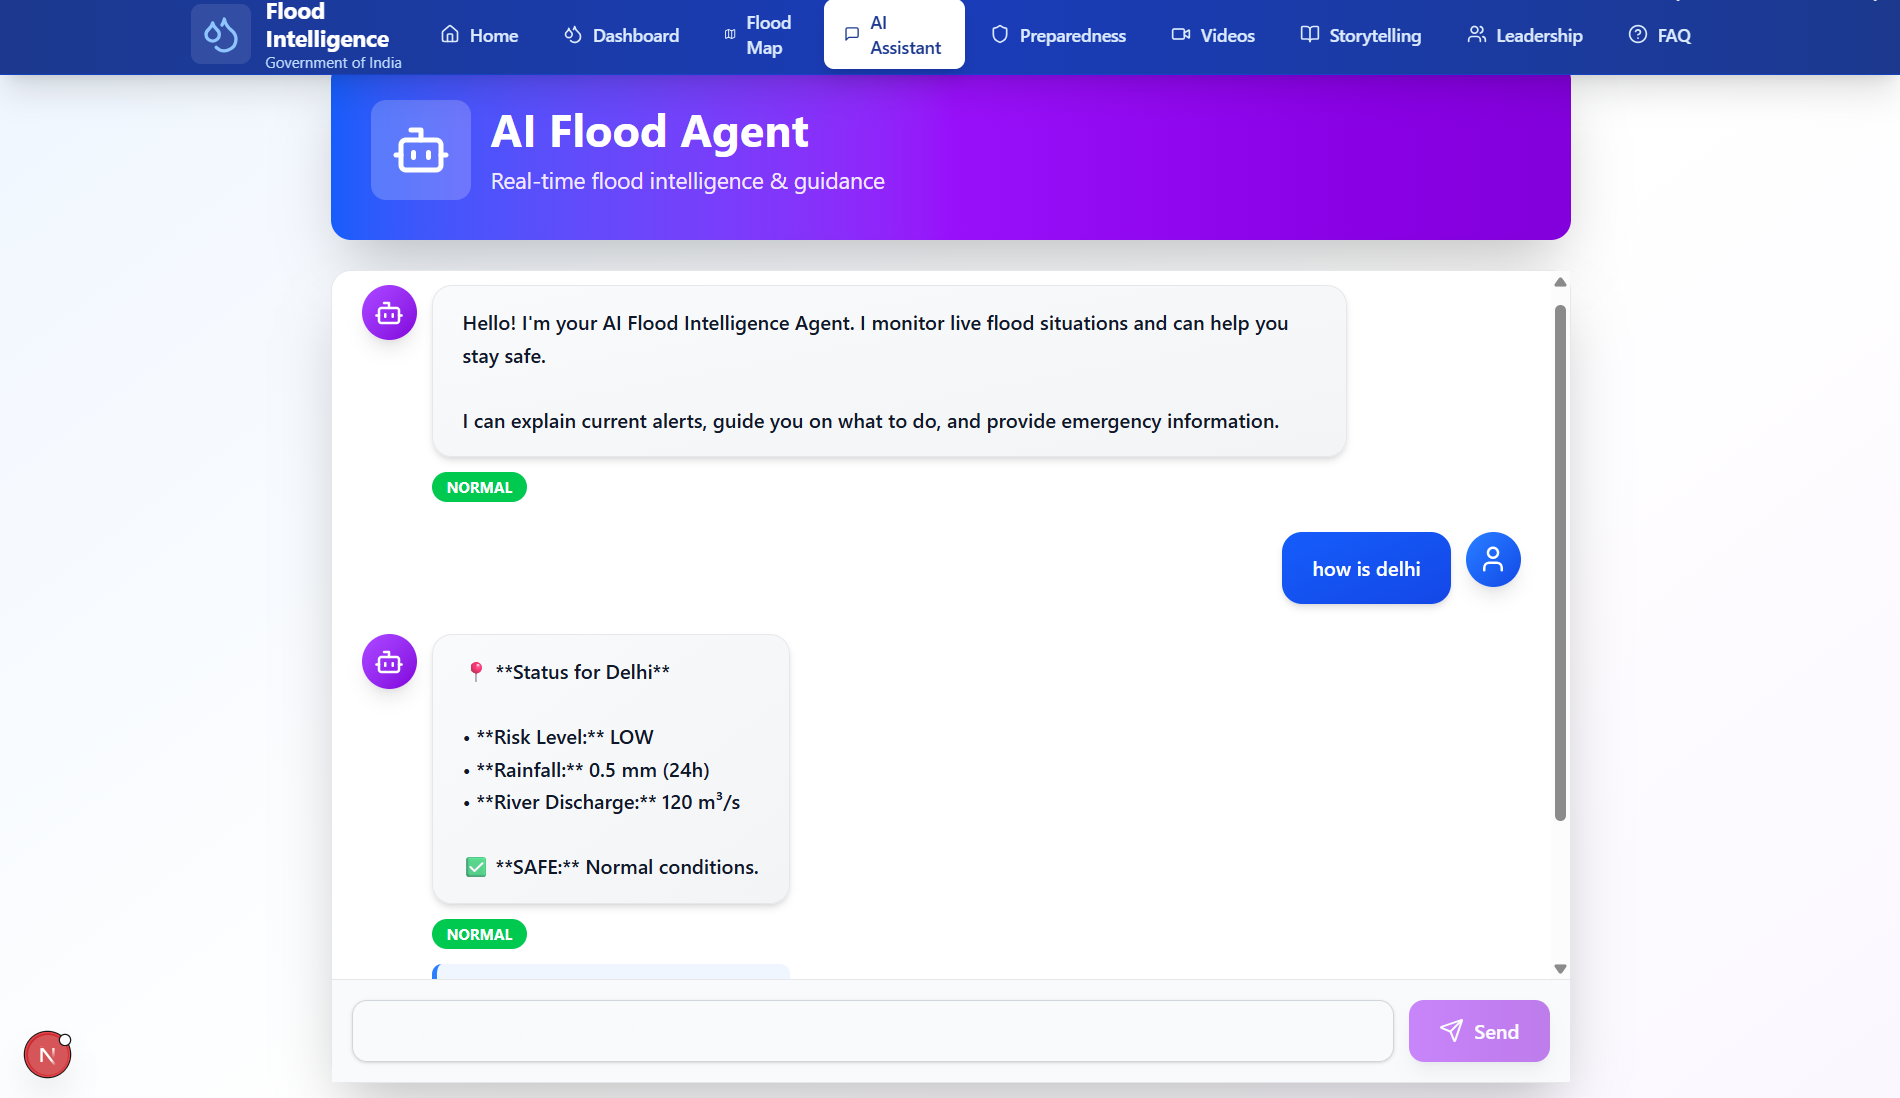
Your 24/7 AI guide for flood updates, safety advice, and emergency help
-

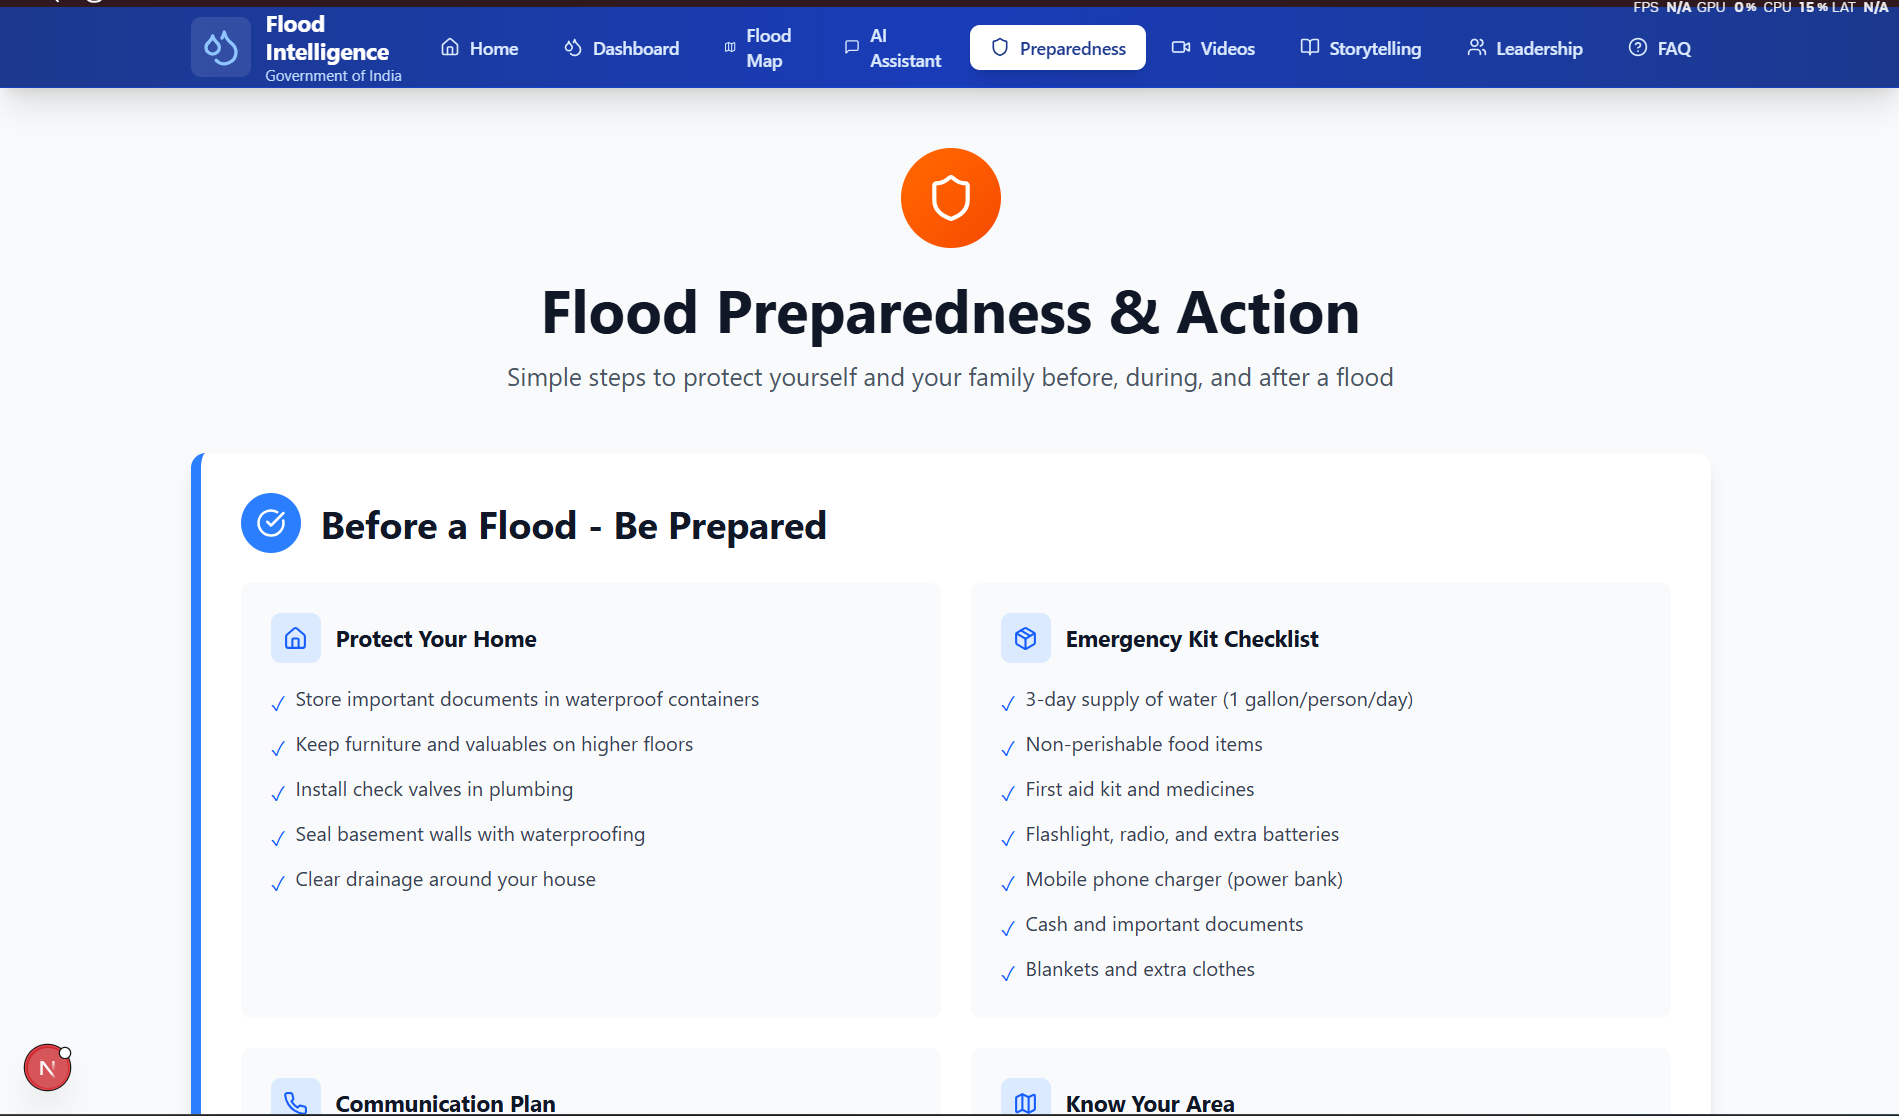
Step-by-step actions to stay safe before floods.
-
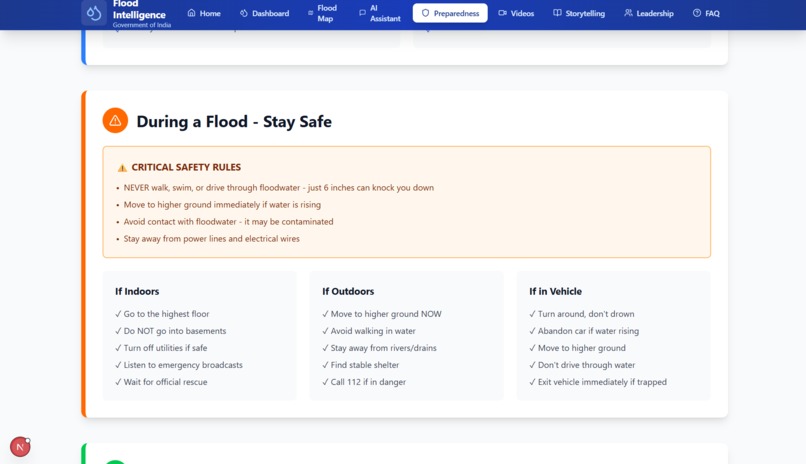
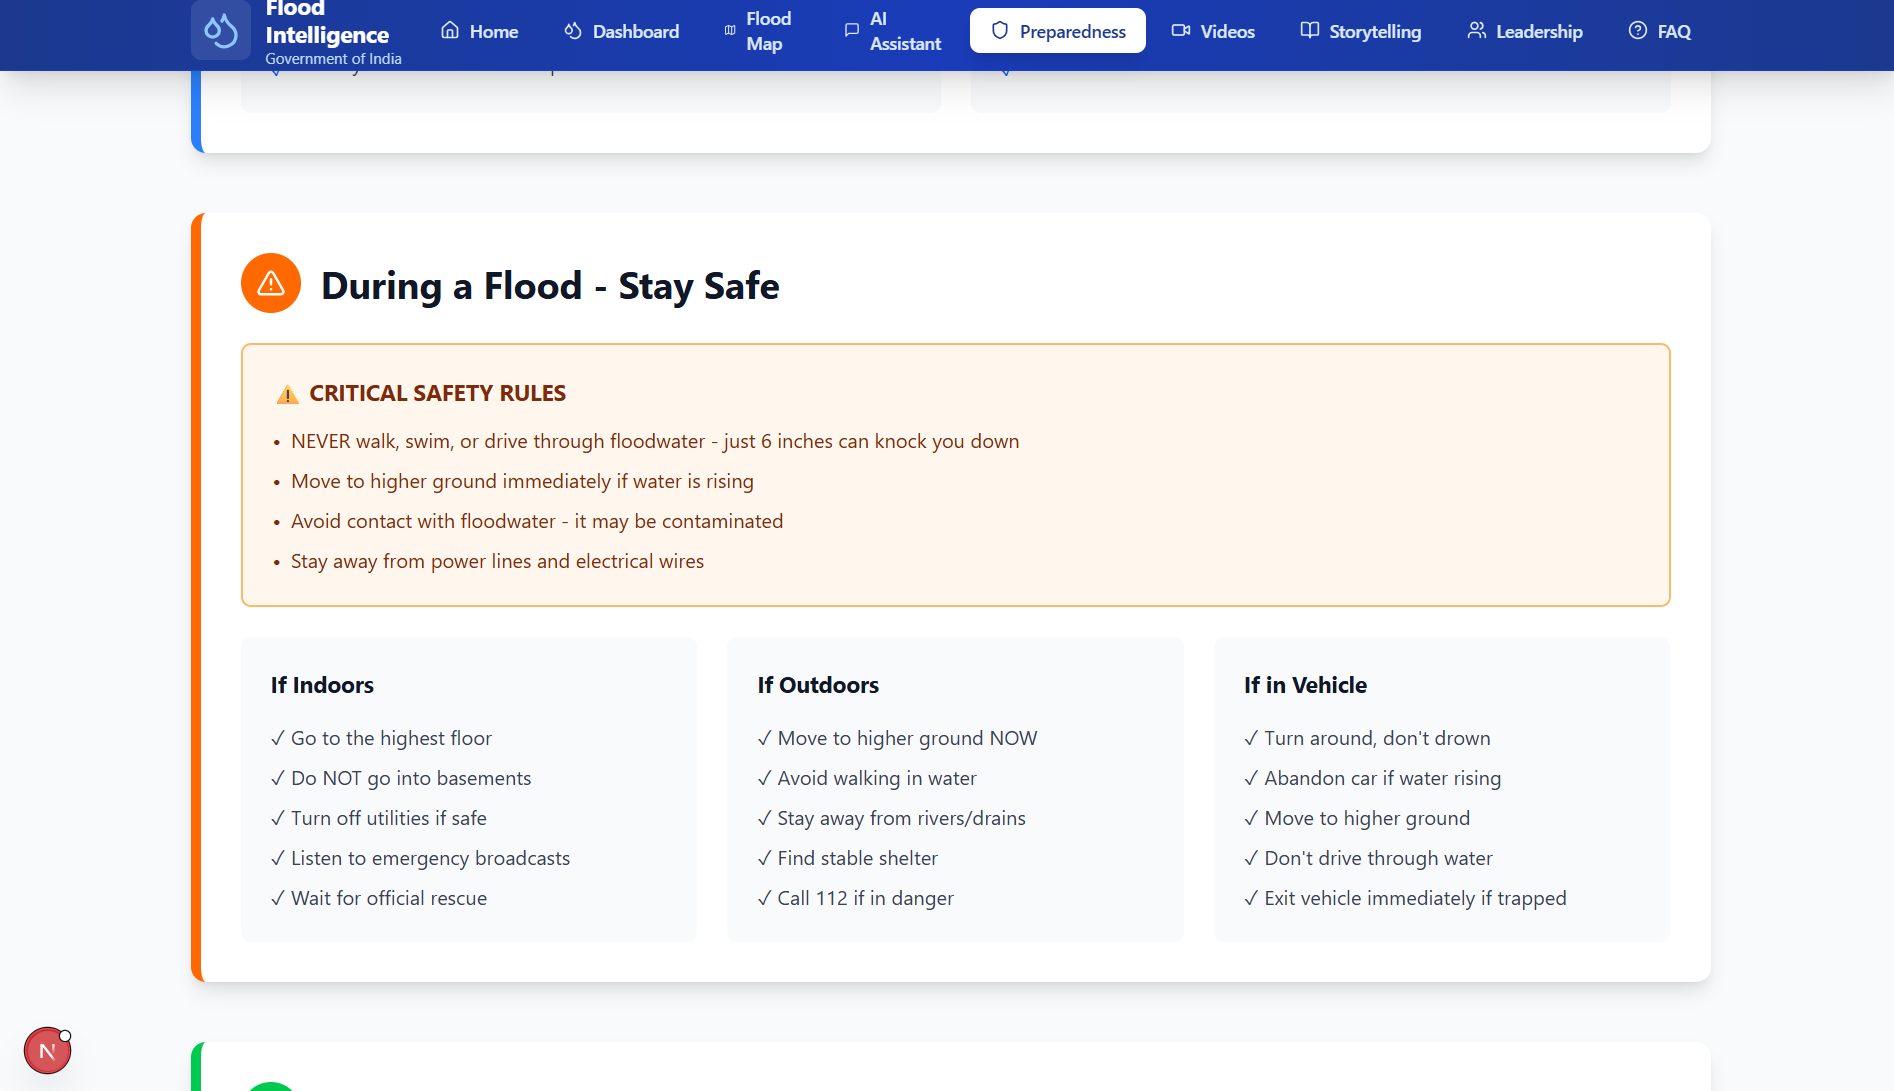
Step-by-step actions to stay safe during floods.
-

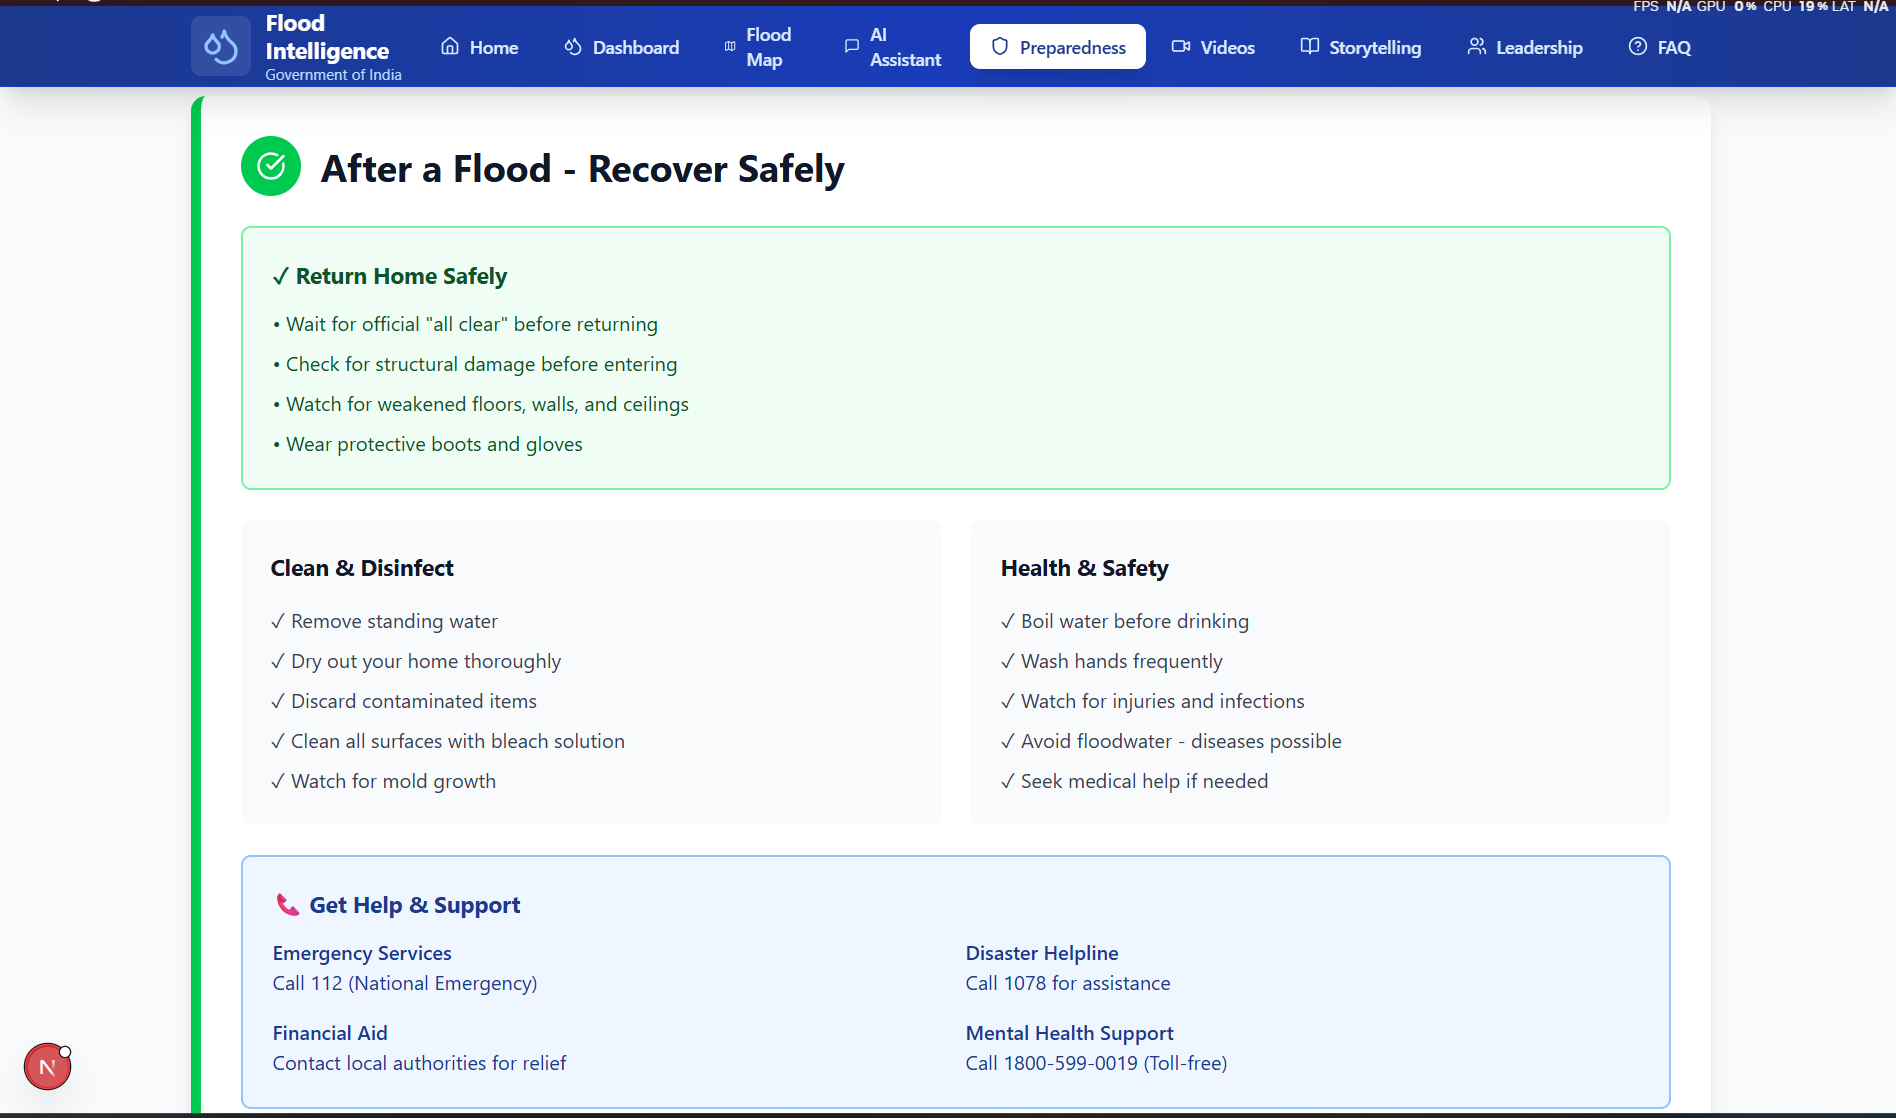
Step-by-step actions to stay safe after floods.
-
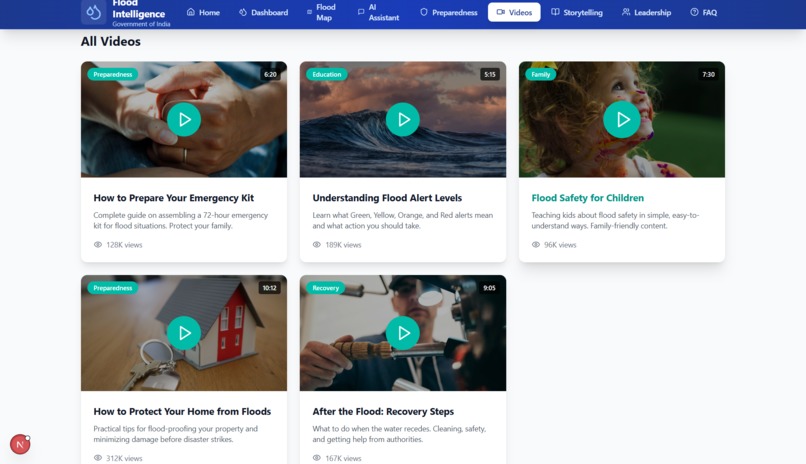
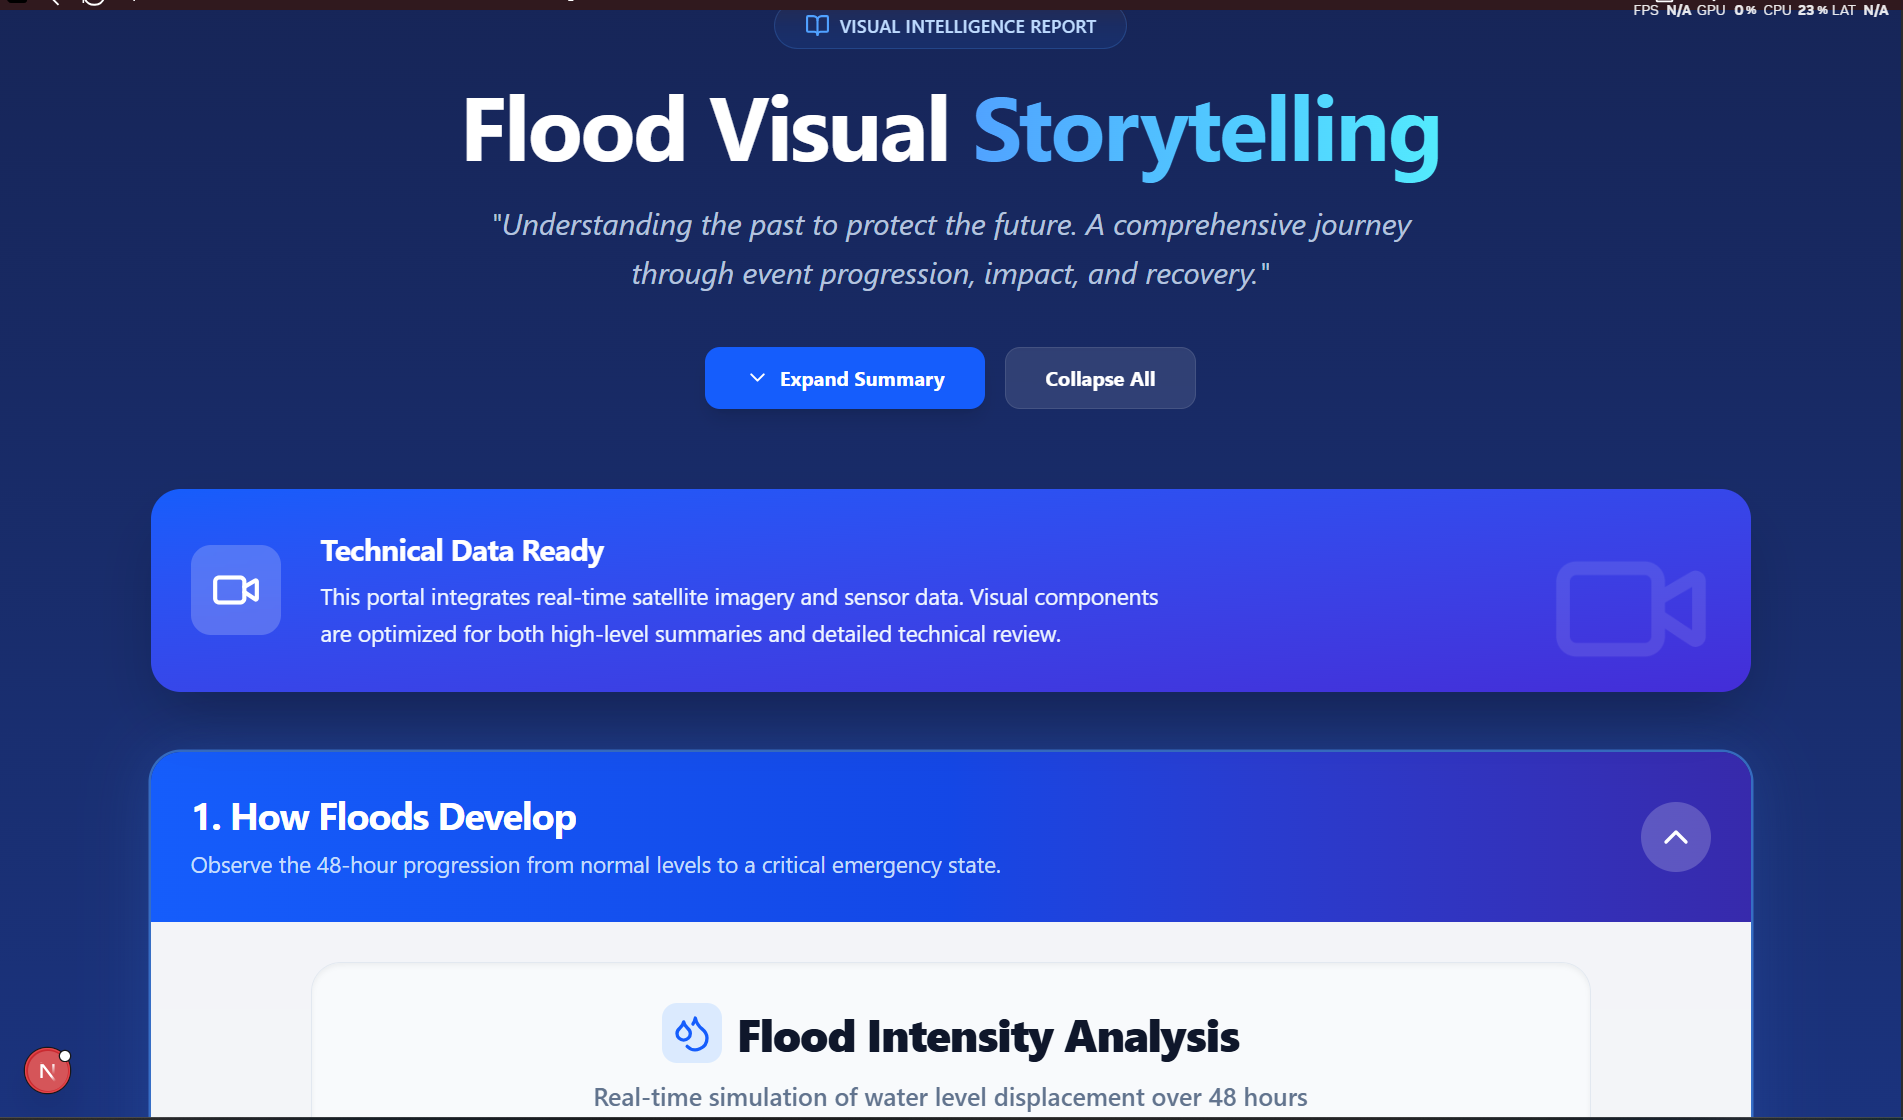
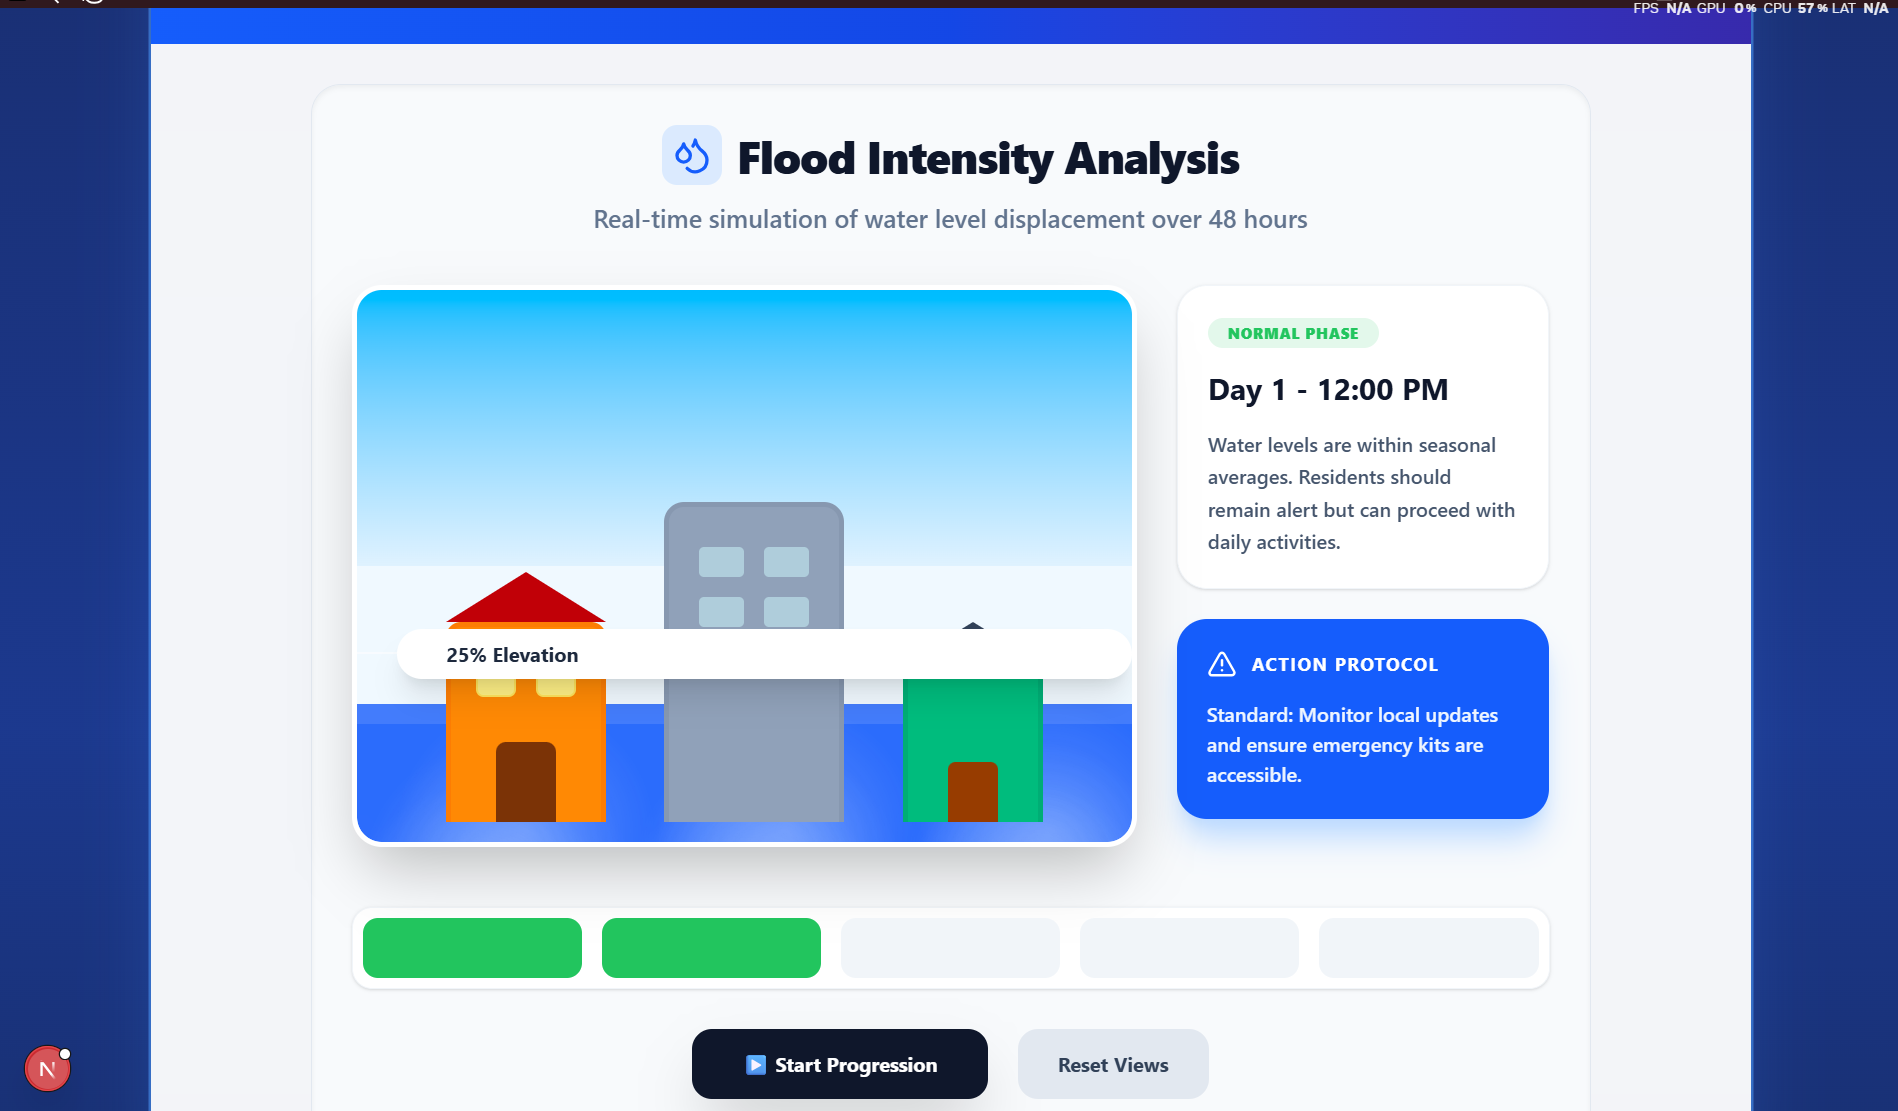
Learn flood safety through visual guides and awareness videos.
-
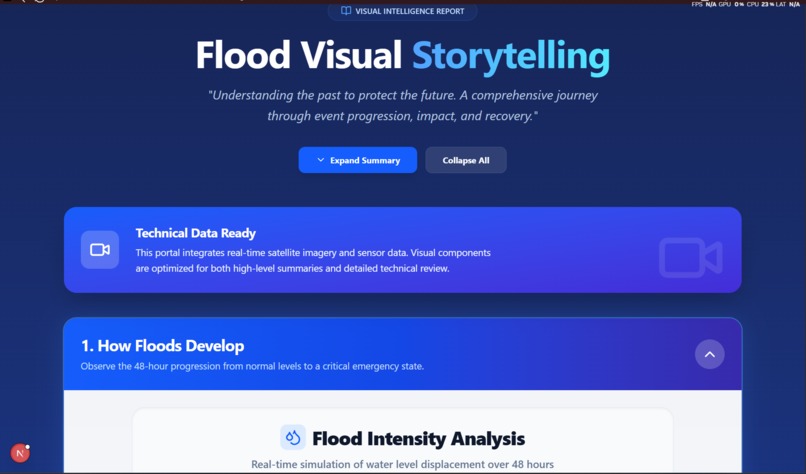
Real flood stories, impact insights, and lessons from the ground
-

Real flood stories, impact insights, and lessons from the ground
-

Real flood stories, impact insights, and lessons from the ground
-
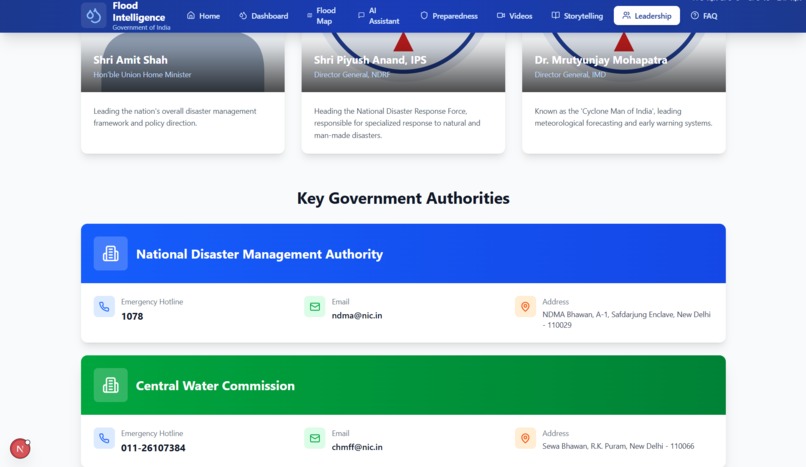
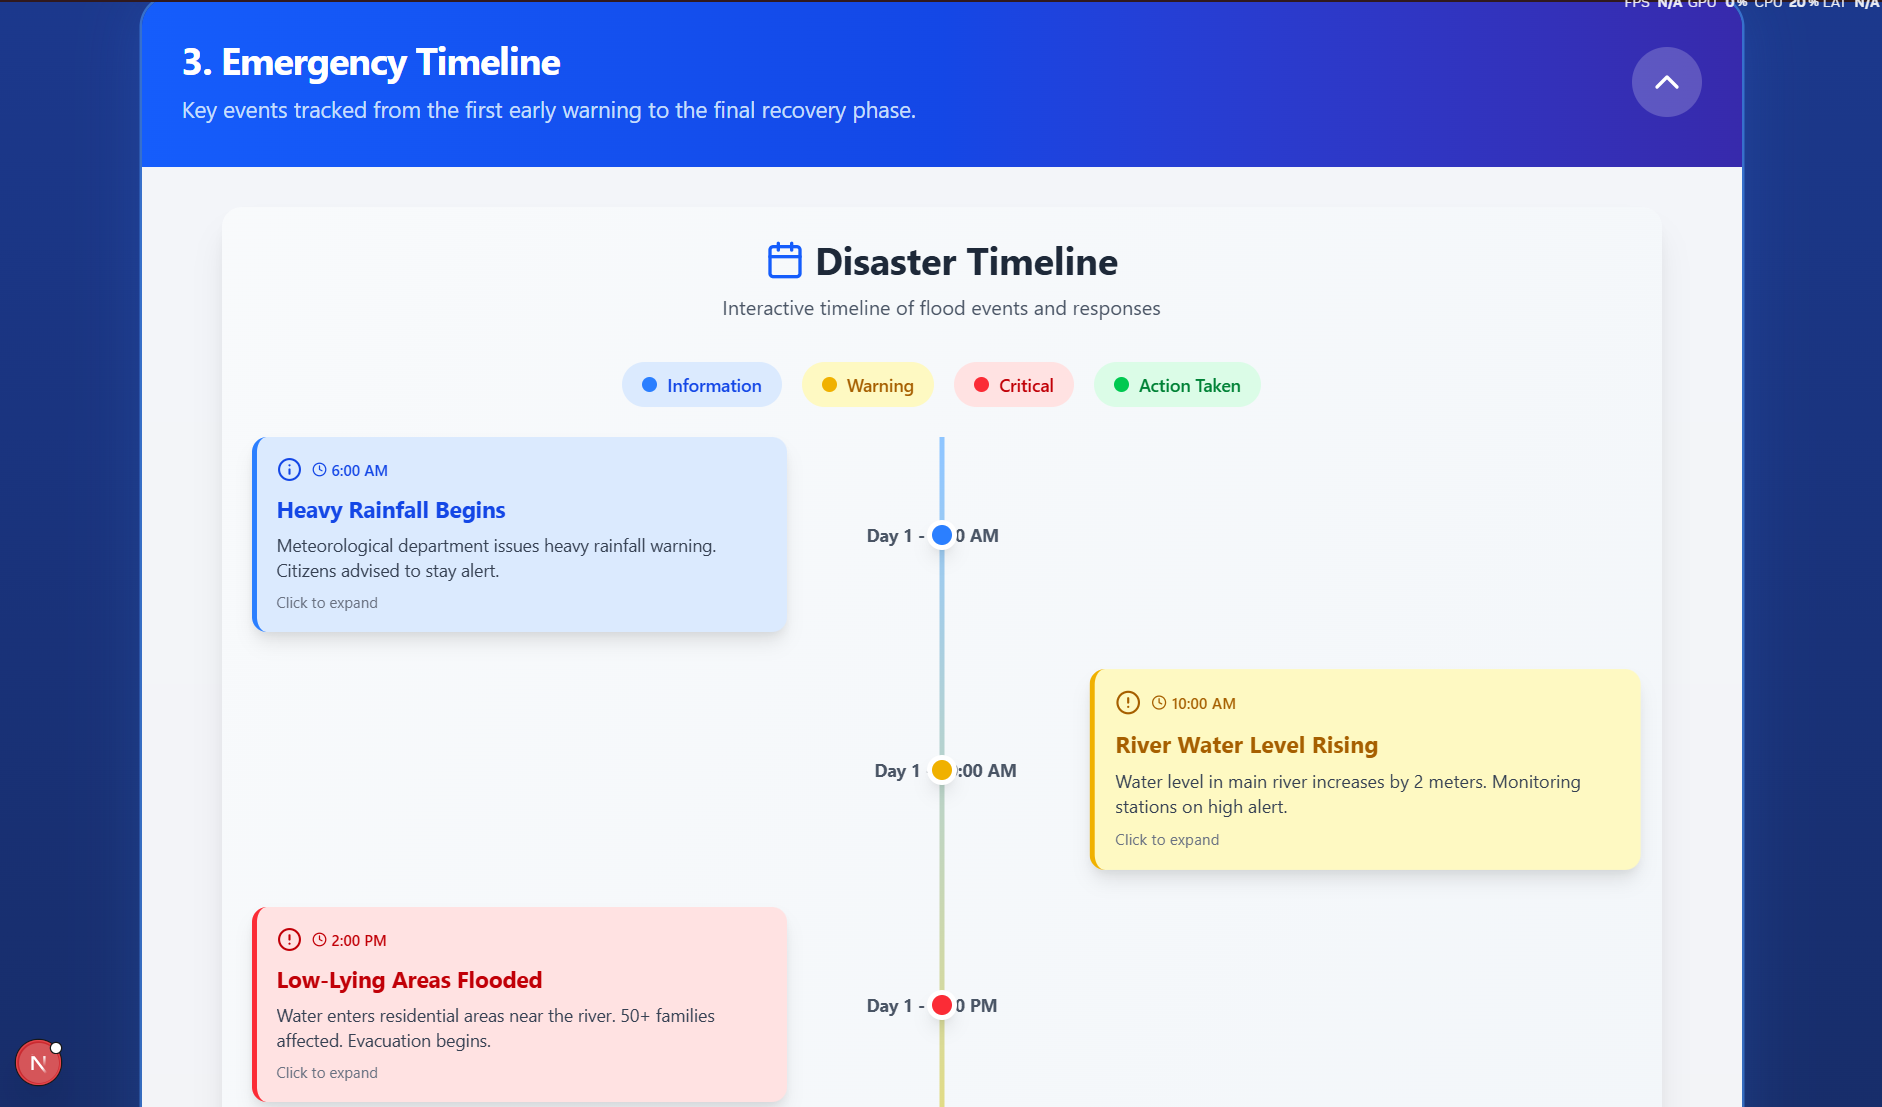
Strategic flood management initiatives and decision-making insights.
-
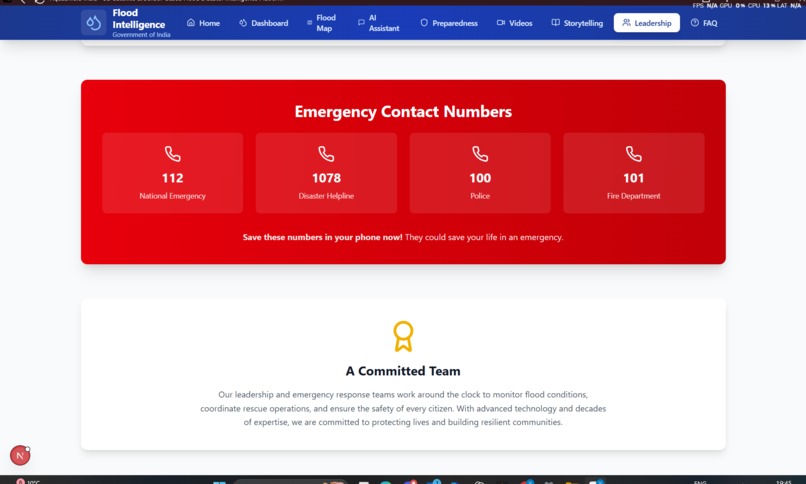
Strategic flood management initiatives and decision-making insights.
-
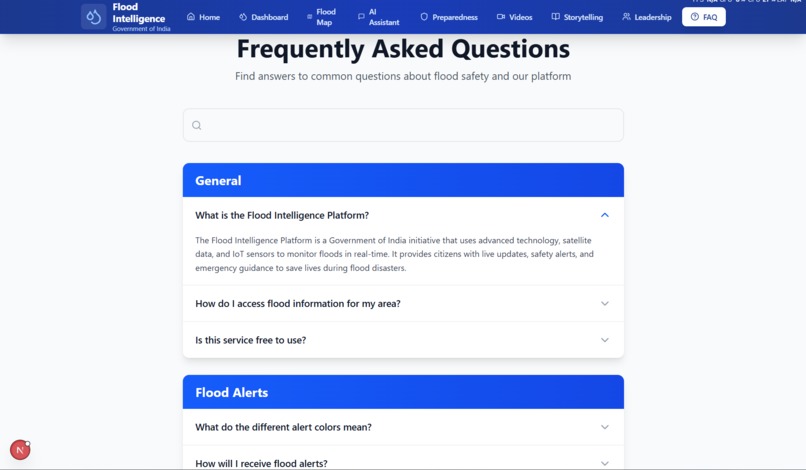
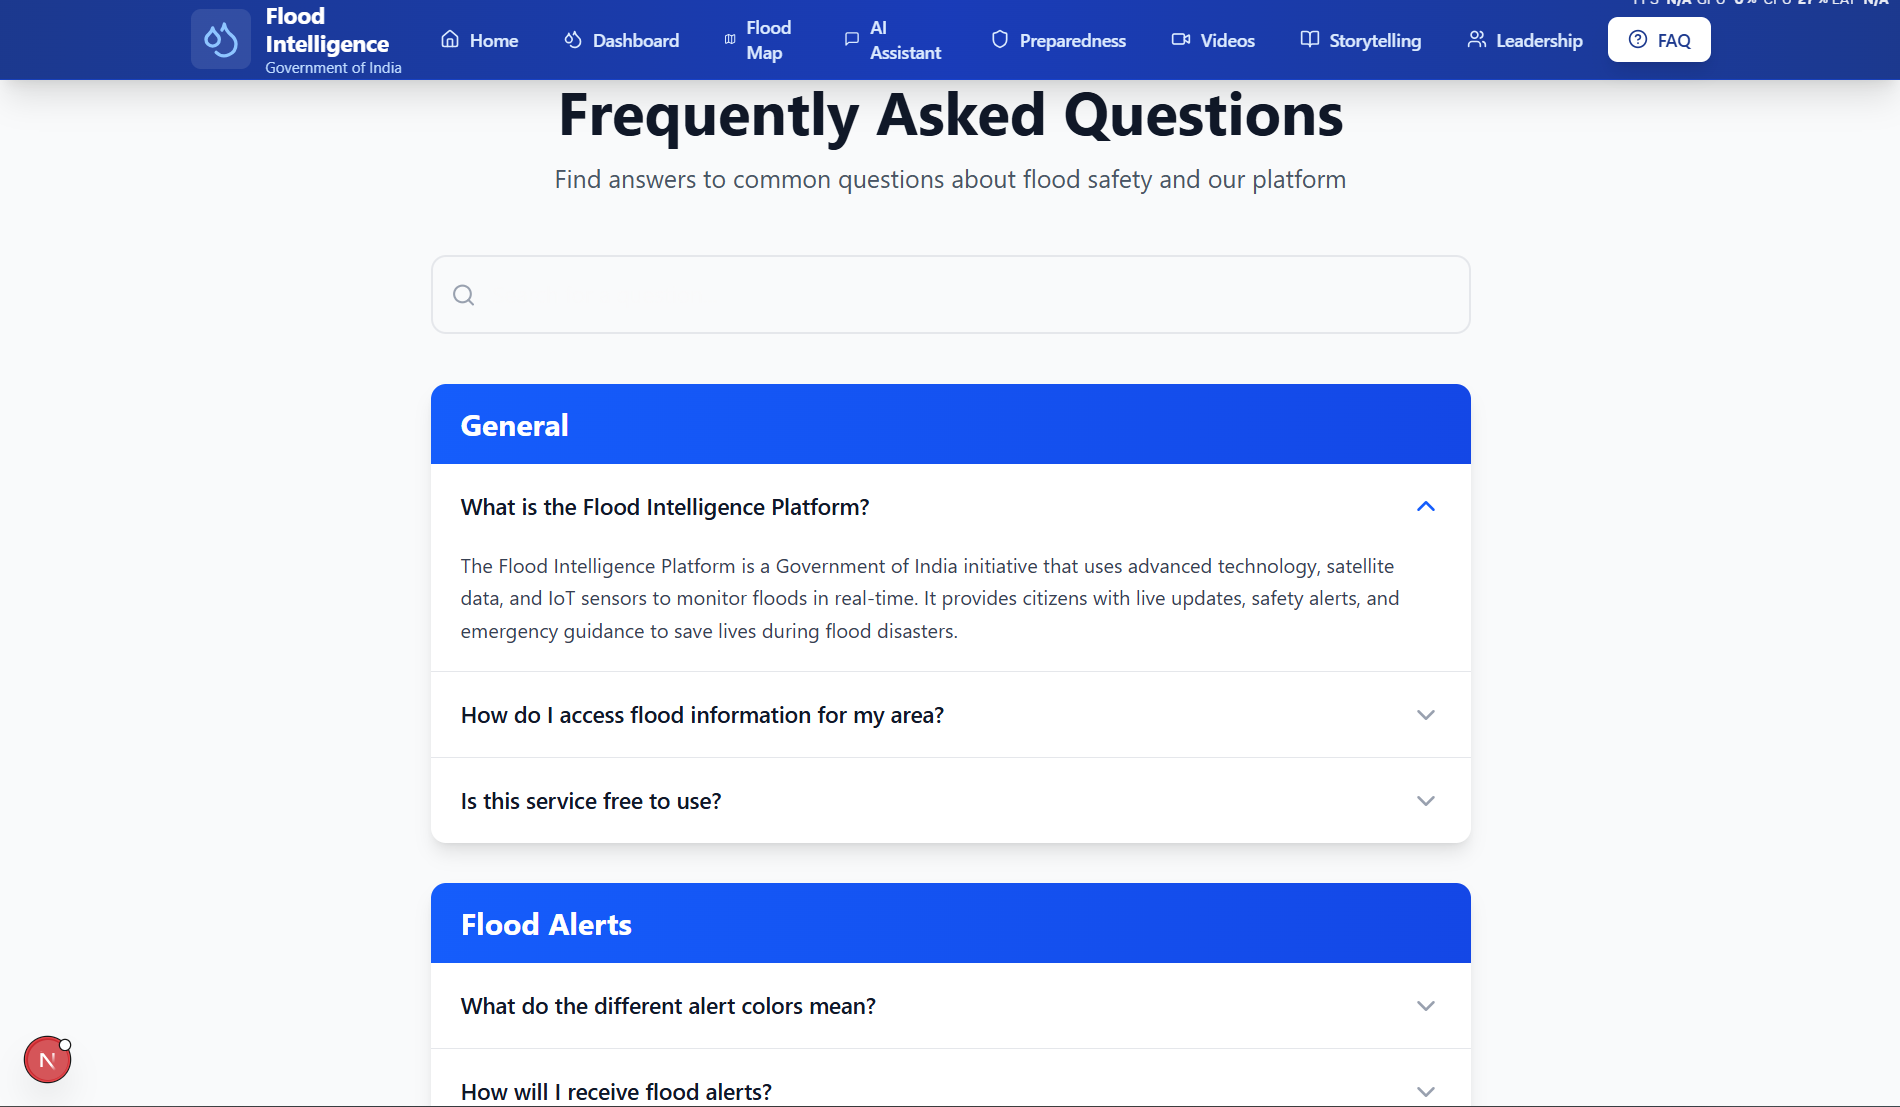
Quick answers to common questions about floods and safety


Inspiration
Floods remain one of the most devastating natural disasters in India and across the world. Despite the availability of data from weather agencies, disaster reports, and satellites, this information is often scattered, delayed, or difficult for citizens and authorities to interpret in real time.
We were inspired to build Flood Intelligence Platform to bridge this gap — a single, interactive system that transforms raw environmental and disaster data into actionable intelligence for early awareness, preparedness, and decision-making.
Our goal was to move beyond static reports and create a living, real-time digital view of flood risk that anyone can understand.
What it does
Flood Intelligence Platform is a real-time flood monitoring and intelligence system that:
- Displays an interactive flood map with live sensor markers and risk zones
- Visualizes weather, rainfall, and disaster-related signals in one place
- Provides AI-assisted insights to help users understand flood conditions
- Connects disaster data, geospatial mapping, and analytics into a single dashboard
- Enables authorities, researchers, and citizens to explore flood-prone regions intuitively
Instead of reading complex data tables, users can see what is happening on the ground through maps, dashboards, and AI explanations.
How we built it
We built the platform using a modern full-stack architecture:
- Frontend: Next.js (React) with MapLibre and OpenStreetMap-based tiles
- Mapping: Interactive geospatial layers, markers, and legends for flood risk
- Backend: API-based data aggregation layer (weather, disaster, geospatial data)
- Data Sources: Weather forecasts, rainfall indicators, and disaster datasets
- AI Layer: AI assistant to interpret data patterns and explain flood risks in simple language
The system is designed so real-world APIs can be plugged directly into the backend, allowing the frontend to update dynamically without hardcoded or static data.
Challenges we ran into
- Integrating multiple external APIs with different formats and rate limits
- Handling CORS and API accessibility issues in a browser-based environment
- Ensuring map performance while rendering multiple live data layers
- Balancing technical accuracy with simple, understandable UI/UX
- Converting theoretical disaster data into something visually meaningful
These challenges pushed us to design a flexible and scalable architecture rather than a demo-only solution.
Accomplishments that we're proud of
- Successfully built an end-to-end flood intelligence dashboard
- Created a clean, intuitive UI that makes complex data accessible
- Integrated interactive maps with real-time visualization capabilities
- Designed the platform to be API-driven and future-ready
- Combined geospatial intelligence with AI-driven explanations
What we learned
- Real-world disaster intelligence requires more than just data — it needs context and visualization
- Mapping and geospatial systems are powerful tools for public awareness
- AI can significantly improve how non-technical users understand environmental risks
- Designing for real-world deployment requires thinking beyond static demos
What's next for Flood Intelligence Platform
- Full integration of live rainfall, river-level, and satellite APIs
- Predictive flood modeling using machine learning
- Region-wise early warning notifications and alerts
- Government and emergency response dashboards
- Mobile-first access for disaster-prone communities
Our long-term vision is to evolve this platform into a national-scale flood intelligence and decision-support system.
Built With
- ai
- apis
- assistant
- geoapify
- gl
- html5
- javascript
- llm-based)
- map
- maplibre
- next.js
- openstreetmap
- react)
- rest
- tiles

Log in or sign up for Devpost to join the conversation.