Inspiration
On 26 August 2026 a glacier collapse sent a flood of water, mud and rock down the Bhote Koshi–Trishuli corridor in Nepal. Roads, bridges and phone lines failed, and rescuers urgently needed to know where the damage was worst and which villages were cut off. Free satellite data covers every Himalayan valley. We wanted to turn it into trustworthy answers, fast.
What it does
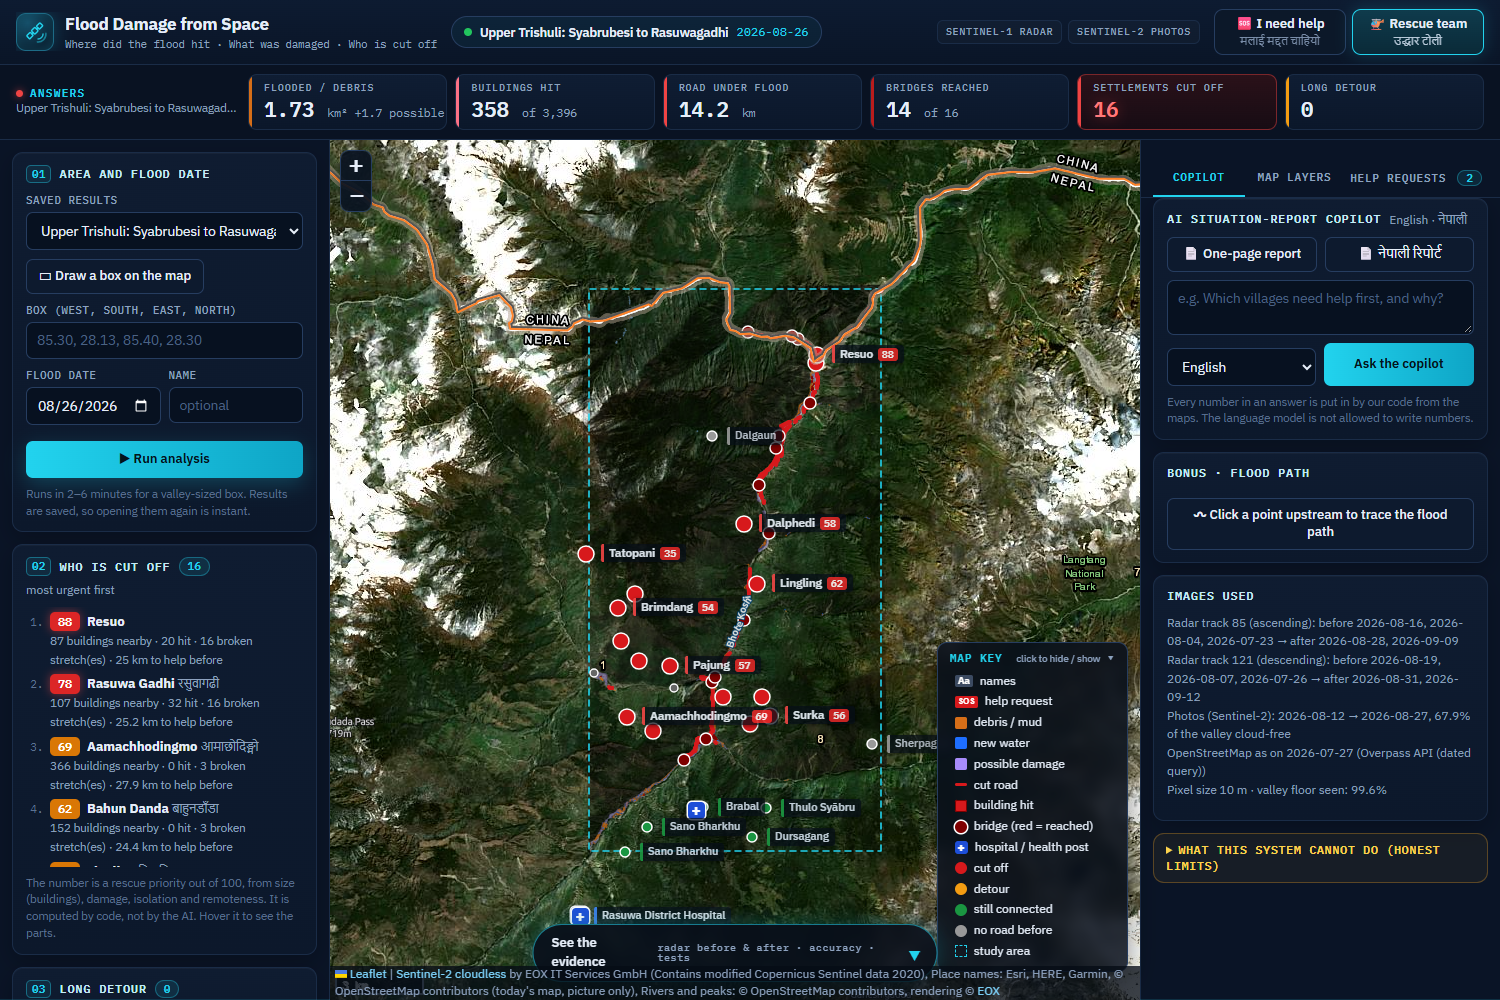
You draw an area, pick the flood date, and click Run. In about 2–6 minutes the system answers three questions:
- Where did the flood hit?
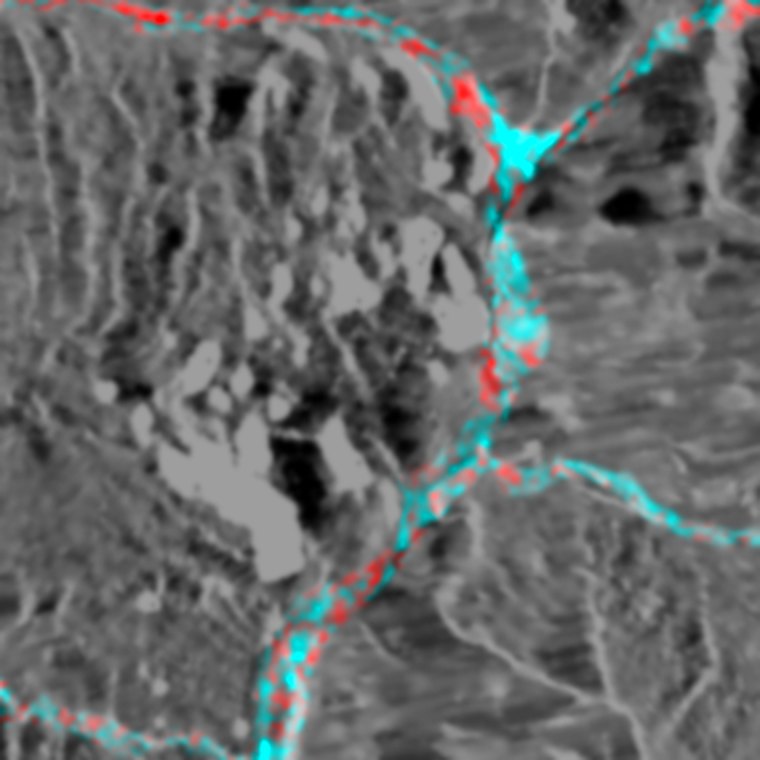
- Flooded and debris-covered ground from Sentinel-1 radar, which sees through monsoon clouds.
- Checked with Sentinel-2 photos when the sky is clear.
- Shown with High / Medium / Low confidence.
- What was damaged? Buildings, roads and bridges from OpenStreetMap as it was before the flood.
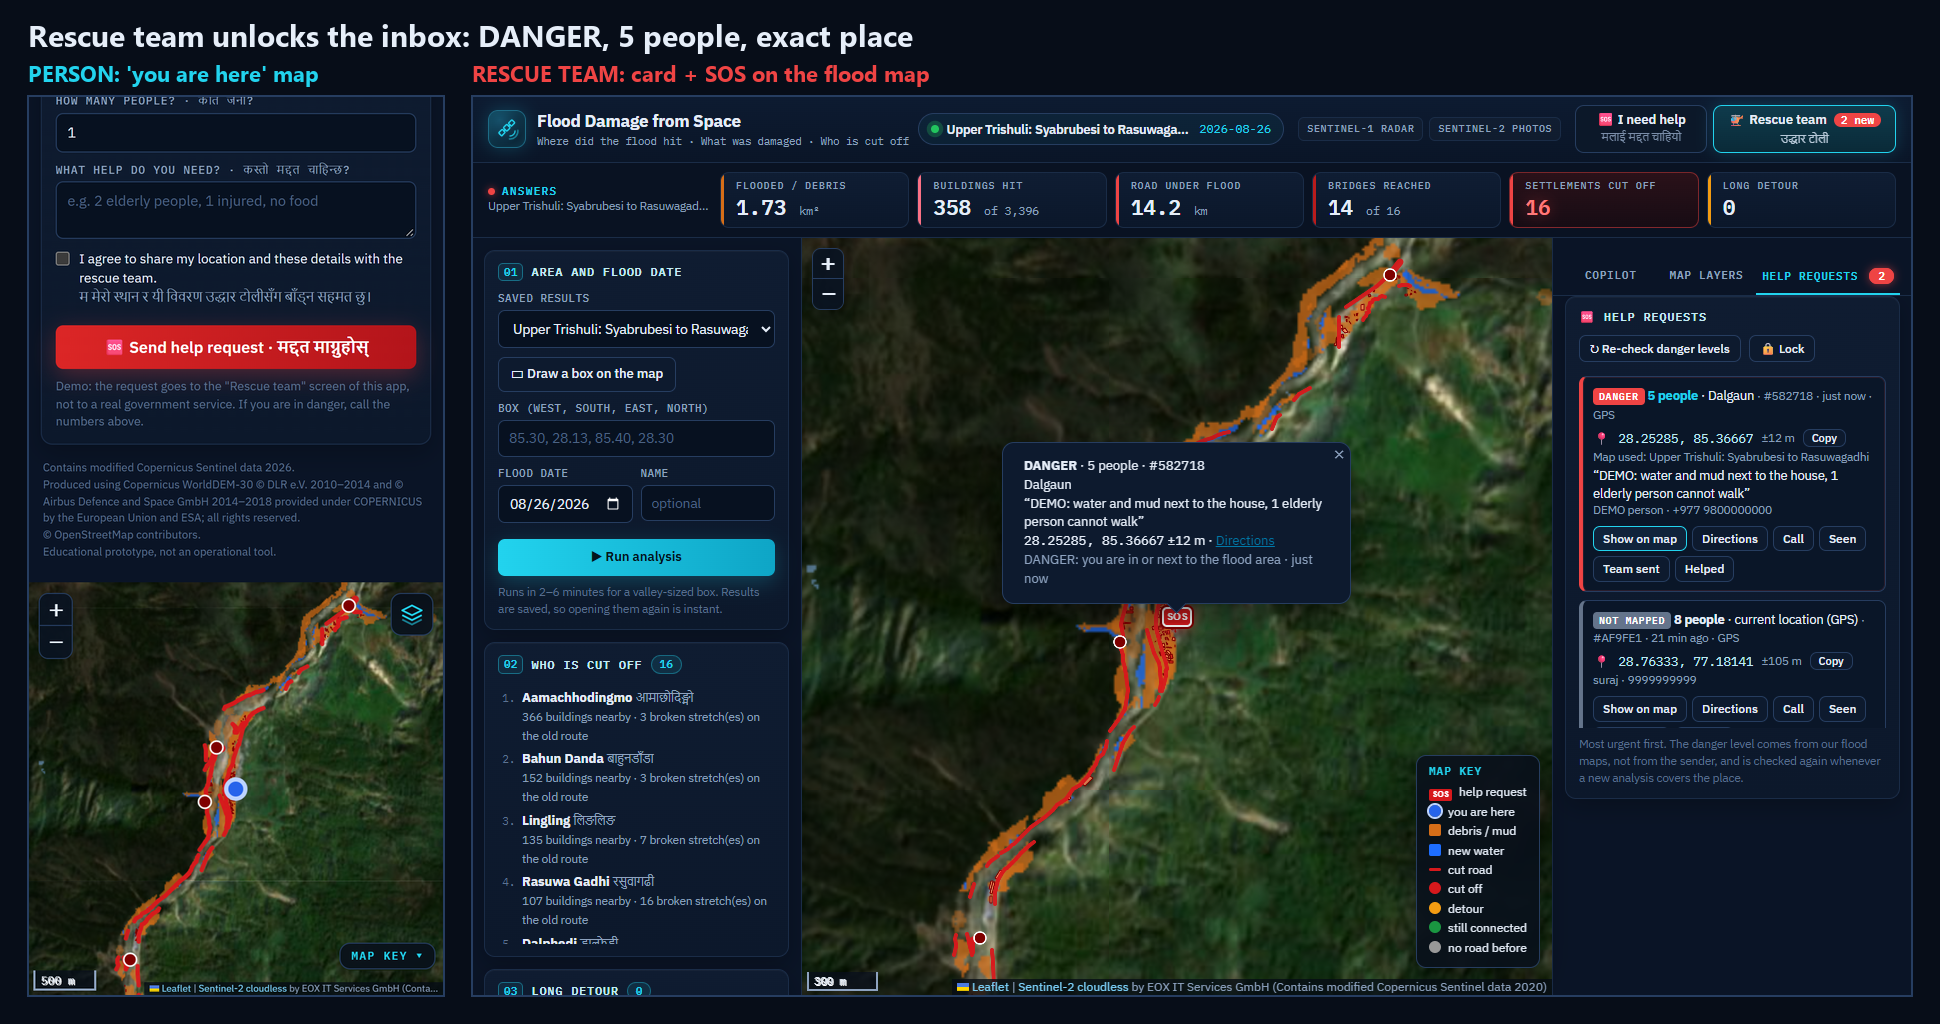
- Who is cut off? Villages that lost every road connection to a town or hospital, plus which bridge or road broke, ranked by a rescue priority score (0-100) computed by code (size, damage, isolation, remoteness), most urgent first.
The AI copilot answers rescuers' questions and writes one-page situation reports in English and Nepali. The language model never writes a number; our code inserts every number from the maps.
Bonus: click any upstream point to trace the flood path downhill and list the settlements along it.
The evidence, on the page: scroll below the map to compare the radar images before and after (drag the line), see the check against the official EMS map, the no-flood test, the same system on six other floods, and the AI's own words with blanks before our code fills in the numbers.
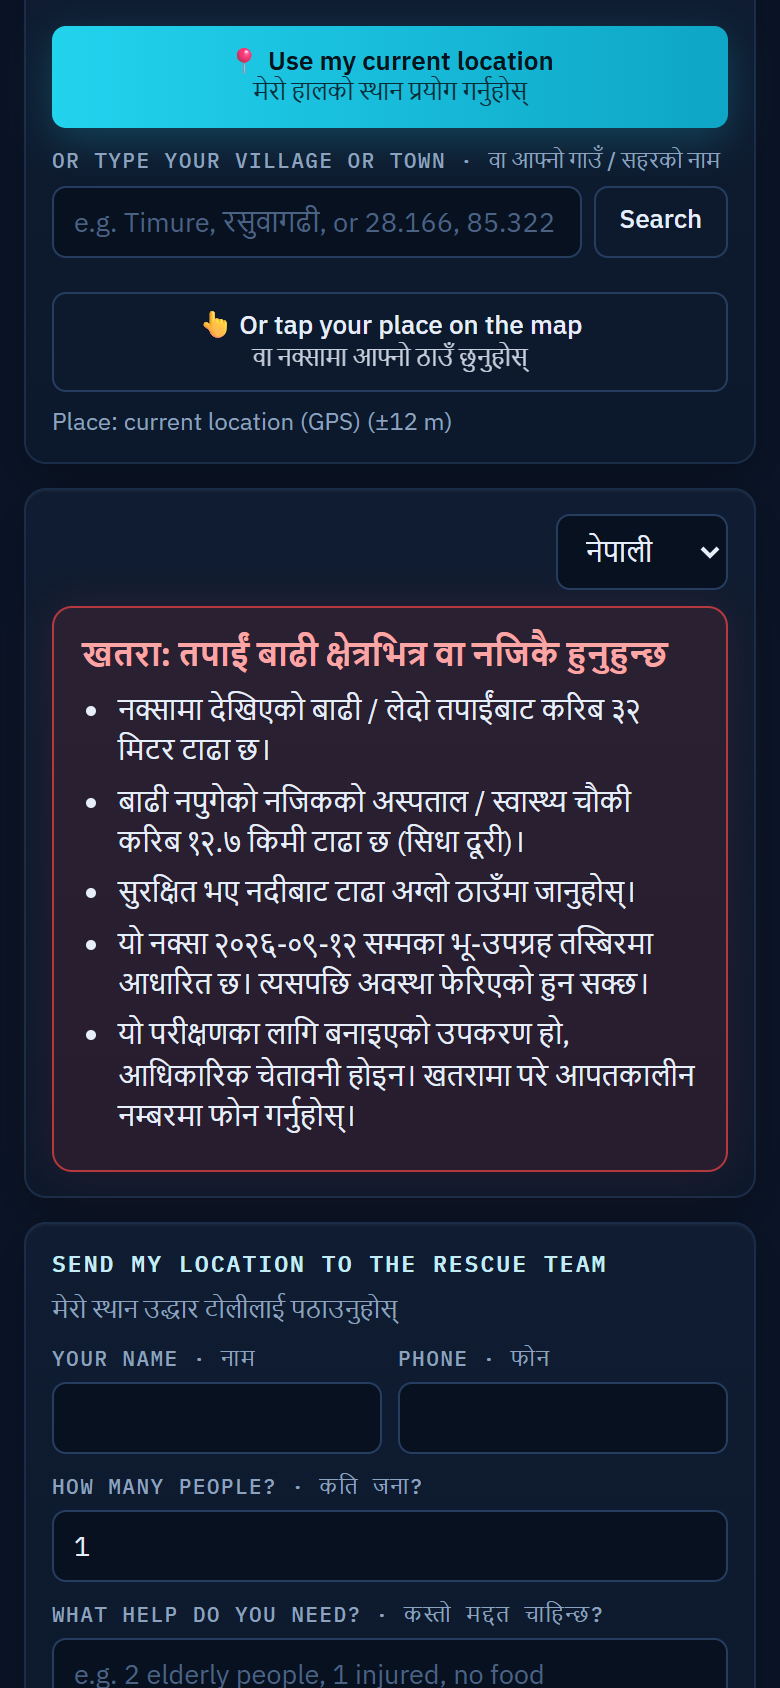
Extra: the "I need help" side. People inside a mapped flood area can check their danger level, see emergency numbers, and send their GPS location to a PIN-protected rescue inbox. Requests from outside the flood area (or far from the chosen place) are refused, which stops casual fake requests.
How we built it
- Data (only the allowed inputs):
- Sentinel-1 GRD (terrain-corrected gamma0) and Sentinel-2 L2A via the Copernicus Data Space Sentinel Hub API;
- Copernicus DEM GLO-30;
- OpenStreetMap snapshots from before the flood via the ohsome API.
- Flood mapping:
- Speckle-filtered, multi-image radar change detection on the same track, in both directions.
- Only the valley floor is checked (HAND from the DEM), and radar blind spots (layover/shadow) are skipped.
- Optical confirmation: NDVI loss, bare ground and MNDWI water.
- Damage and cut-off:
- Flood map × OSM buildings, roads and bridges.
- The road network becomes a graph; shortest routes to towns, hospitals and exits are compared before and after.
- AI component: Groq
gpt-oss-120bwrites text with placeholders; a checker blocks digits and number words; code fills in the values; a template is the fallback. - App: Python (rasterio, geopandas, pysheds, scipy, scikit-image), FastAPI, Leaflet.
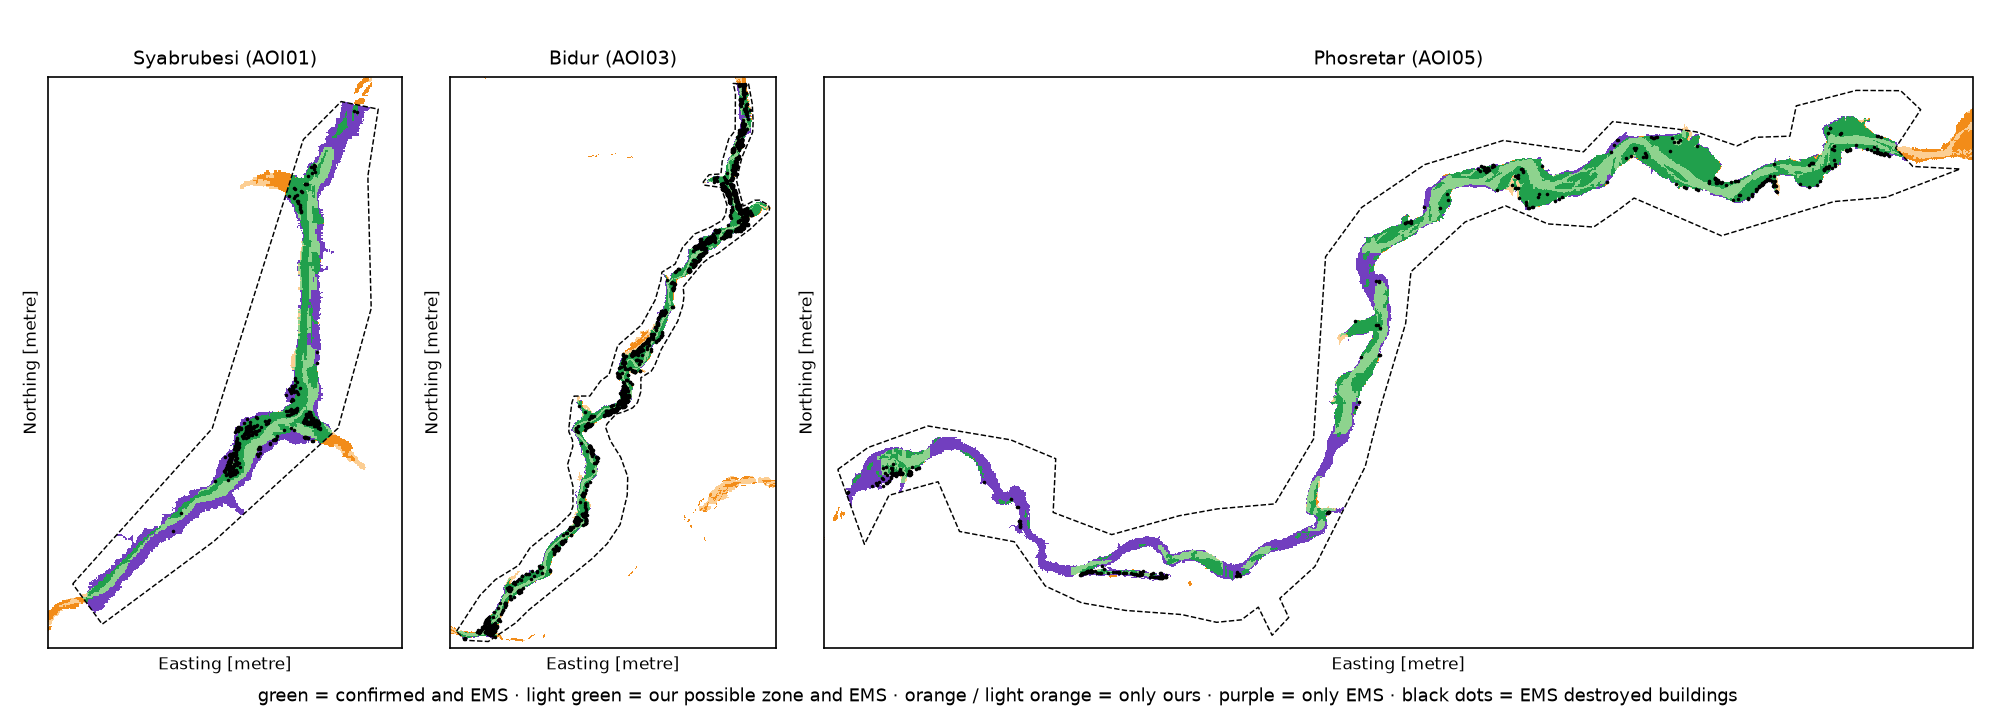
Case study vs Copernicus EMS (EMSR927)
- Precision 0.96: almost no false alarms.
- Destroyed buildings found: 98.5% in Bidur, 82–88% upstream.
- Bridges: nearly all destroyed bridges found.
- Confirmed map alone: recall 0.52. It under-maps the outer debris edges, where radar and photos show little change.
- With the "possible damage" zone: recall 0.80, precision 0.94, F1 0.86 (was 0.68). The zone is the low valley floor next to confirmed debris (terrain-based), shown separately; its settings were picked after a check against EMSR927 and the no-flood test, and rescue numbers use the confirmed map only.
- No-flood control: the same valley on a dry-season date (15 Apr 2026) gives 0.06 km², 0 villages cut off and 0.00 km² possible damage, against 1.73 km² and 16 cut off for the real flood, so false alarms are rare.
- Any area, any date: also run unchanged on Melamchi 2021, Sikkim 2023, Chamoli 2021, Silchar 2022 and Rasuwa 2025.
Challenges we ran into
- Monsoon clouds: photos were mostly unusable right after the flood, so radar had to carry the analysis.
- Mud vs forest: debris and forest look alike on single radar images, so we averaged several images and combined both viewing directions.
- Old map vs new map: we needed OpenStreetMap as it was before the flood, because mappers had already deleted destroyed buildings.
Accomplishments we're proud of
- It works end-to-end for any area and date.
- It is provably honest with numbers.
- It writes reports in Nepali.
- It explains why each village is cut off, and which one needs help first.
What we learned
Radar remote sensing, terrain effects in mountains, road-network analysis, and how to make an AI system trustworthy. Satellite data was completely new to me when I started.
What's next
- A trained flood model as a second opinion.
- Footpaths and footbridges in the network.
- Population estimates.
- Automatic runs whenever a new Sentinel-1 image arrives.
AI disclosure (also in the README)
Almost all of the code and the first drafts of the documents were written with help from Claude Code (AI coding assistant). The author, Suraj Mishra, chose the problem and the design decisions, set up all accounts, tested the system on PC and phone, reviewed the results and edited the text.
The demo video's narration is an AI voice made with ElevenLabs (text-to-speech). The pictures are real screen recordings of the working system; the recording, the voice sync and the subtitles were made with help from Claude Code.
Required data attributions
- Contains modified Copernicus Sentinel data 2026.
- Produced using Copernicus WorldDEM-30 © DLR e.V. 2010–2014 and © Airbus Defence and Space GmbH 2014–2018 provided under COPERNICUS by the European Union and ESA; all rights reserved.
- © OpenStreetMap contributors.
- Case-study comparison: European Union, Copernicus Emergency Management Service data (EMSR927).
- Dashboard background picture: Sentinel-2 cloudless – https://s2maps.eu by EOX IT Services GmbH (Contains modified Copernicus Sentinel data 2020).
- No training dataset was used.
Links
- Live demo (24/7 during judging, 15–21 Oct): https://65-2-33-215.sslip.io (dashboard: https://65-2-33-215.sslip.io/app)
- Code: https://github.com/surajmishra-tech/flood-from-space
- Report (PDF, 5 pages): https://65-2-33-215.sslip.io/report.pdf
- Demo video: https://youtu.be/hHzfdIpEpcM
How to try it
- Live demo: https://65-2-33-215.sslip.io (runs on an AWS server 24/7 during judging, 15–21 Oct). Draw a box anywhere, pick a flood date and press Run: a new area takes about 2–6 minutes.
- The home page plays a 13-second film, then the dashboard opens with the Trishuli result. Scroll down under the map (or click "See the evidence") for the radar before/after, the check against the official EMS map and the no-flood test.
- To run it yourself: see "Quick start" in the README (the Trishuli result is included, and
python -m pytestruns 26 checks).
Built With
- claude-code
- copernicus
- elevenlabs
- fastapi
- geopandas
- gpt-oss
- groq
- leaflet.js
- networkx
- openstreetmap
- python
- rasterio
- scipy
- sentinel-1
- sentinel-2


Log in or sign up for Devpost to join the conversation.