-
-
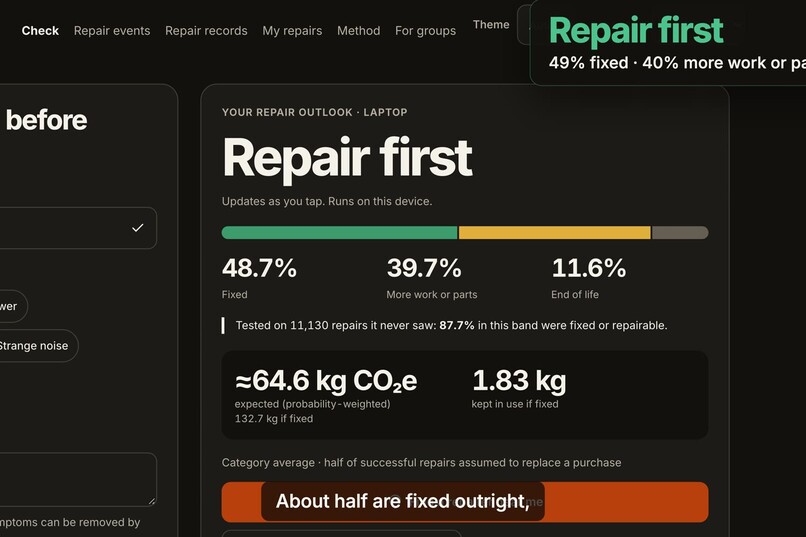
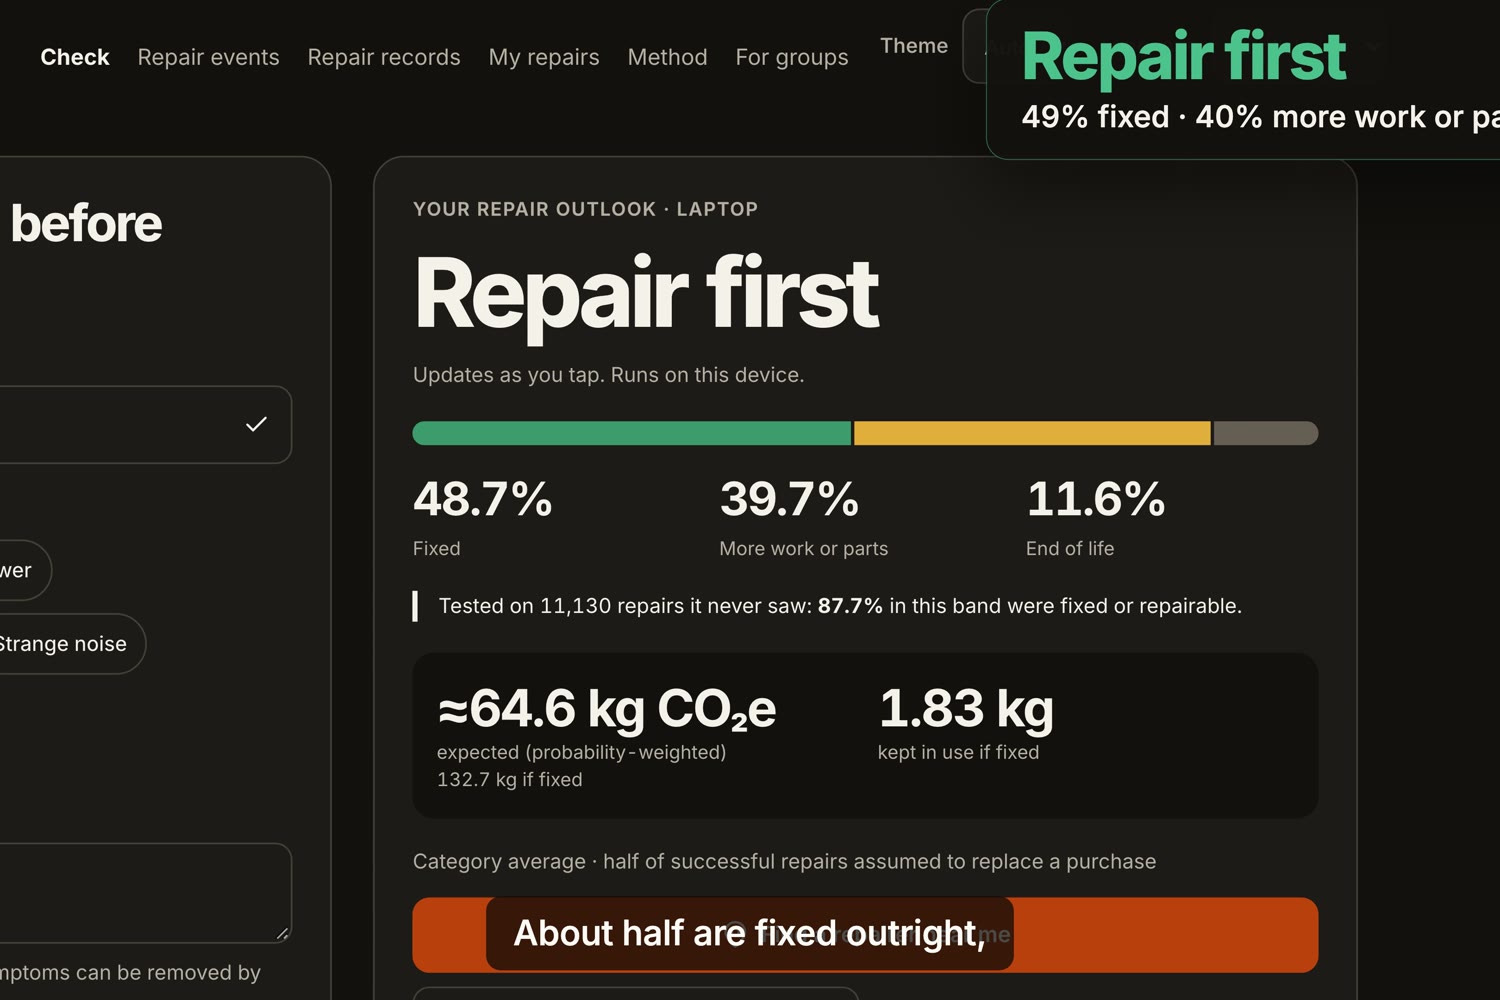
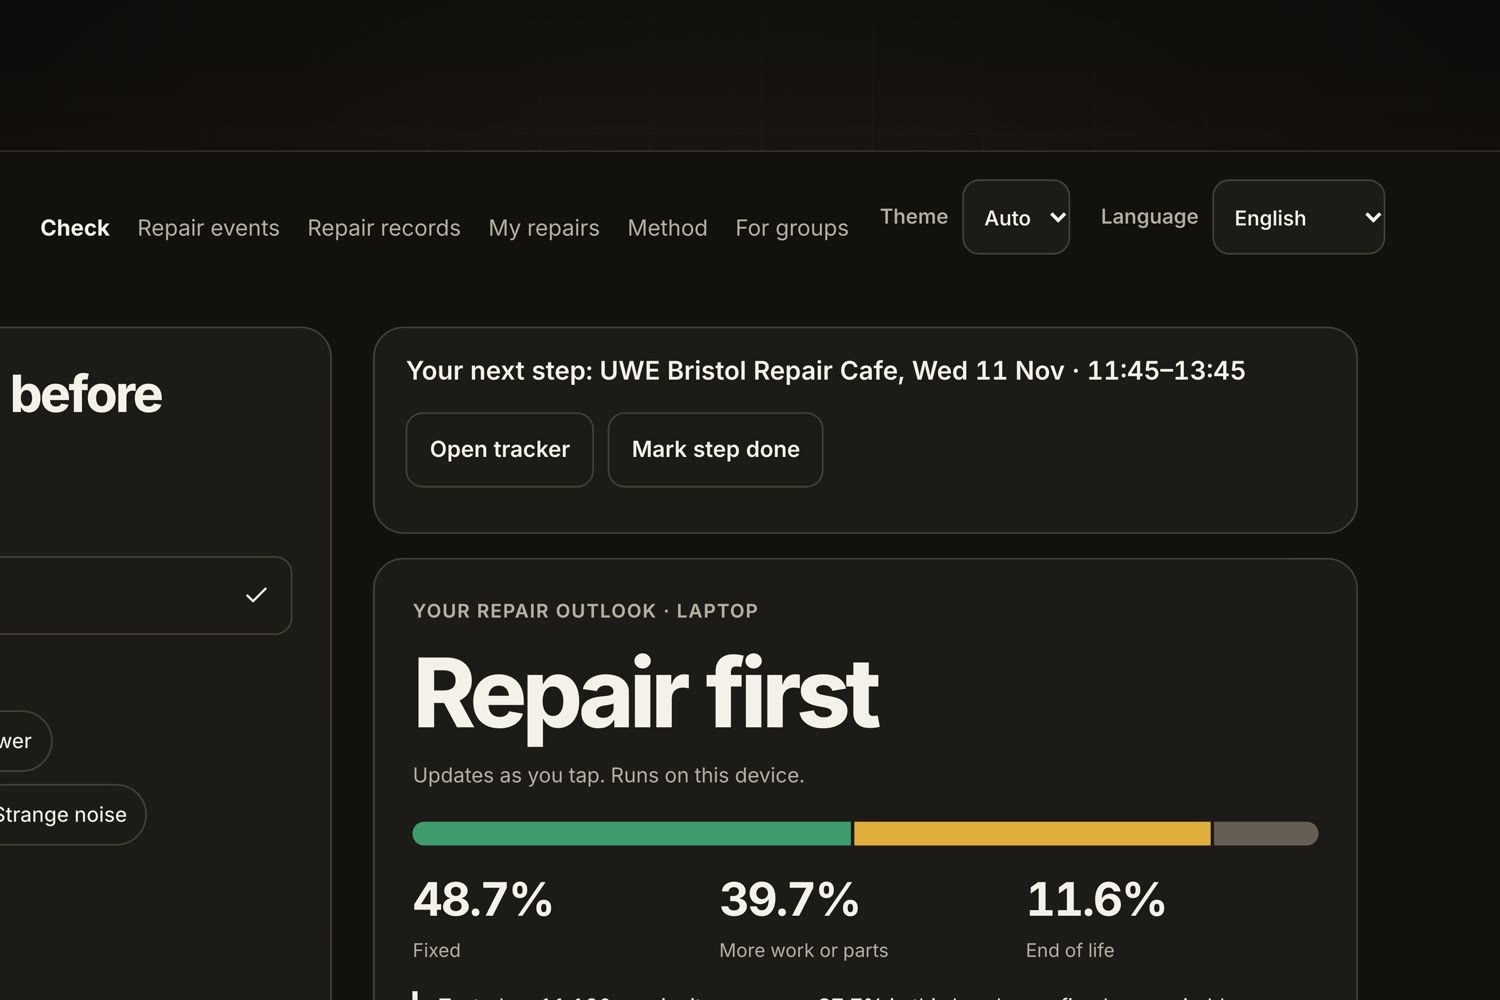
The verdict for a five-year-old laptop that will not charge: Repair first
-
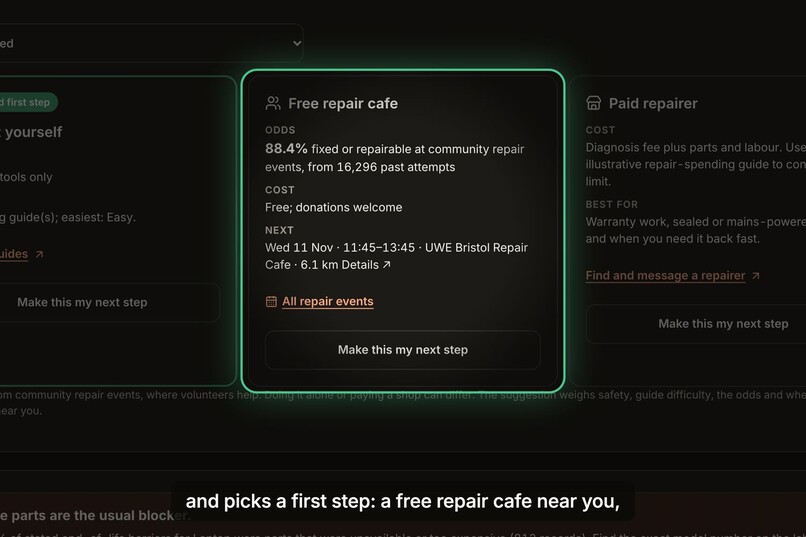
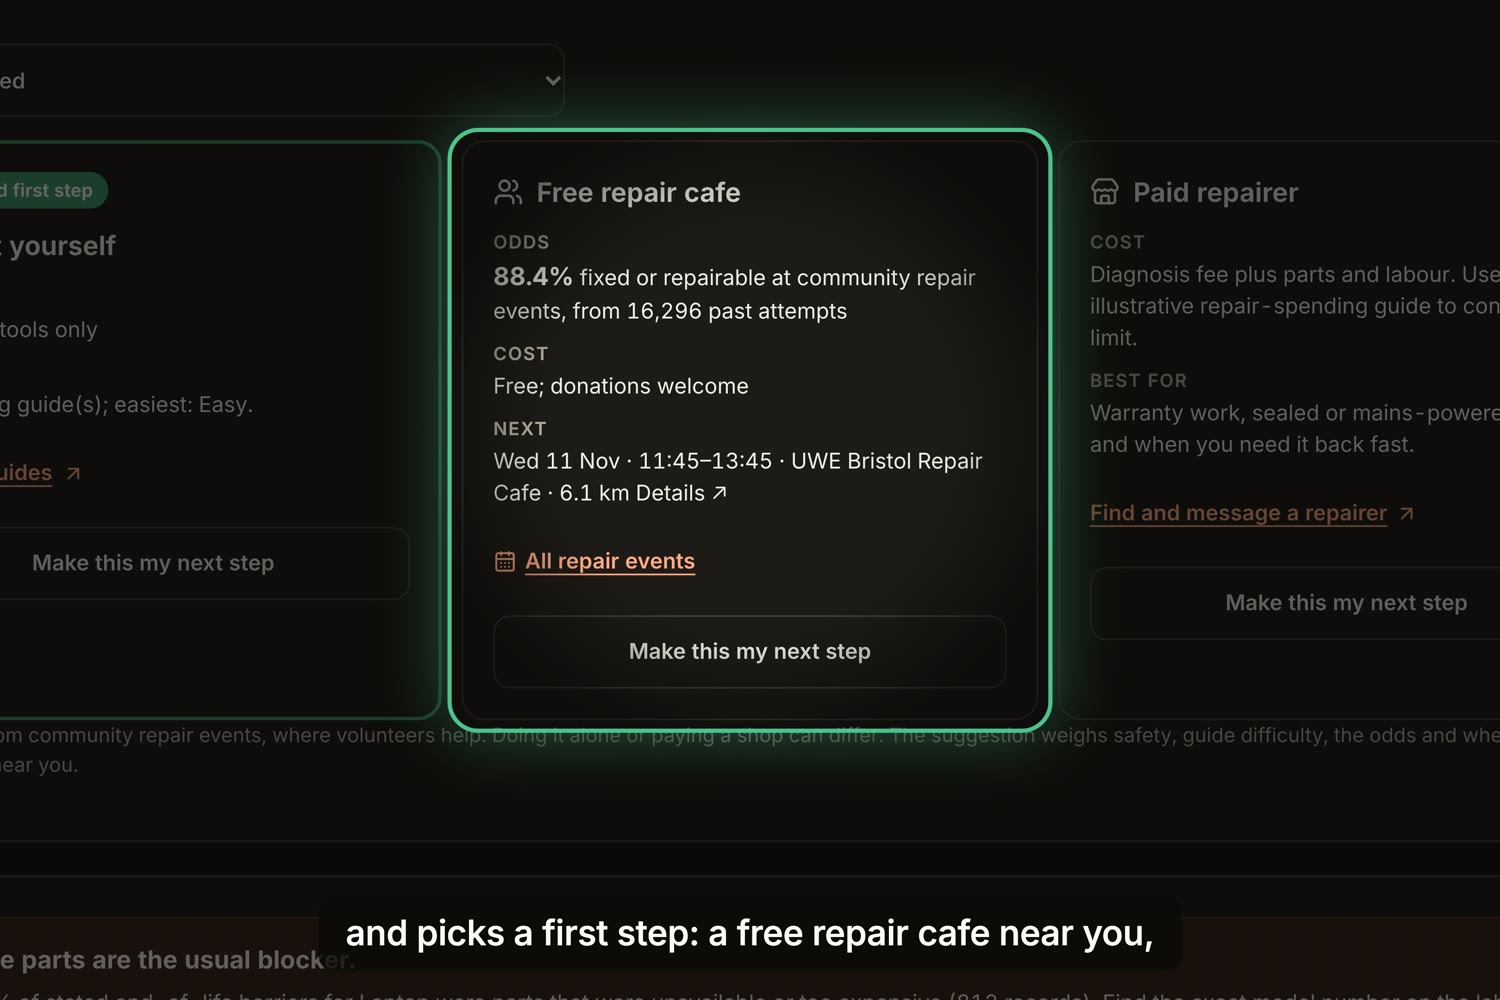
Three ways to get it fixed, with the next free repair cafe event
-
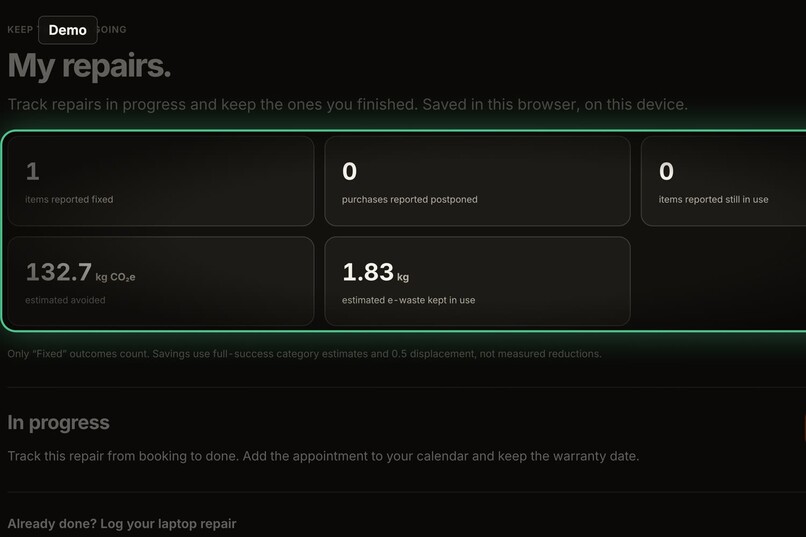
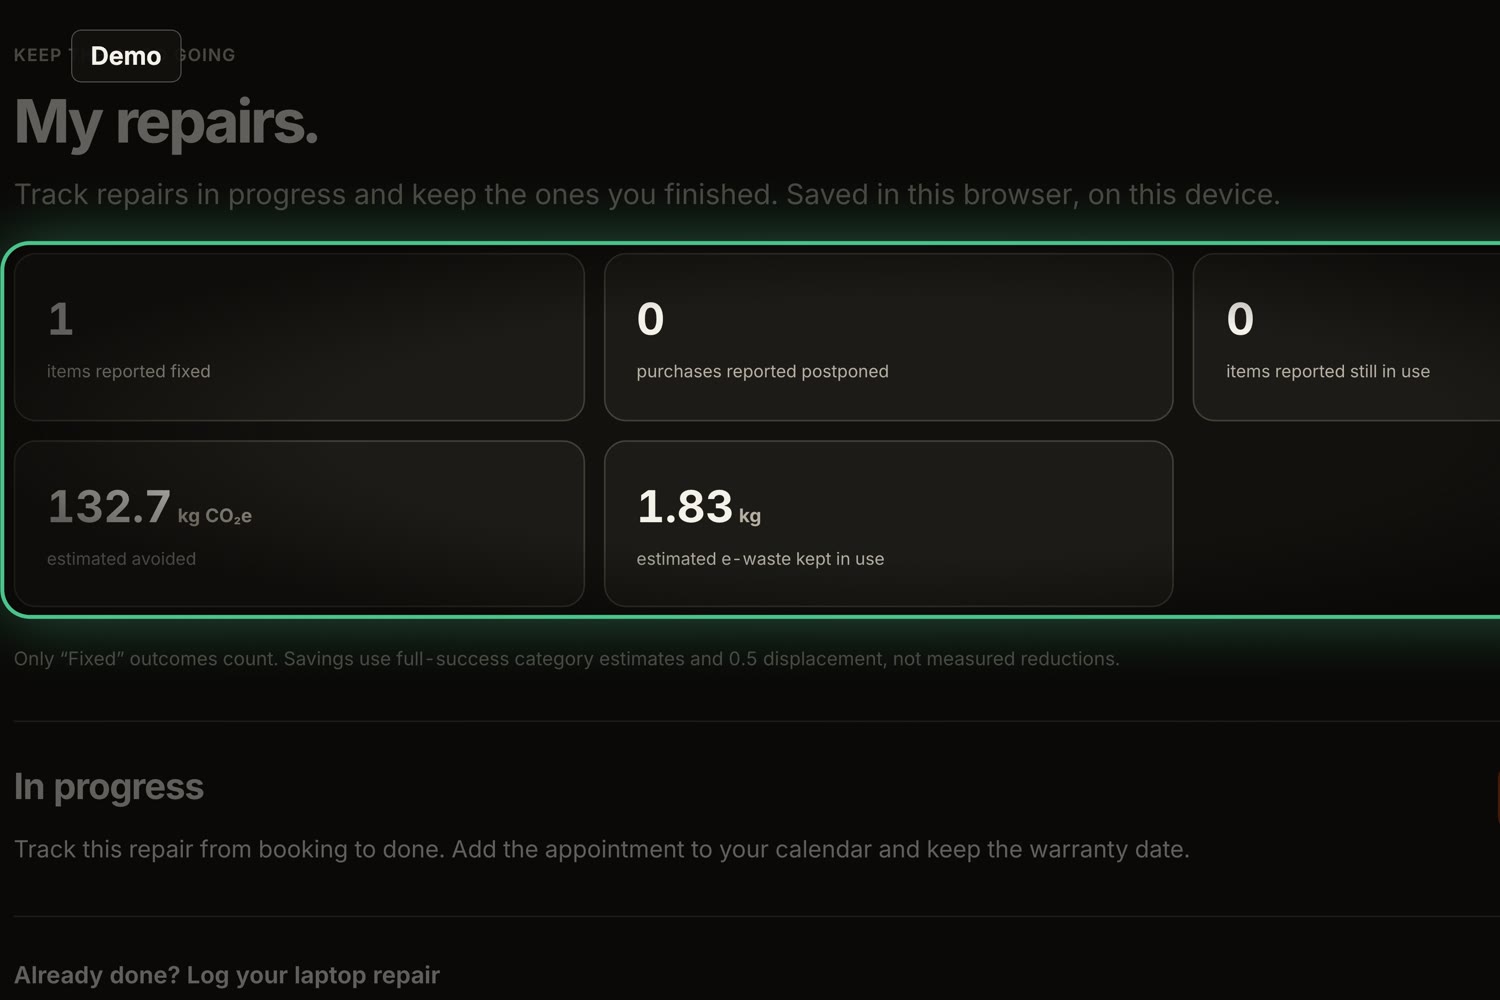
The tracker adds up CO2e and e-waste kept in use (demo)
-
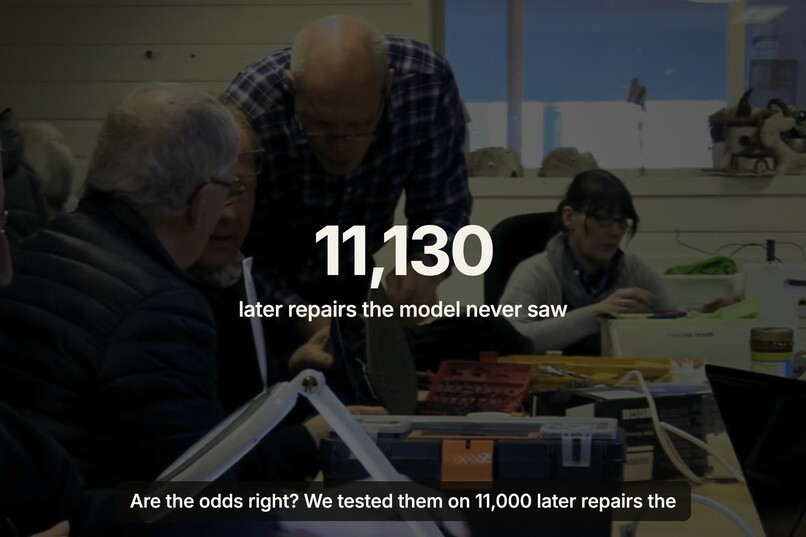
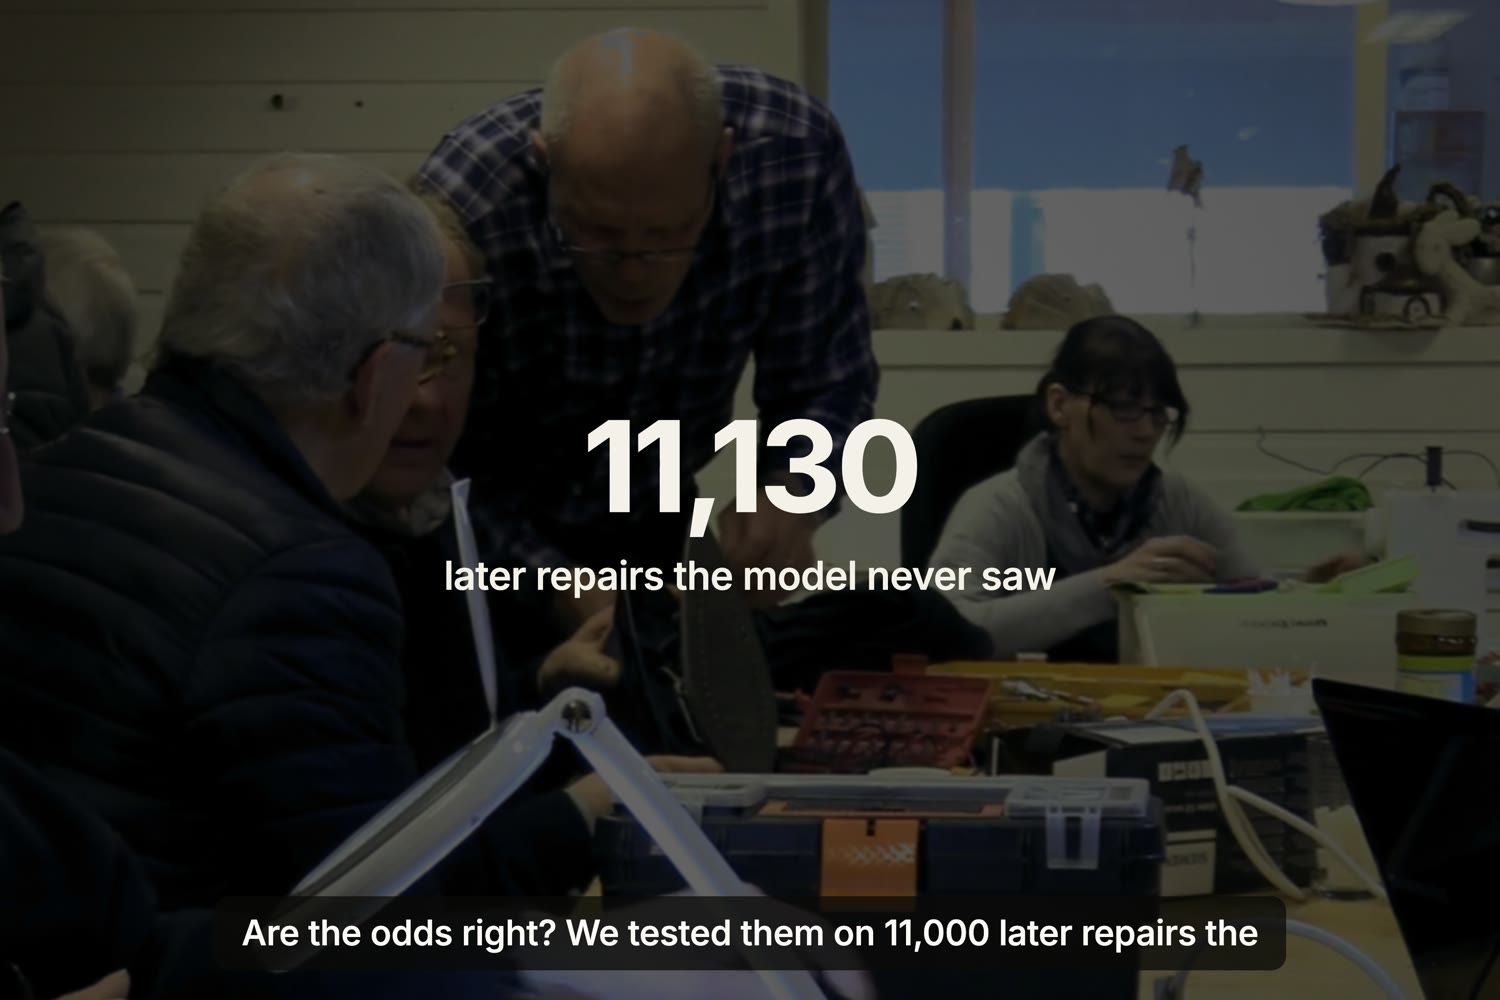
Tested on 11,130 later repairs the model never saw
-
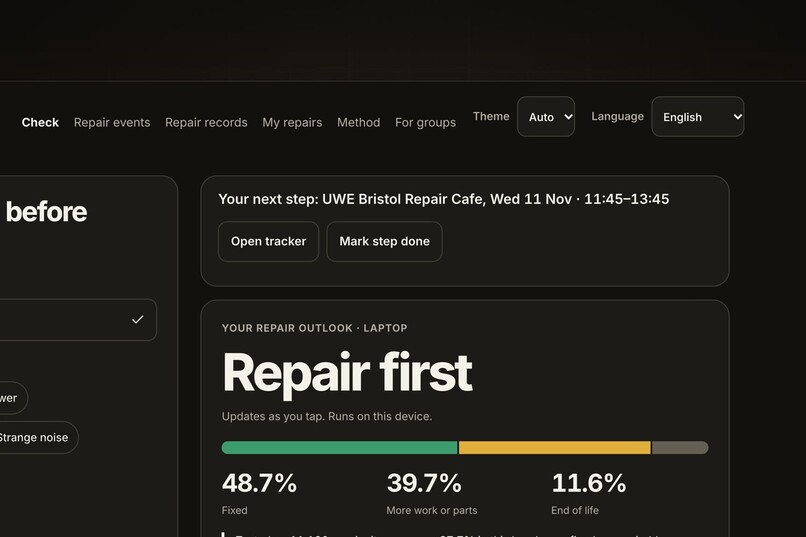
The saved next step stays at the top of the check
The problem
When a kettle, laptop or vacuum stops working, the decision to bin it usually happens in a few minutes, with no information. Nobody can say whether it is likely to be repairable, so replacing it feels like the safe choice. That choice throws away everything already spent making the device.
Repair cafes have been writing down what happens when people try. The answer has been sitting in an open dataset, not at the moment of decision.
Who it's for
Anyone holding a broken household electrical item and wondering what to do next, and the volunteer repair groups who can use the outcomes they log.
What it does
Pick the item and its symptoms, or describe them in your own words in English, Dutch, German or French. The interface is in English, Dutch, German, French and Chinese. FixOdds gives you:
- The odds, live: how likely it is to be fixed, repairable with more work or parts, or at end of life, with a plain verdict: Repair first, Worth a try, or Harder repair, check first. There is no submit button: the odds move as you tap, and each symptom shows how much it moved them.
- The impact: expected kg CO2e avoided and e-waste kept in use, with the formula on show. A successful laptop repair is about 133 kg CO2e and 1.8 kg of e-waste.
- The money, if you want it: enter your own replacement price and repair quote to see a break-even spend.
- What usually stops this repair: the most common barriers recorded for that kind of item, each with a concrete action.
- Where to go: the nearest of 20,034 mapped repair cafes and repair shops worldwide, on a map, with phone numbers and opening hours where OpenStreetMap has them.
- A repair ticket: a printable one-page summary to bring along, with an agreed spending limit, the item's condition at hand-over, a QR code and a share link.
- A share card: an image of the verdict and its carbon and e-waste figures, made in your browser.
- For repair groups and councils: an embeddable version of the check for their own websites.
- A next step you can act on: choose a route and save it as your next step. The enquiry message to a repairer is written for you, and you confirm once it is sent.
- A repair tracker: follow the item from planned to enquiry sent, booked, with the repairer, waiting for parts and done, with the kilograms of CO2e and e-waste kept in use added up as repairs finish.
- A repair log: record outcomes, see the running total, and export them in the Open Repair Data Standard (or as a pilot CSV) so a repair group can use them.
- Safety first: swollen batteries, smoke, sparks, gas and similar reports override the verdict and tell you to stop using the item.
There are no accounts or analytics. Prediction runs in your browser, so your description stays on your device. The repair finder is the only part that goes online, and only when you use it: a typed town goes to OpenStreetMap's place search, and the map loads tiles for that area from OpenStreetMap.
How it works
The model is trained on the Open Repair Alliance dataset: 416,282 real repair attempts from repair groups in dozens of countries, 403,558 of them with a known outcome. It is a multinomial logistic regression over item category, age, brand and 21 symptoms, small enough (10 KB gzipped) to ship to the browser. A test checks that the TypeScript prediction matches the Python model on 200 held-out records.
The carbon and e-waste figures use The Restart Project's published category factors, with their 0.5 displacement factor, because not every repair replaces a purchase.
Does it work?
It is tested on later repairs from repair groups it never saw in training (out of time, group-disjoint, 41,047 attempts):
| Verdict | Share of attempts | Fixed outright | Repairable with more work | End of life |
|---|---|---|---|---|
| Repair first | 27% (11,130) | 69.7% | 17.9% | 12.3% |
| Worth a try | 55% (22,383) | 55.1% | 18.4% | 26.5% |
| Harder repair, check first | 18% (7,534) | 41.5% | 19.1% | 39.4% |
Predicted probabilities track what actually happened across the range (the calibration chart is on the method page). AUC for "fixed" is 0.640, against 0.585 for category averages alone.
The hardest part
My first model scored an AUC of 0.81 and it was wrong. The dataset's "problem" field is mostly written after the repair, so the model had learned words like "replaced", "soldered" and "not repairable". It was reading the answer, and nobody could type those words before a repair.
So I removed free words from the model and built a list of 21 symptoms a person can actually report beforehand, in English, Dutch, German and French. The number dropped to 0.64, and that is the honest number. The method page explains this in full.
Expected environmental benefit
Each repair that replaces a purchase avoids the emissions of making a new device. Applying these same factors to the dataset, its 202,076 recorded fixes in categories with a factor correspond to about 5,400 tonnes CO2e and 700 tonnes of e-waste kept in use. These are historical community repairs, not savings claimed for FixOdds; the tracker and repair log are there to count FixOdds' own effect, one repair at a time. That shows the size of what repair does, and FixOdds exists to send more items down that path by making the case at the moment people decide, with a next step attached. Logged outcomes also feed back in a form repair groups can share.
What's next
Testing with a repair cafe, adding non-electrical items such as clothing and bikes, and refreshing the model and place directory with each new data release.
Credits
Open Repair Alliance dataset (CC BY-SA 4.0), The Restart Project emission factors (GPL-3.0), OpenStreetMap contributors (ODbL), Leaflet. No endorsement by any of them is implied.
Built With
- github
- leaflet.js
- open-repair-data
- openstreetmap
- playwright
- python
- react
- scikit-learn
- typescript
- vite
- vitest
