-
-
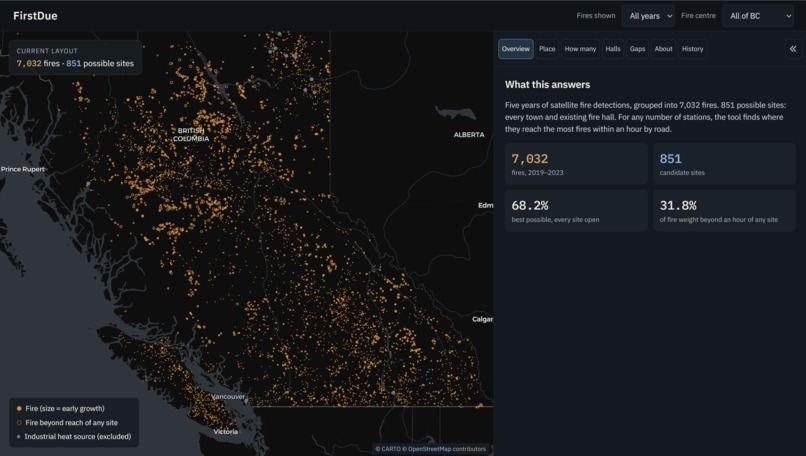
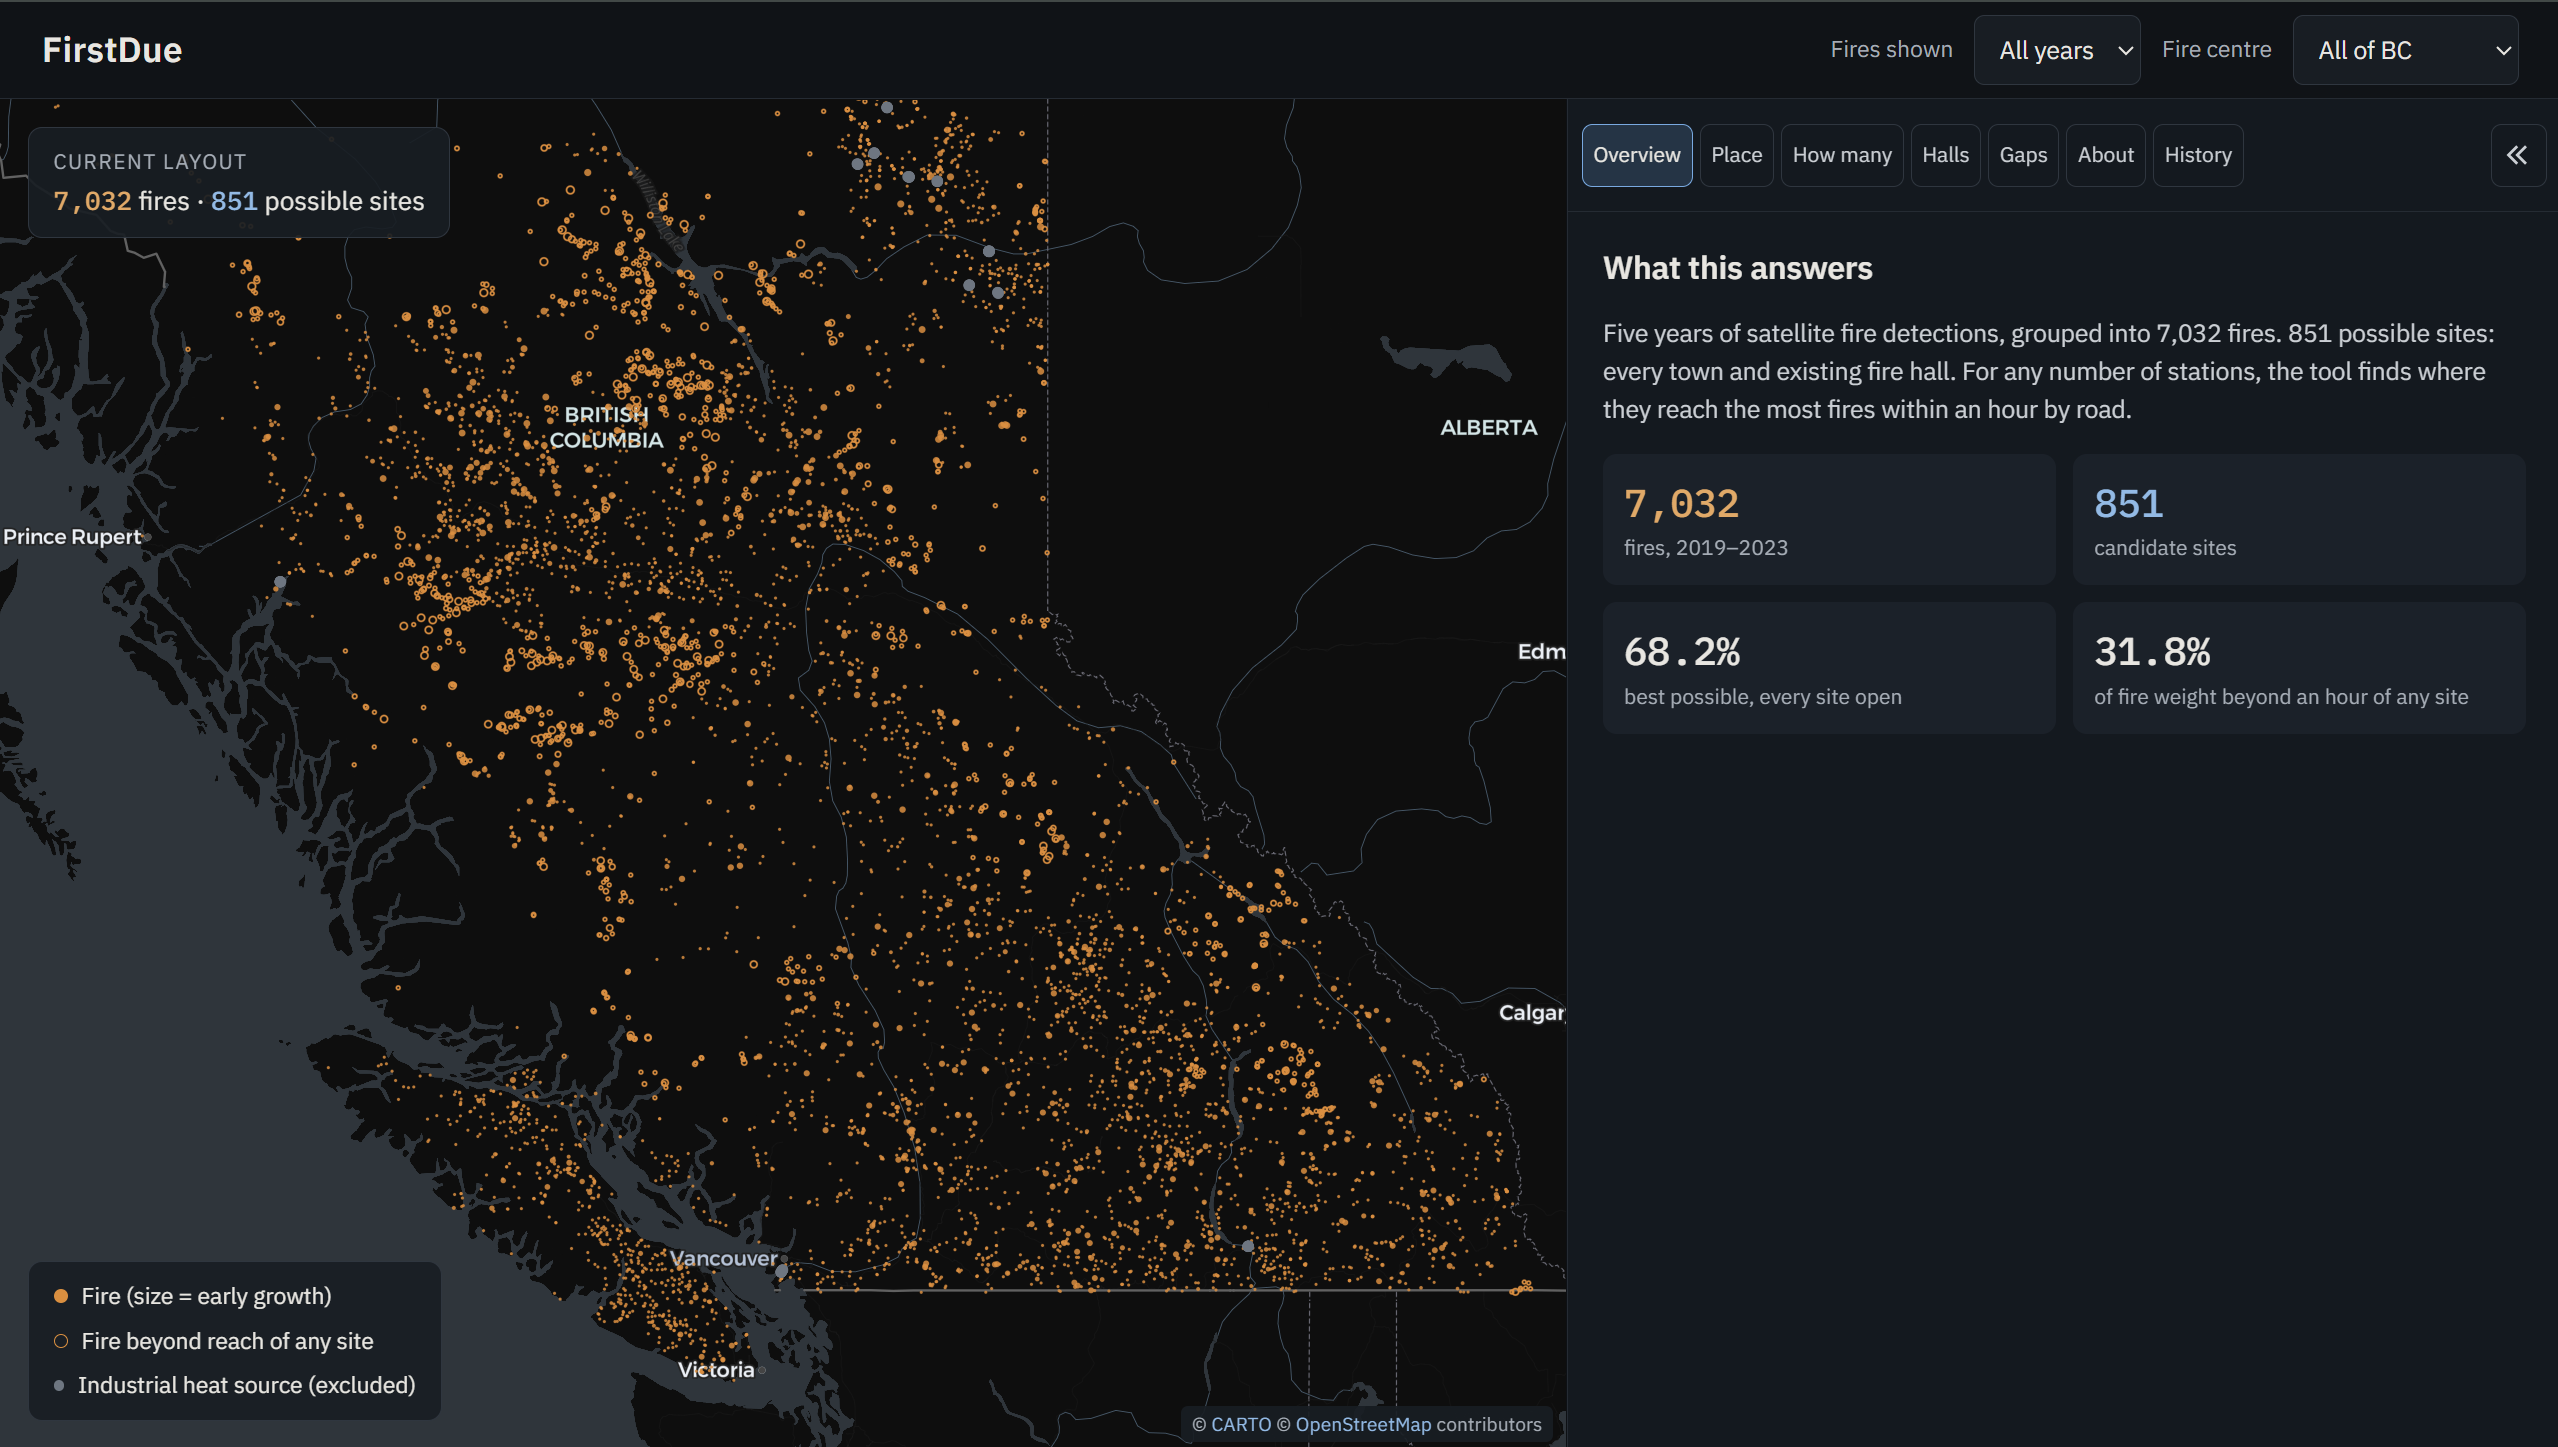
Landing page: overview
-
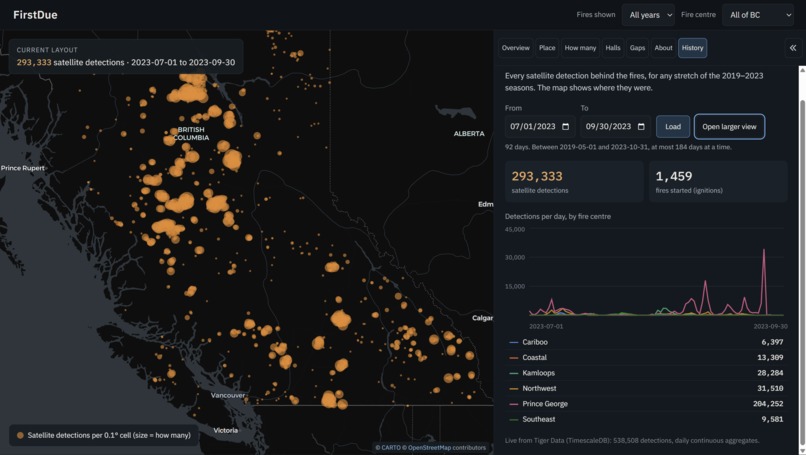
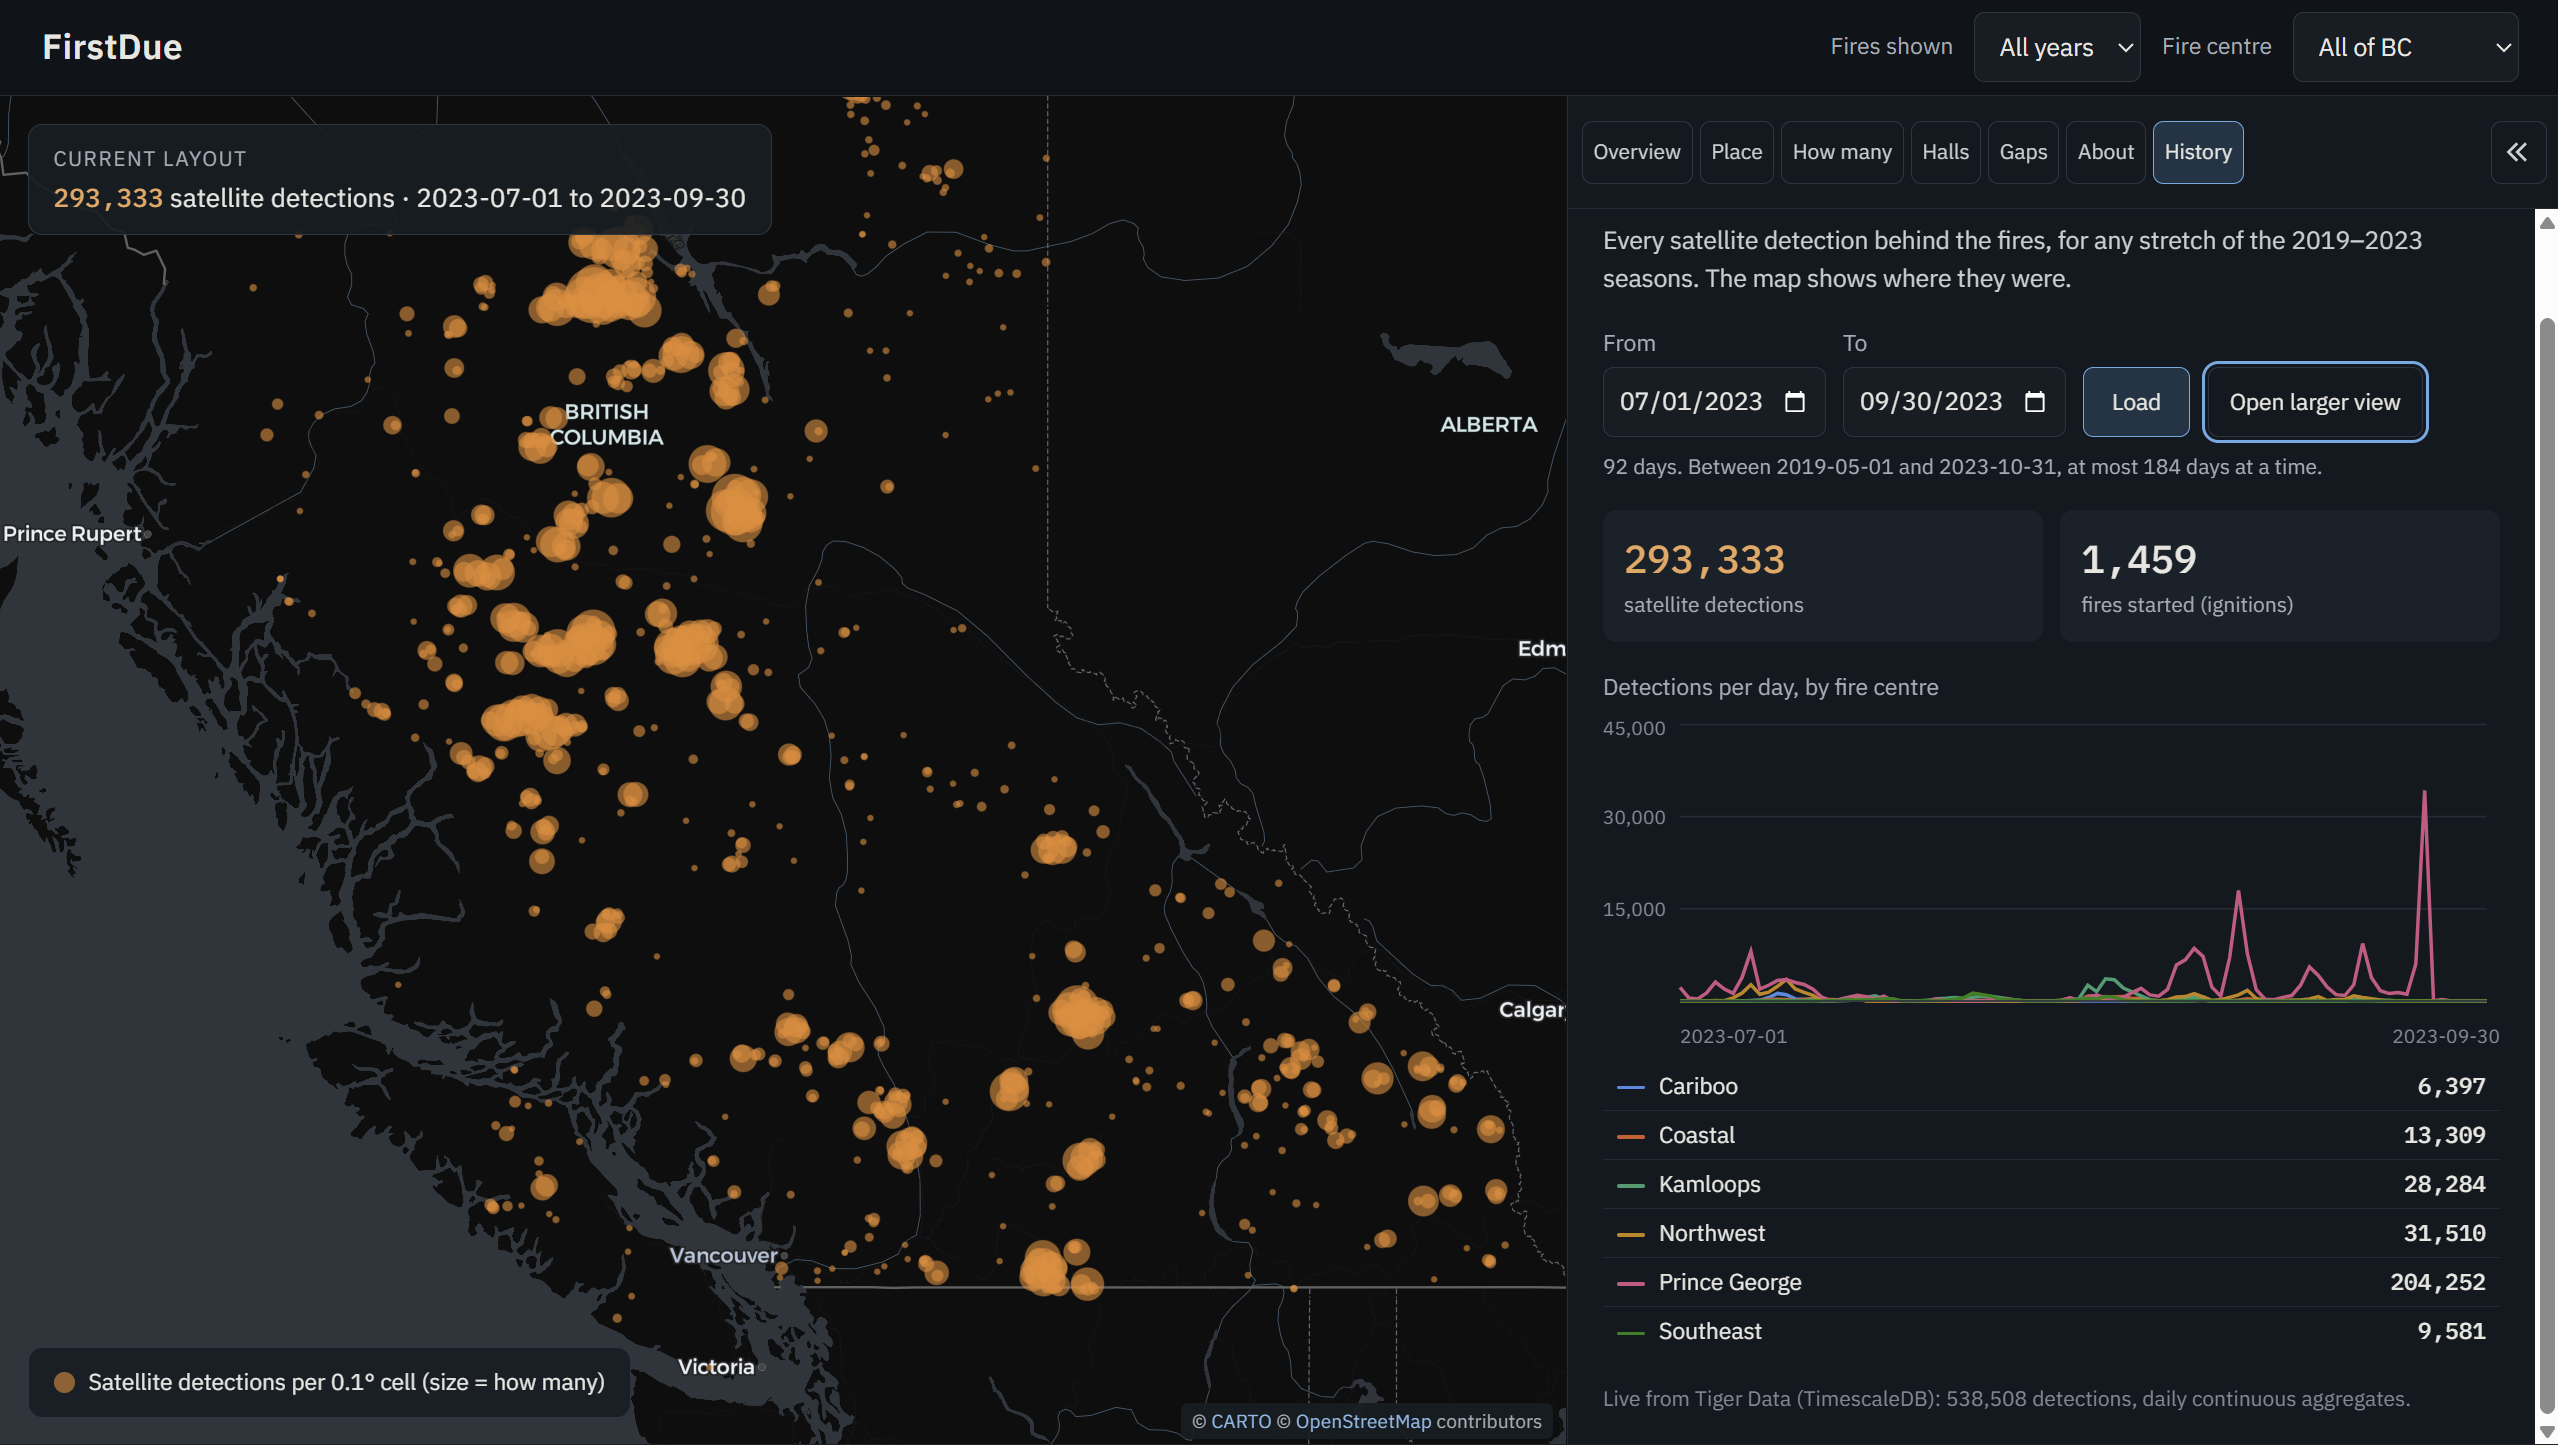
Fire history over time
-
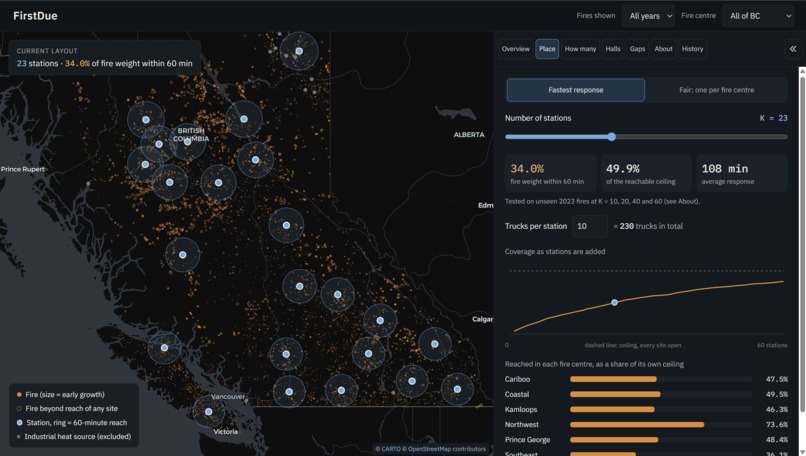
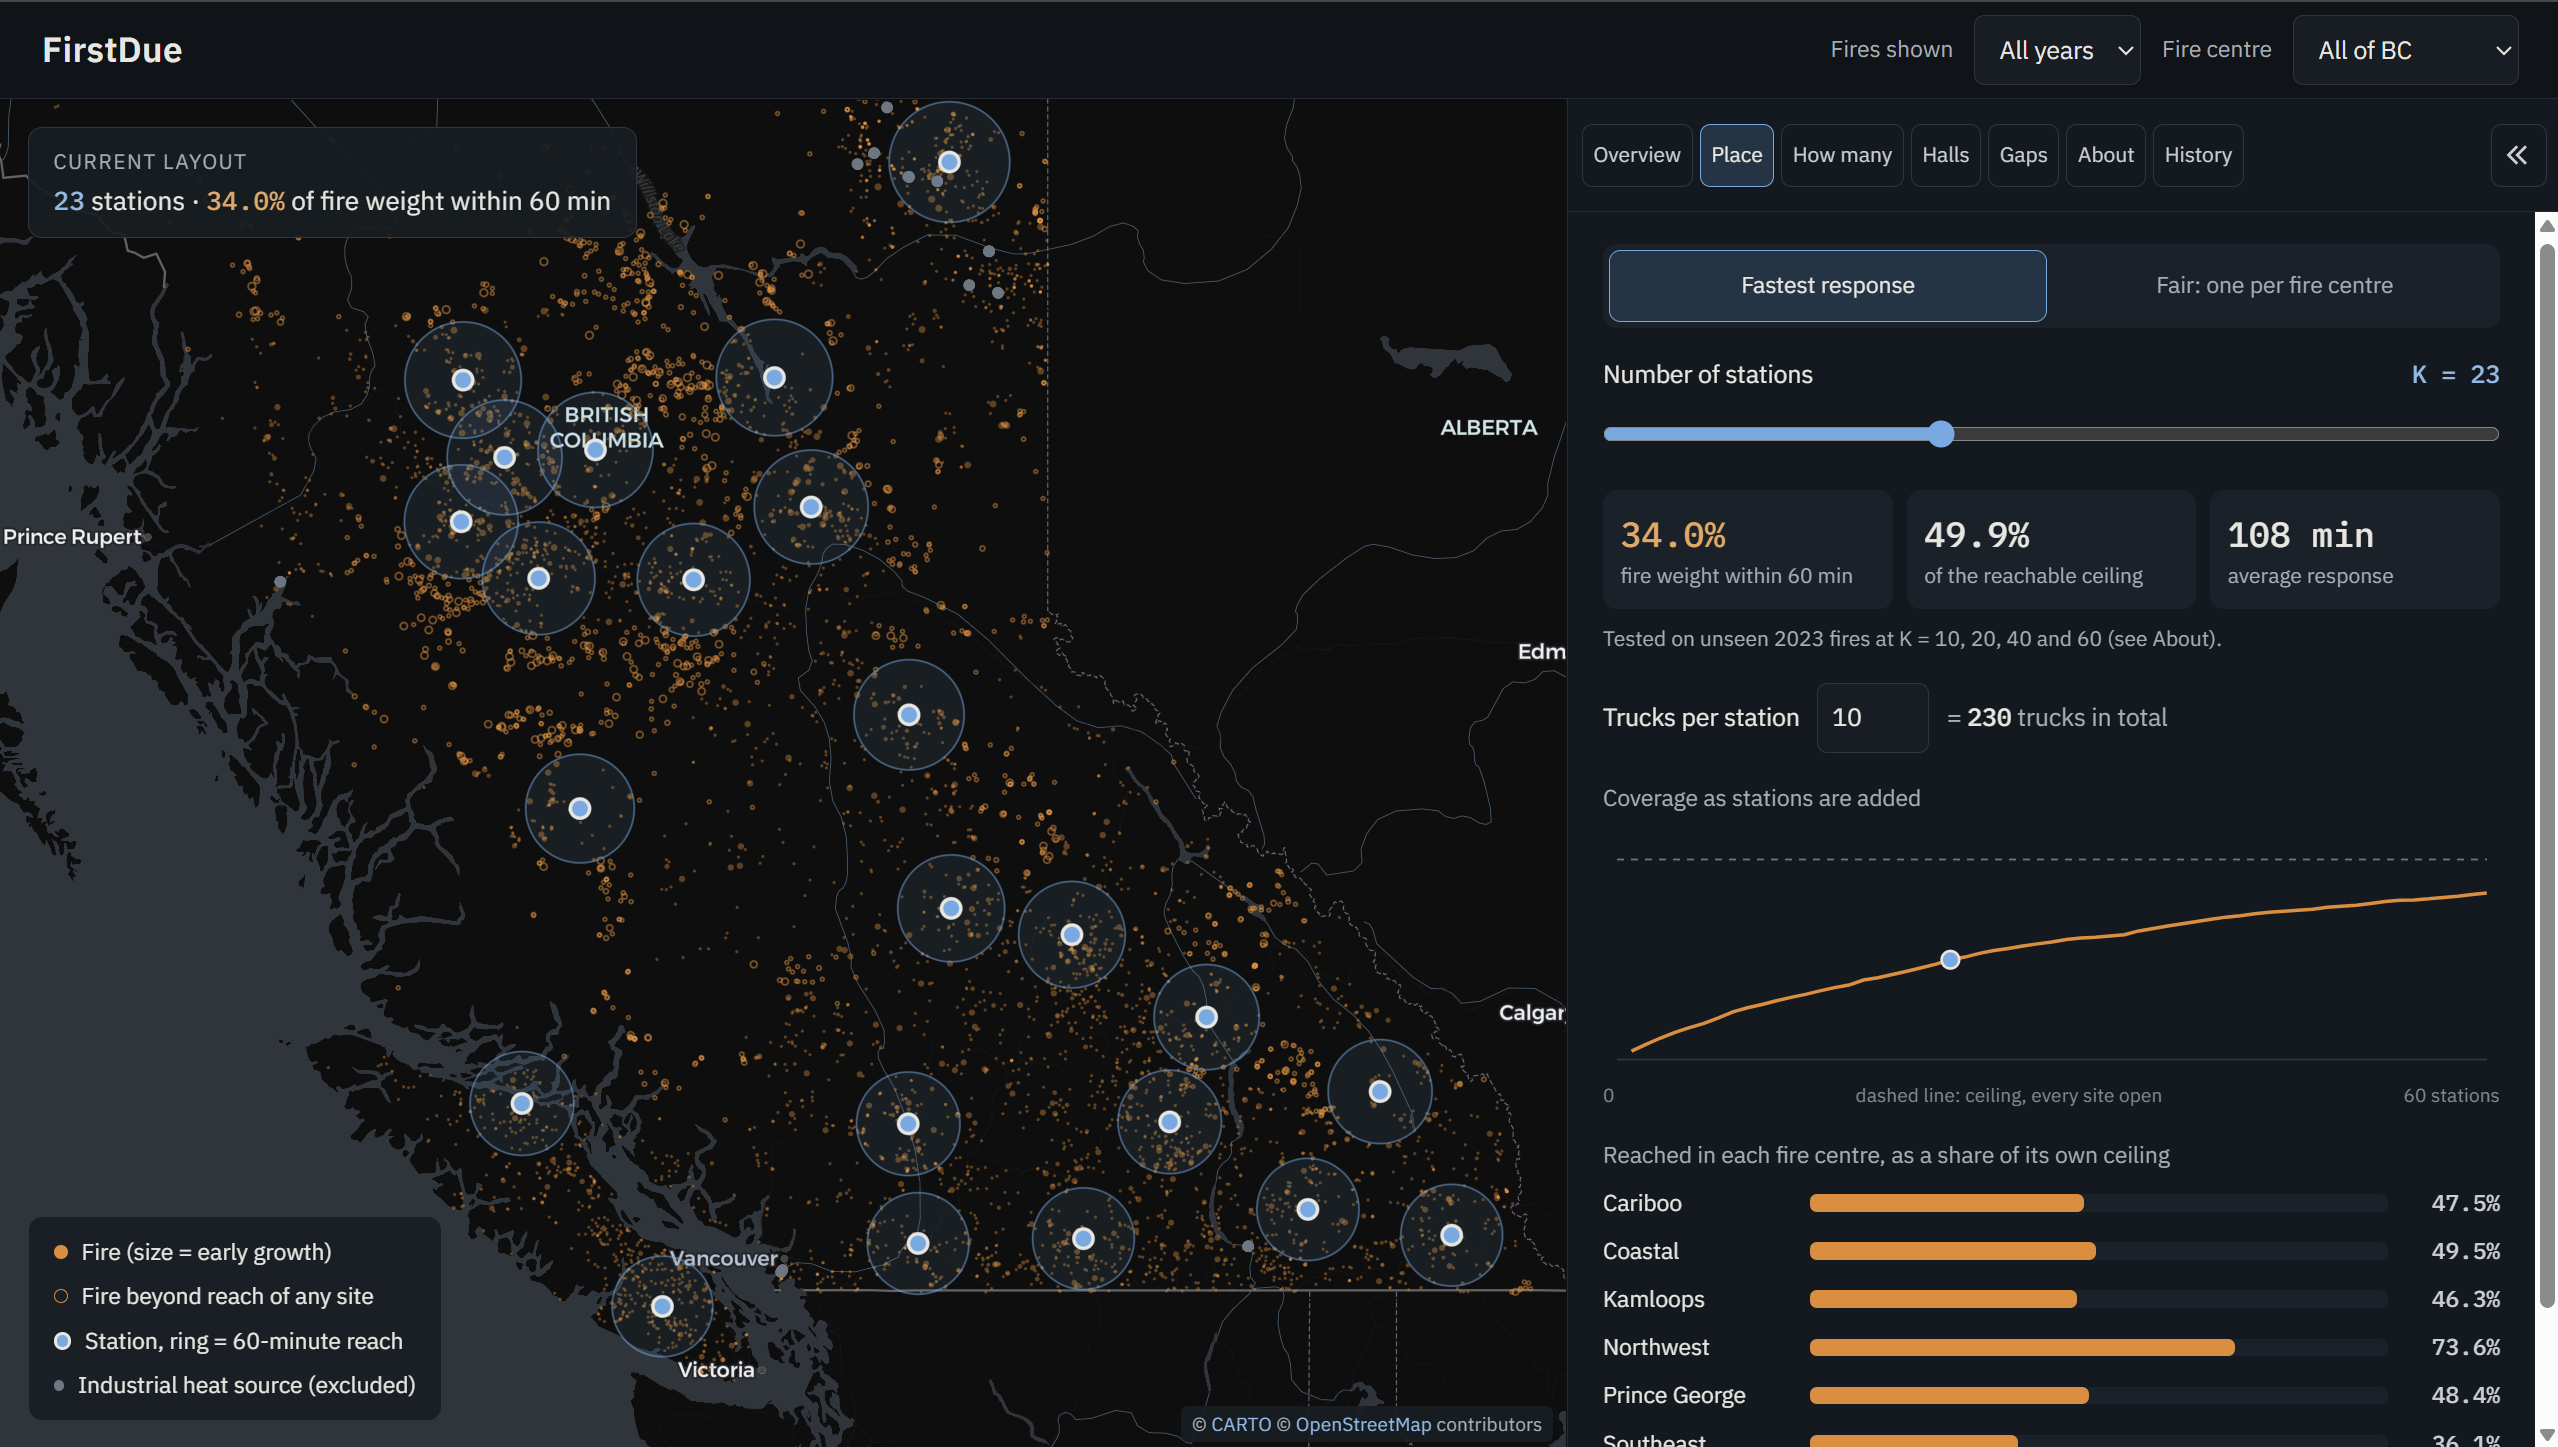
Optimise stations for response times
-
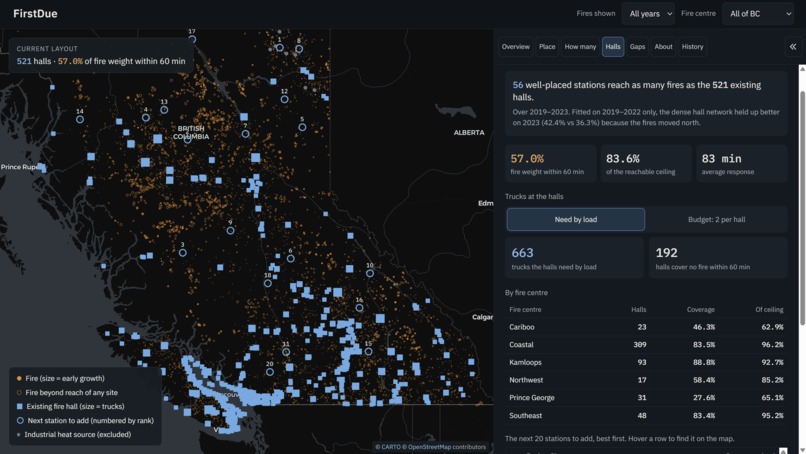
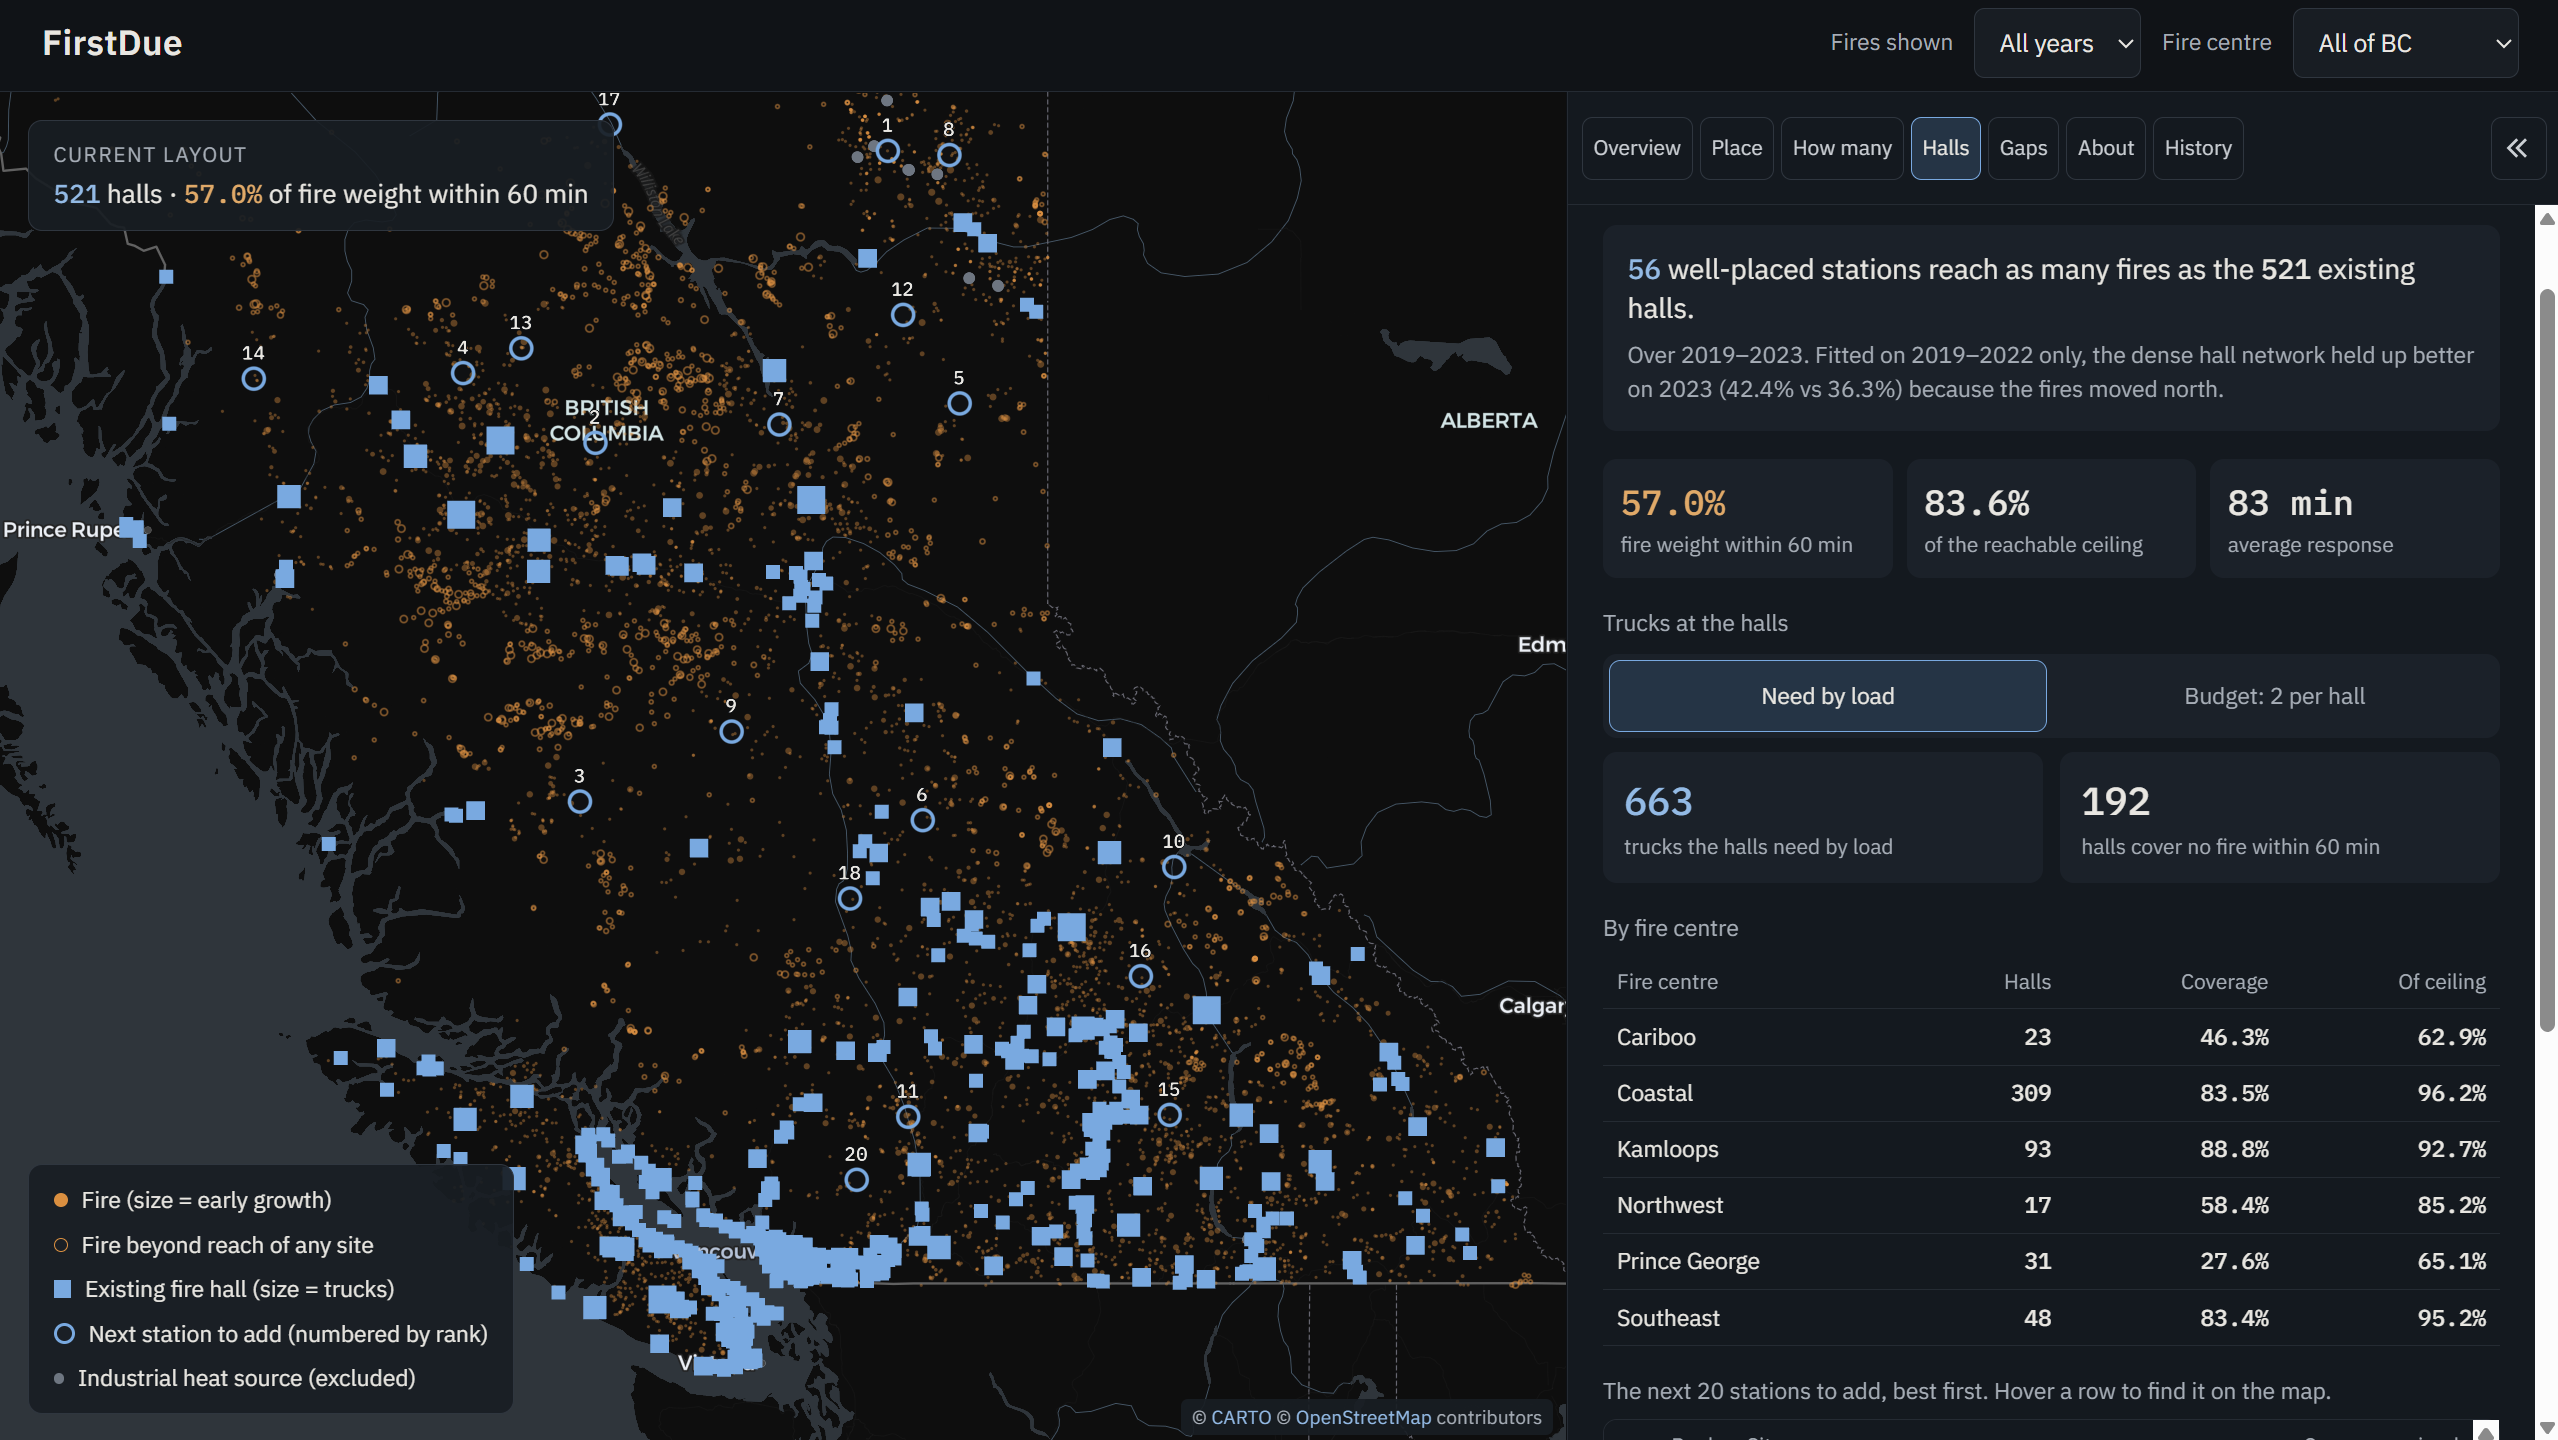
Existing Fire depots and thier span
Inspiration
BC's 2023 wildfire season was the worst on record. When a fire starts, the first hour matters most: a truck that arrives while a fire is still small can stop it; one that arrives late is chasing it. So I asked a simple question: if you could place wildfire stations anywhere in BC, where should they go to reach the most fires within an hour?
NASA has been recording the fires its satellites detect for decades, free for anyone, and almost nobody uses that record for planning. I wanted to show what it can do.
What it does
FirstDue is an interactive planning tool built on 7,032 BC wildfires detected by NASA satellites between 2019 and 2023.
- Place stations: choose 1–60 stations and see where they should go, how much fire weight they reach within 60 minutes, and the average response time. A "fair" mode guarantees every fire centre a station first. Drag any station to another site and everything re-scores instantly.
- How many: the fewest stations that reach 95% of all reachable fire weight (about 64.8% of all fire weight): 81 stations and 214 trucks, with trucks sized by how many fires each station sees burning at once on a busy day.
- Existing halls: BC's 521 fire halls together reach 57.0% of all fire weight within an hour. 56 well-placed stations reach as much. It also ranks the next 20 stations worth adding to the existing network.
- Gaps: even with all 851 candidate sites open, 31.8% of all fire weight is more than an hour from any site, mostly in the Prince George fire centre. That's air-attack territory, and the map shows exactly where.
- History: all 538,508 satellite detections, queried live from Tiger Data, with daily charts and a heat map for any date range.
- Ask: a Gemini 3.8 Flash assistant that answers plain-English questions about the results, grounded only in the analysis.
How I built it
1. From satellite pixels to fires
I downloaded NASA FIRMS VIIRS 375 m active-fire detections for BC (2019–2023) through the FIRMS API, filling a 15-day gap in 2022, when the S-NPP satellite was offline, with data from NOAA-20.
Satellites see one big fire as thousands of pixels over weeks, so I grouped detections into fires: two detections belong to the same fire if they are within 3 km and 5 days of each other (the same 5-day window NASA's FEDS fire-tracking system uses). A KD-tree finds nearby pairs, and connected components turn them into fires. That turned 538,508 detections into 7,227 fires.
Some "fires" were really industrial heat: a gas plant near Taylor, the Kitimat smelter, a landfill in Delta. They give themselves away by recurring at the same spot year after year, so I flagged small fires that repeat within 1 km across at least 3 years and removed 195 of them, leaving 7,032.
Each fire is weighted by how much it grew in its first 48 hours (capped), so fast-growing fires count more.
2. The optimization
This is a facility location problem. Candidate sites are 521 fire halls and 330 towns from OpenStreetMap (851 in total). Travel time from site $j$ to fire $i$ is estimated as
$$ t_{ij} = \frac{1.4 \, d_{ij}}{70\ \text{km/h}} \times 60 + 10 \ \text{minutes} $$
where $d_{ij}$ is the great-circle distance, 1.4 approximates road detours and 10 minutes covers getting out the door. Within 60 minutes, that's a reach of about 42 km.
To place $K$ stations, I minimize weighted response time (the p-median problem):
$$ \min_{S \subseteq J,\ |S| = K} \ \sum_i w_i \, \min_{j \in S} t_{ij} $$
For "how many," I maximize the fire weight reached within 60 minutes at each $K$ (maximal coverage), then take the smallest $K$ that reaches 95% of reachable weight.
Greedy solvers in NumPy handle every $K$ in seconds. I checked them against exact solutions from PySAL's spopt with the HiGHS solver: greedy came within 0.44 percentage points of optimal coverage everywhere the exact problem was tractable.
Trucks per station come from the 90th percentile of how many of a station's fires are burning at once, counted over its busy days.
3. Does it actually work?
I chose stations using only 2019–2022 fires, then scored them on the unseen 2023 season. At 20 stations:
| Layout | Share of reachable 2023 fire weight |
|---|---|
| FirstDue | 37.8% |
| Best of 1,000 random layouts | 28.1% |
| Median random layout | 16.3% |
| 20 biggest towns | 8.6% |
FirstDue beat all 1,000 random layouts. Placing stations in the biggest towns does worse than random, because big towns cluster in the southwest, away from the fires. Leaving each year out in turn gave steady results (34.7–41.8%), and while the exact towns chosen shift between years, the number of stations per fire centre stays stable.
4. Tiger Data
All 538,508 detections live in a TimescaleDB hypertable on Tiger Cloud, with continuous aggregates of daily detections per fire centre and per map cell. The History tab's three-month queries over 293,333 detections return in under 100 ms, and I verified the database totals exactly against the pandas pipeline.
5. The web app
Next.js and TypeScript, MapLibre and deck.gl for the map, Recharts for charts. The optimization results are exported once under a strict data contract, and the browser re-scores dragged stations with the same formula as the Python engine. A conformance test proves the browser and the notebook agree to within 0.0001.
The Ask tab calls Gemini 3.8 Flash from a server-side route, so the API key never reaches the browser. It's grounded in a compact summary of the computed results and declines questions the data can't answer.
Challenges I faced
- One fire, many "fires." A tight linking rule split 2023's big fires into twice as many fragments, which would have pulled stations toward them. I loosened the rule, compared three settings, and documented the sensitivity.
- Fake fires. Gas flares and smelters look exactly like small fires from space. Recurrence at the same spot is what gave them away.
- The ceiling. I first aimed for 95% of all fire weight, then found that even with all 851 sites open, only 68.2% is within an hour. Rather than invent stations in roadless wilderness, I measured against what's reachable and made the gap a finding of its own.
- Truck sizing that said nothing. My first method gave almost every station one truck, because most days have zero fires. Measuring only busy days fixed it.
- Scale. Exact p-median at full size means about 6 million assignment variables (7,032 fires × 851 sites), so I validated greedy against exact solutions where they were tractable.
What I learned
An optimization question doesn't need a black-box model; it needs clean data, a clear objective and an honest test. The biggest lesson was how much data cleaning matters: the clustering rule and the industrial-source filter changed the answers more than any solver setting.
Limitations
Travel times are straight-line estimates, so remote areas look closer than they are by road. OpenStreetMap fire halls are mostly municipal, not BC Wildfire Service bases. A fire counts as active for up to 14 days after detection. Results are best read as comparisons between layouts, not operational response times.
What's next
- Real road travel times from a road network instead of straight-line estimates.
- Helicopter and air-tanker bases for the remote north.
- Weather-driven fire spread, so predicted spread, not just observed early growth, shapes each fire's weight.
- BC Wildfire Service base locations as the real-world baseline.
Tech stack
- Data: NASA FIRMS (VIIRS S-NPP and NOAA-20), OpenStreetMap
- Pipeline and optimization: Python, pandas, GeoPandas, NumPy, SciPy (KD-tree, connected components), PySAL
spopt, HiGHS - Database: Tiger Data (TimescaleDB on Tiger Cloud) with hypertables and continuous aggregates
- Web app: Next.js, TypeScript, React, MapLibre GL, deck.gl, Recharts
- AI: Google Gemini API (Gemini 3.8 Flash)
Built With
- deck.gl
- geopandas
- highs
- jupyter
- maplibre
- nasa-firms
- next.js
- numpy
- openstreetmap
- overpass-api
- pandas
- postgresql
- pulp
- pysal
- python
- react
- recharts
- scipy
- shapely
- spopt
- tailwindcss
- tiger-data
- timescaledb
- typescript

Log in or sign up for Devpost to join the conversation.