-
-
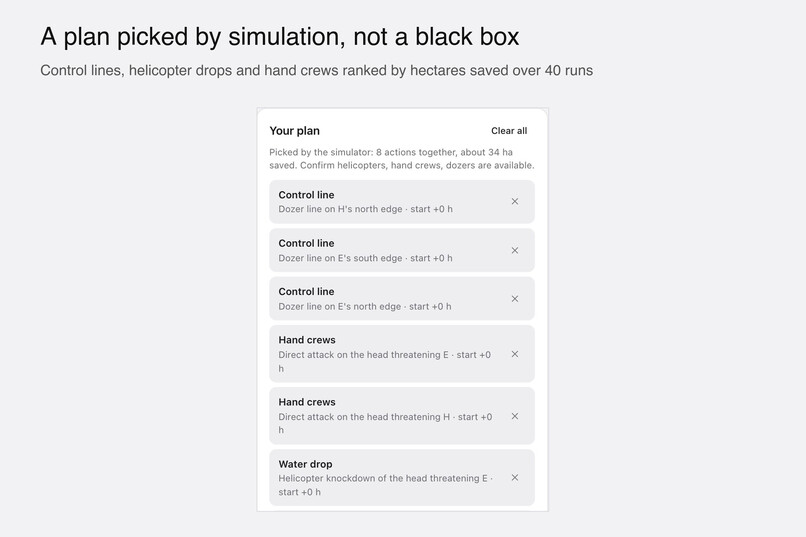
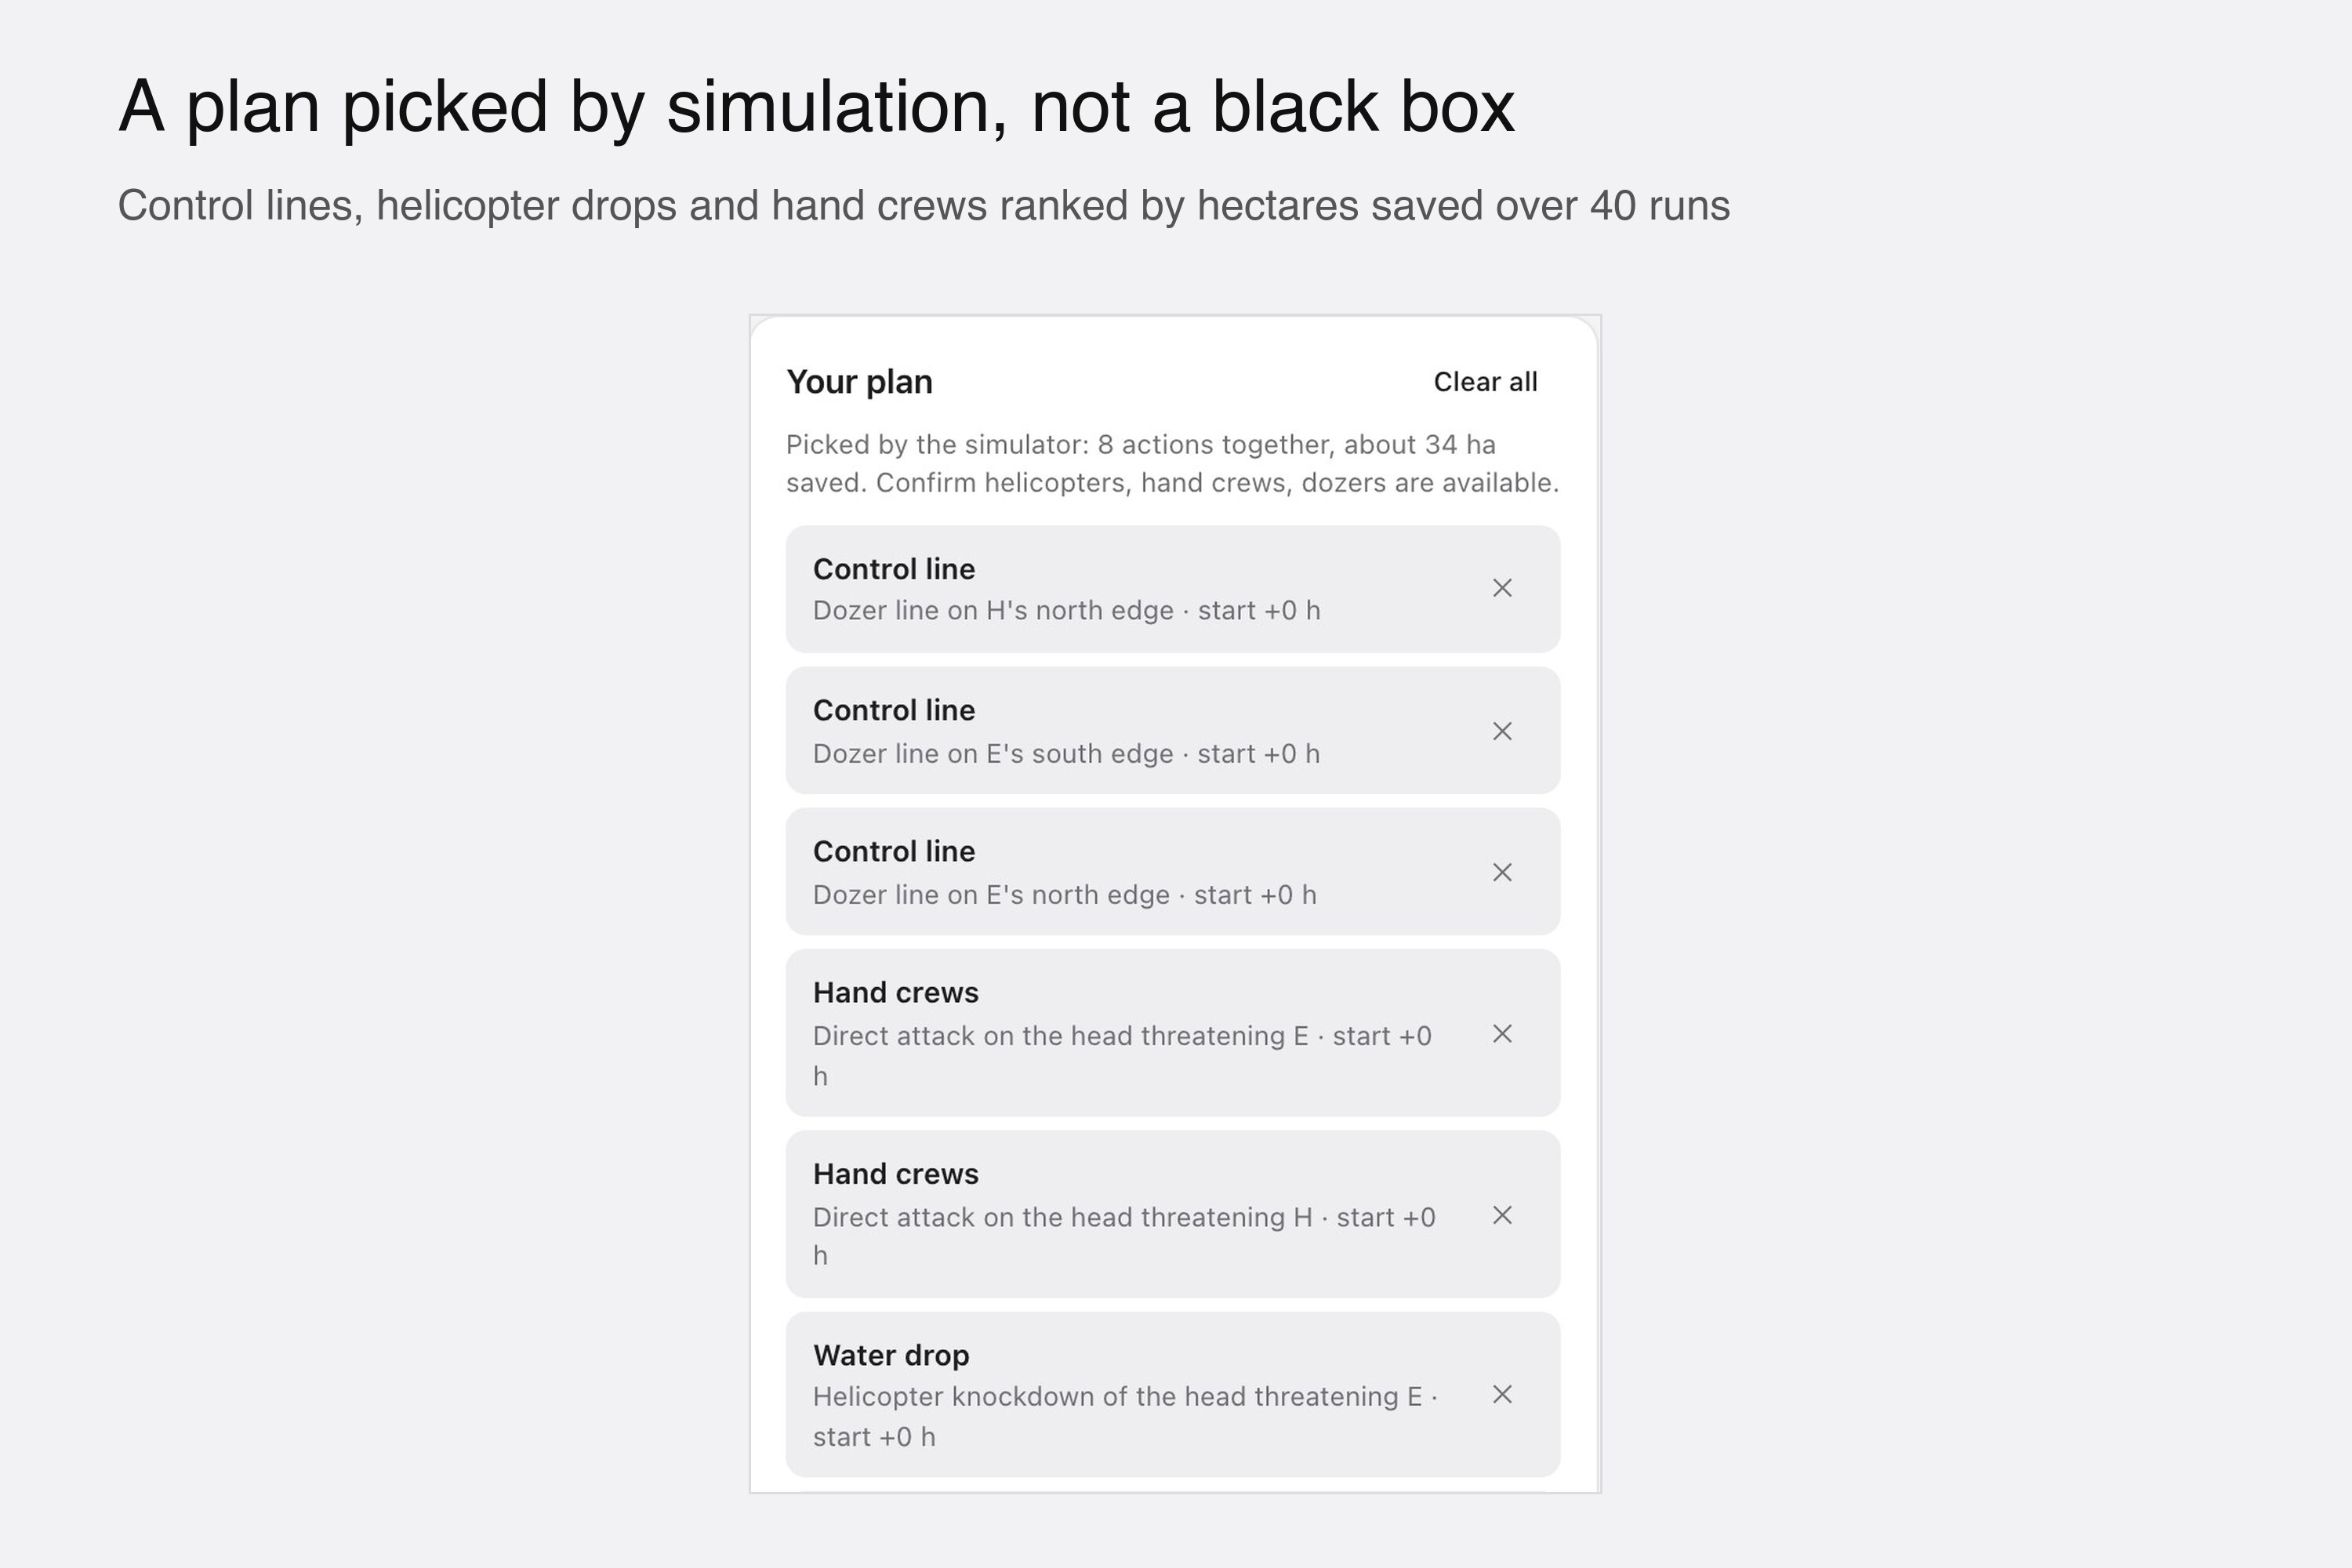
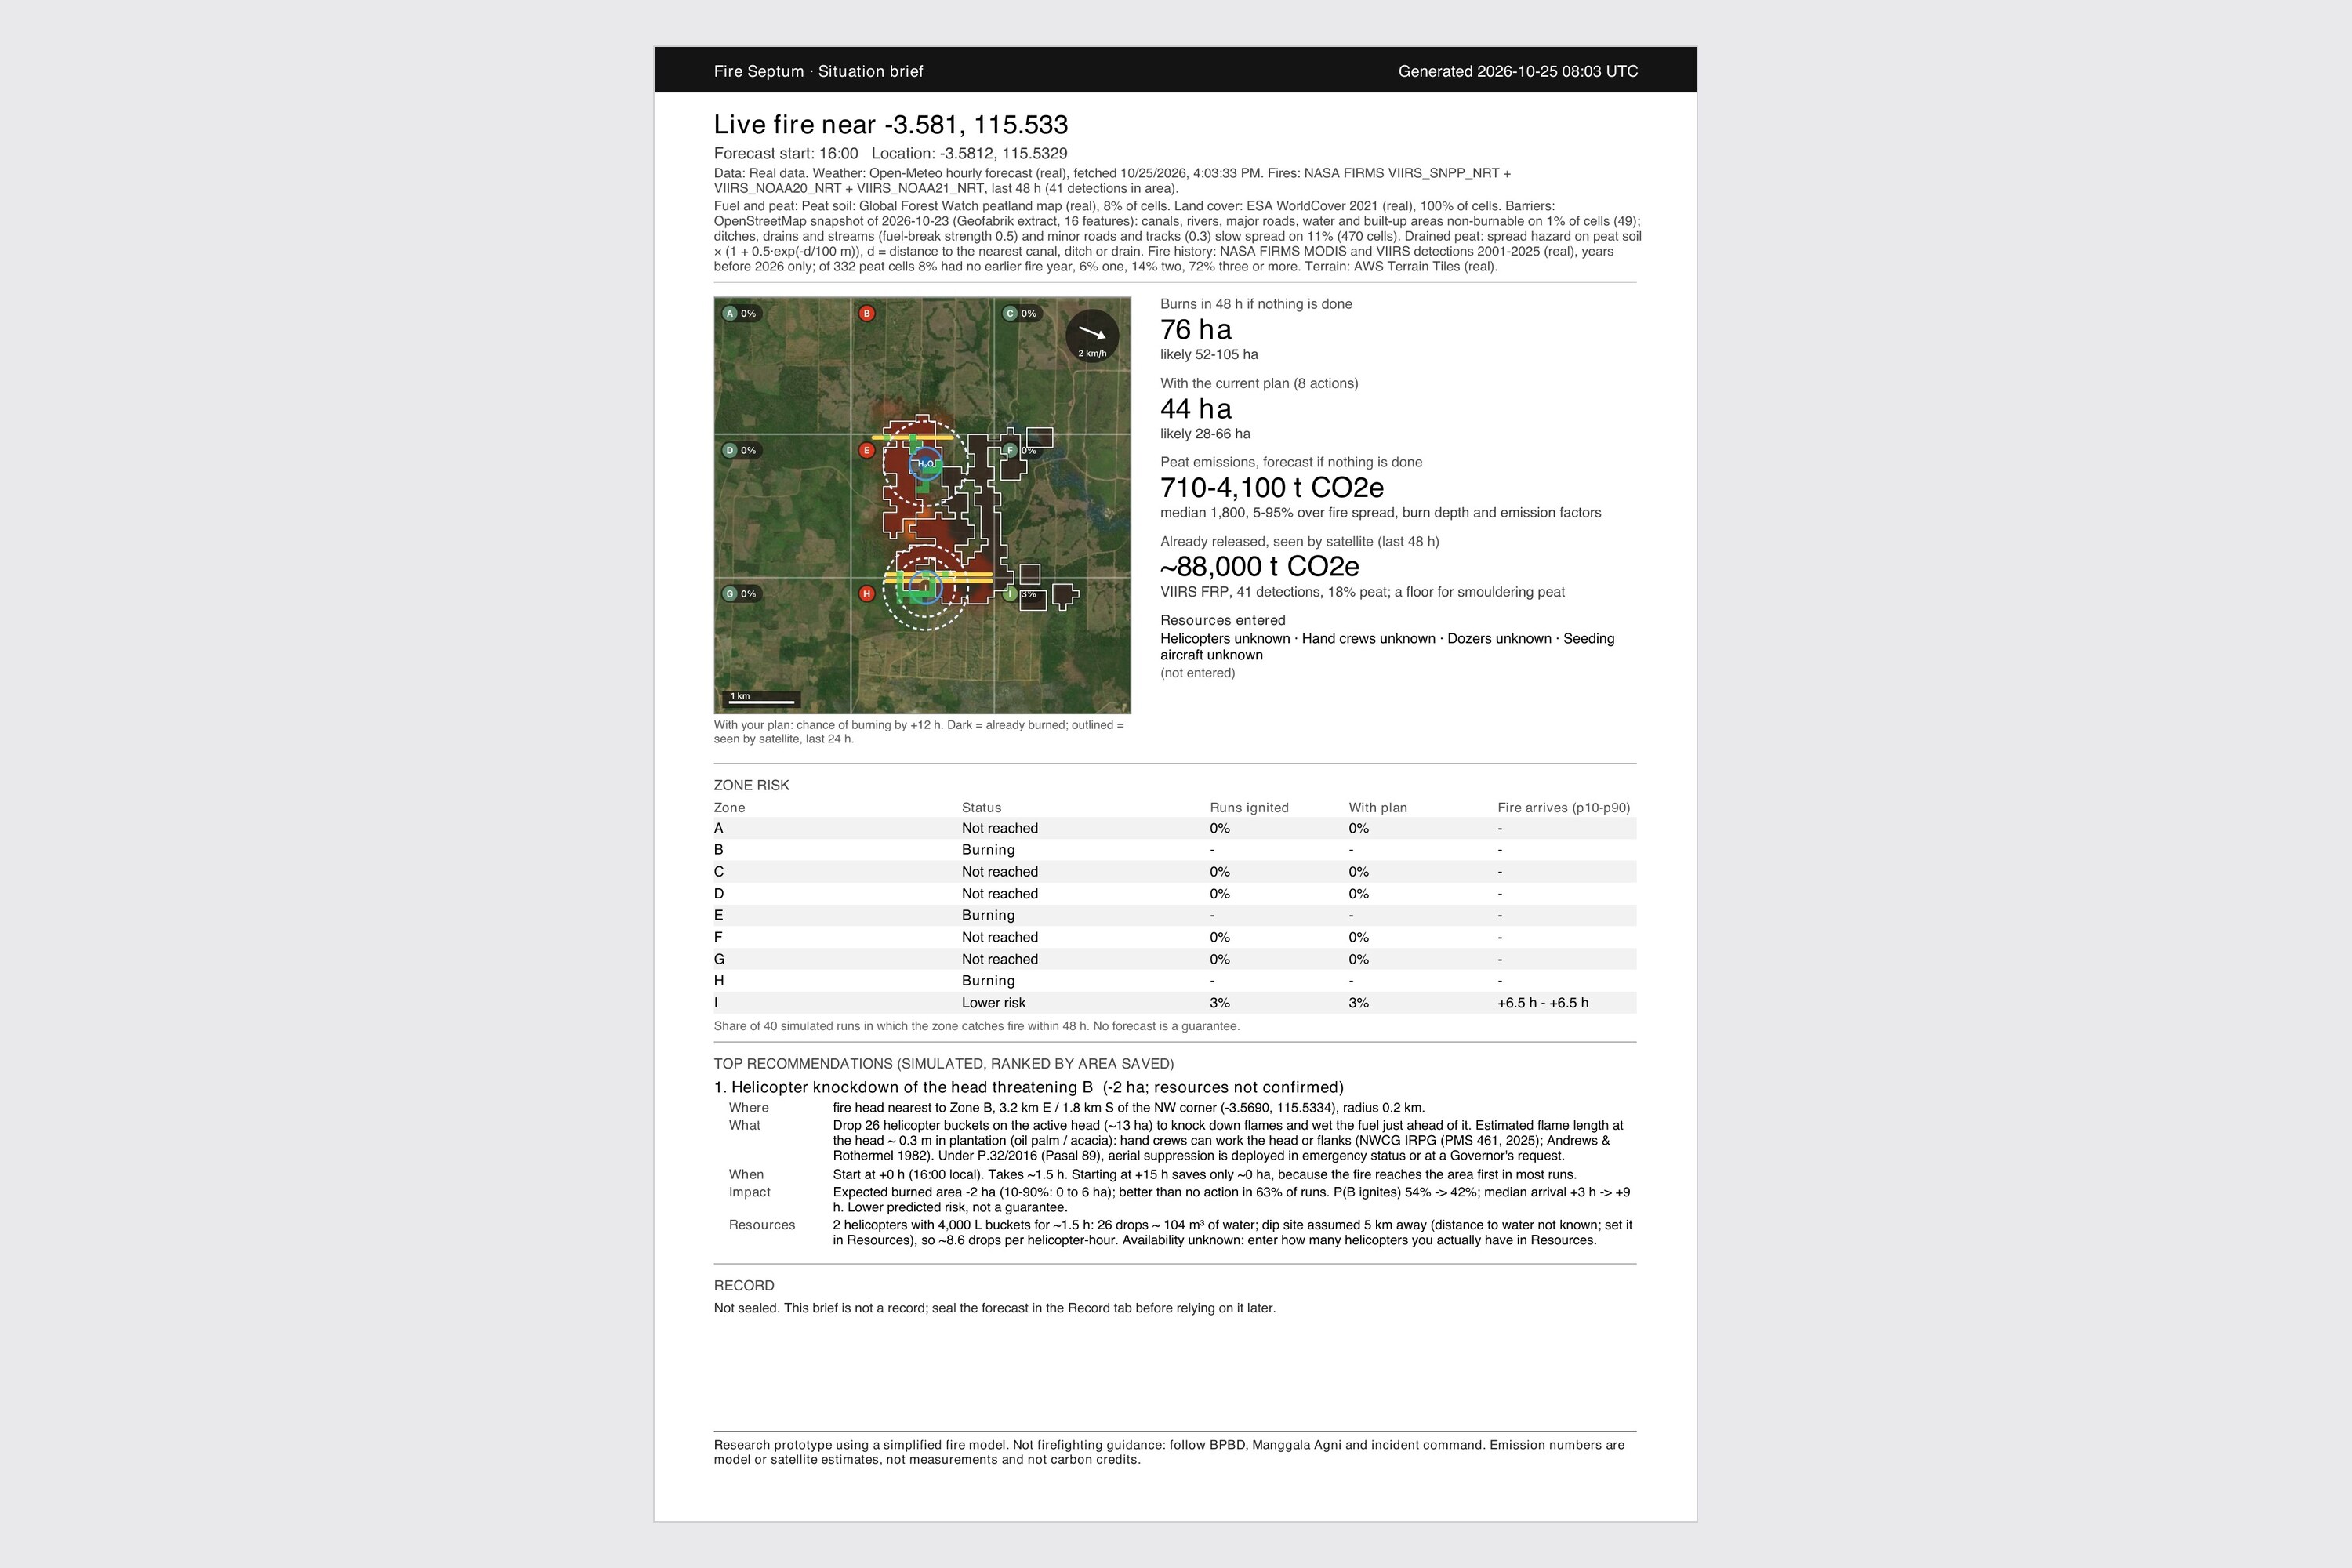
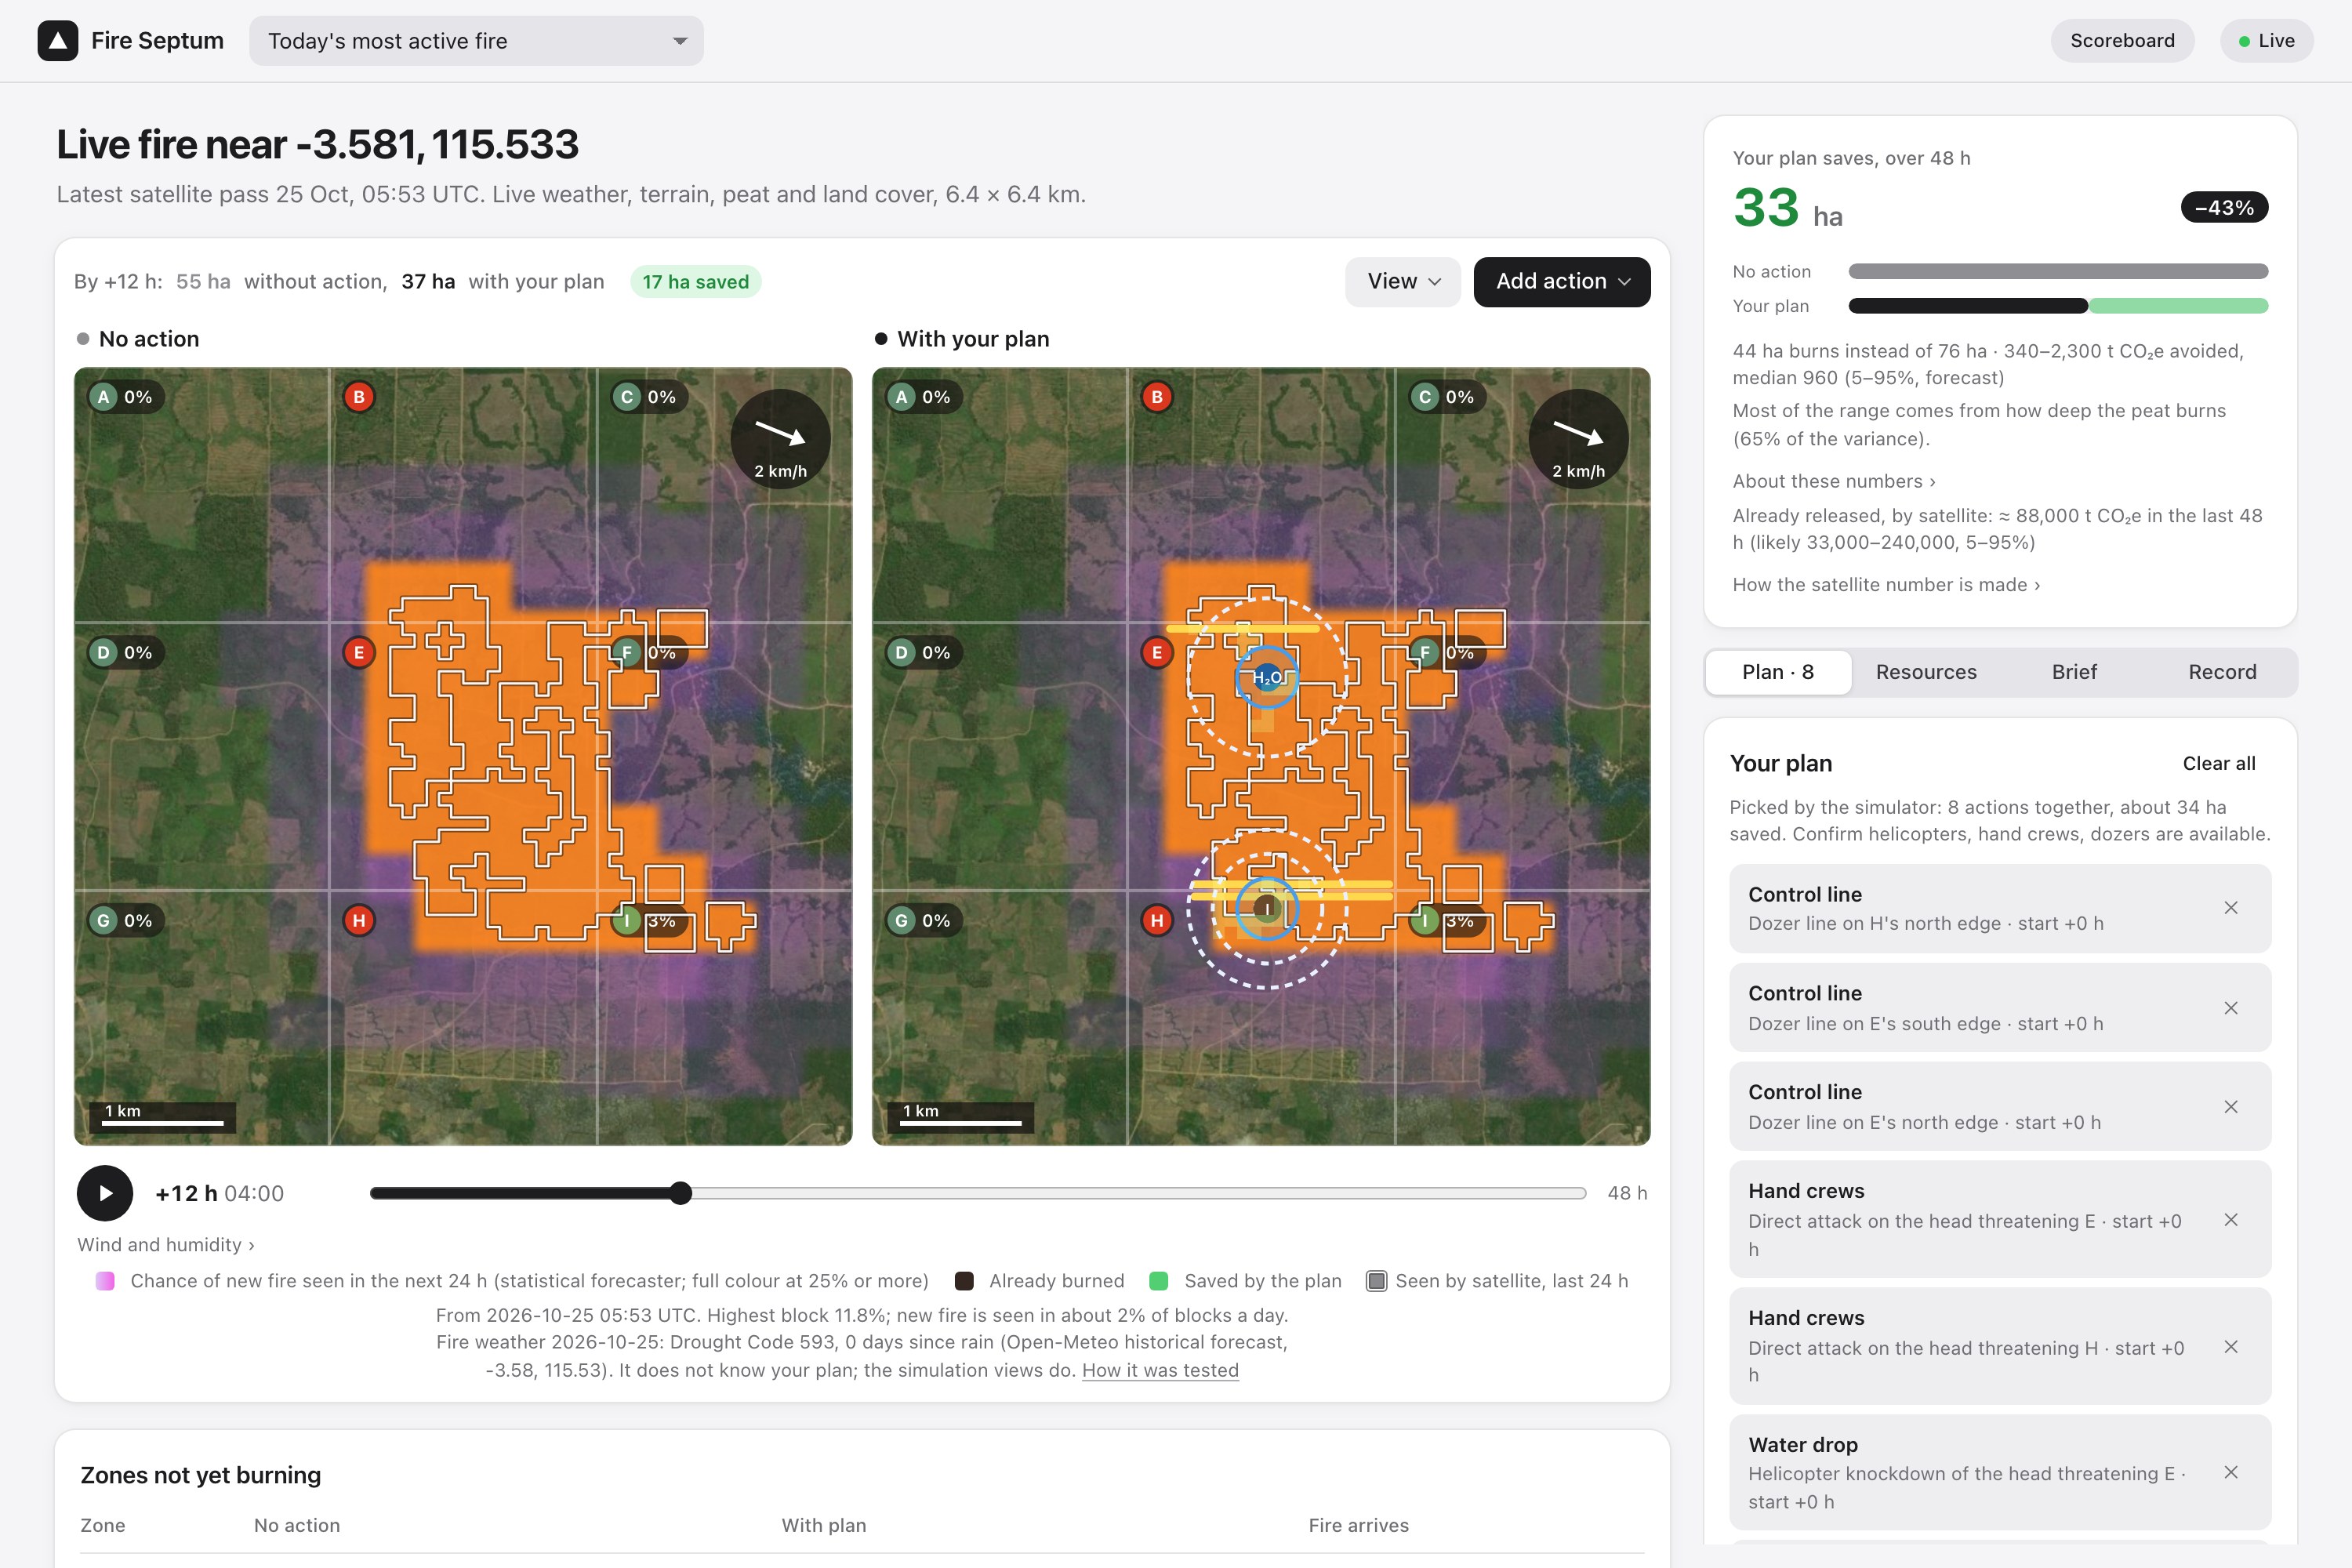
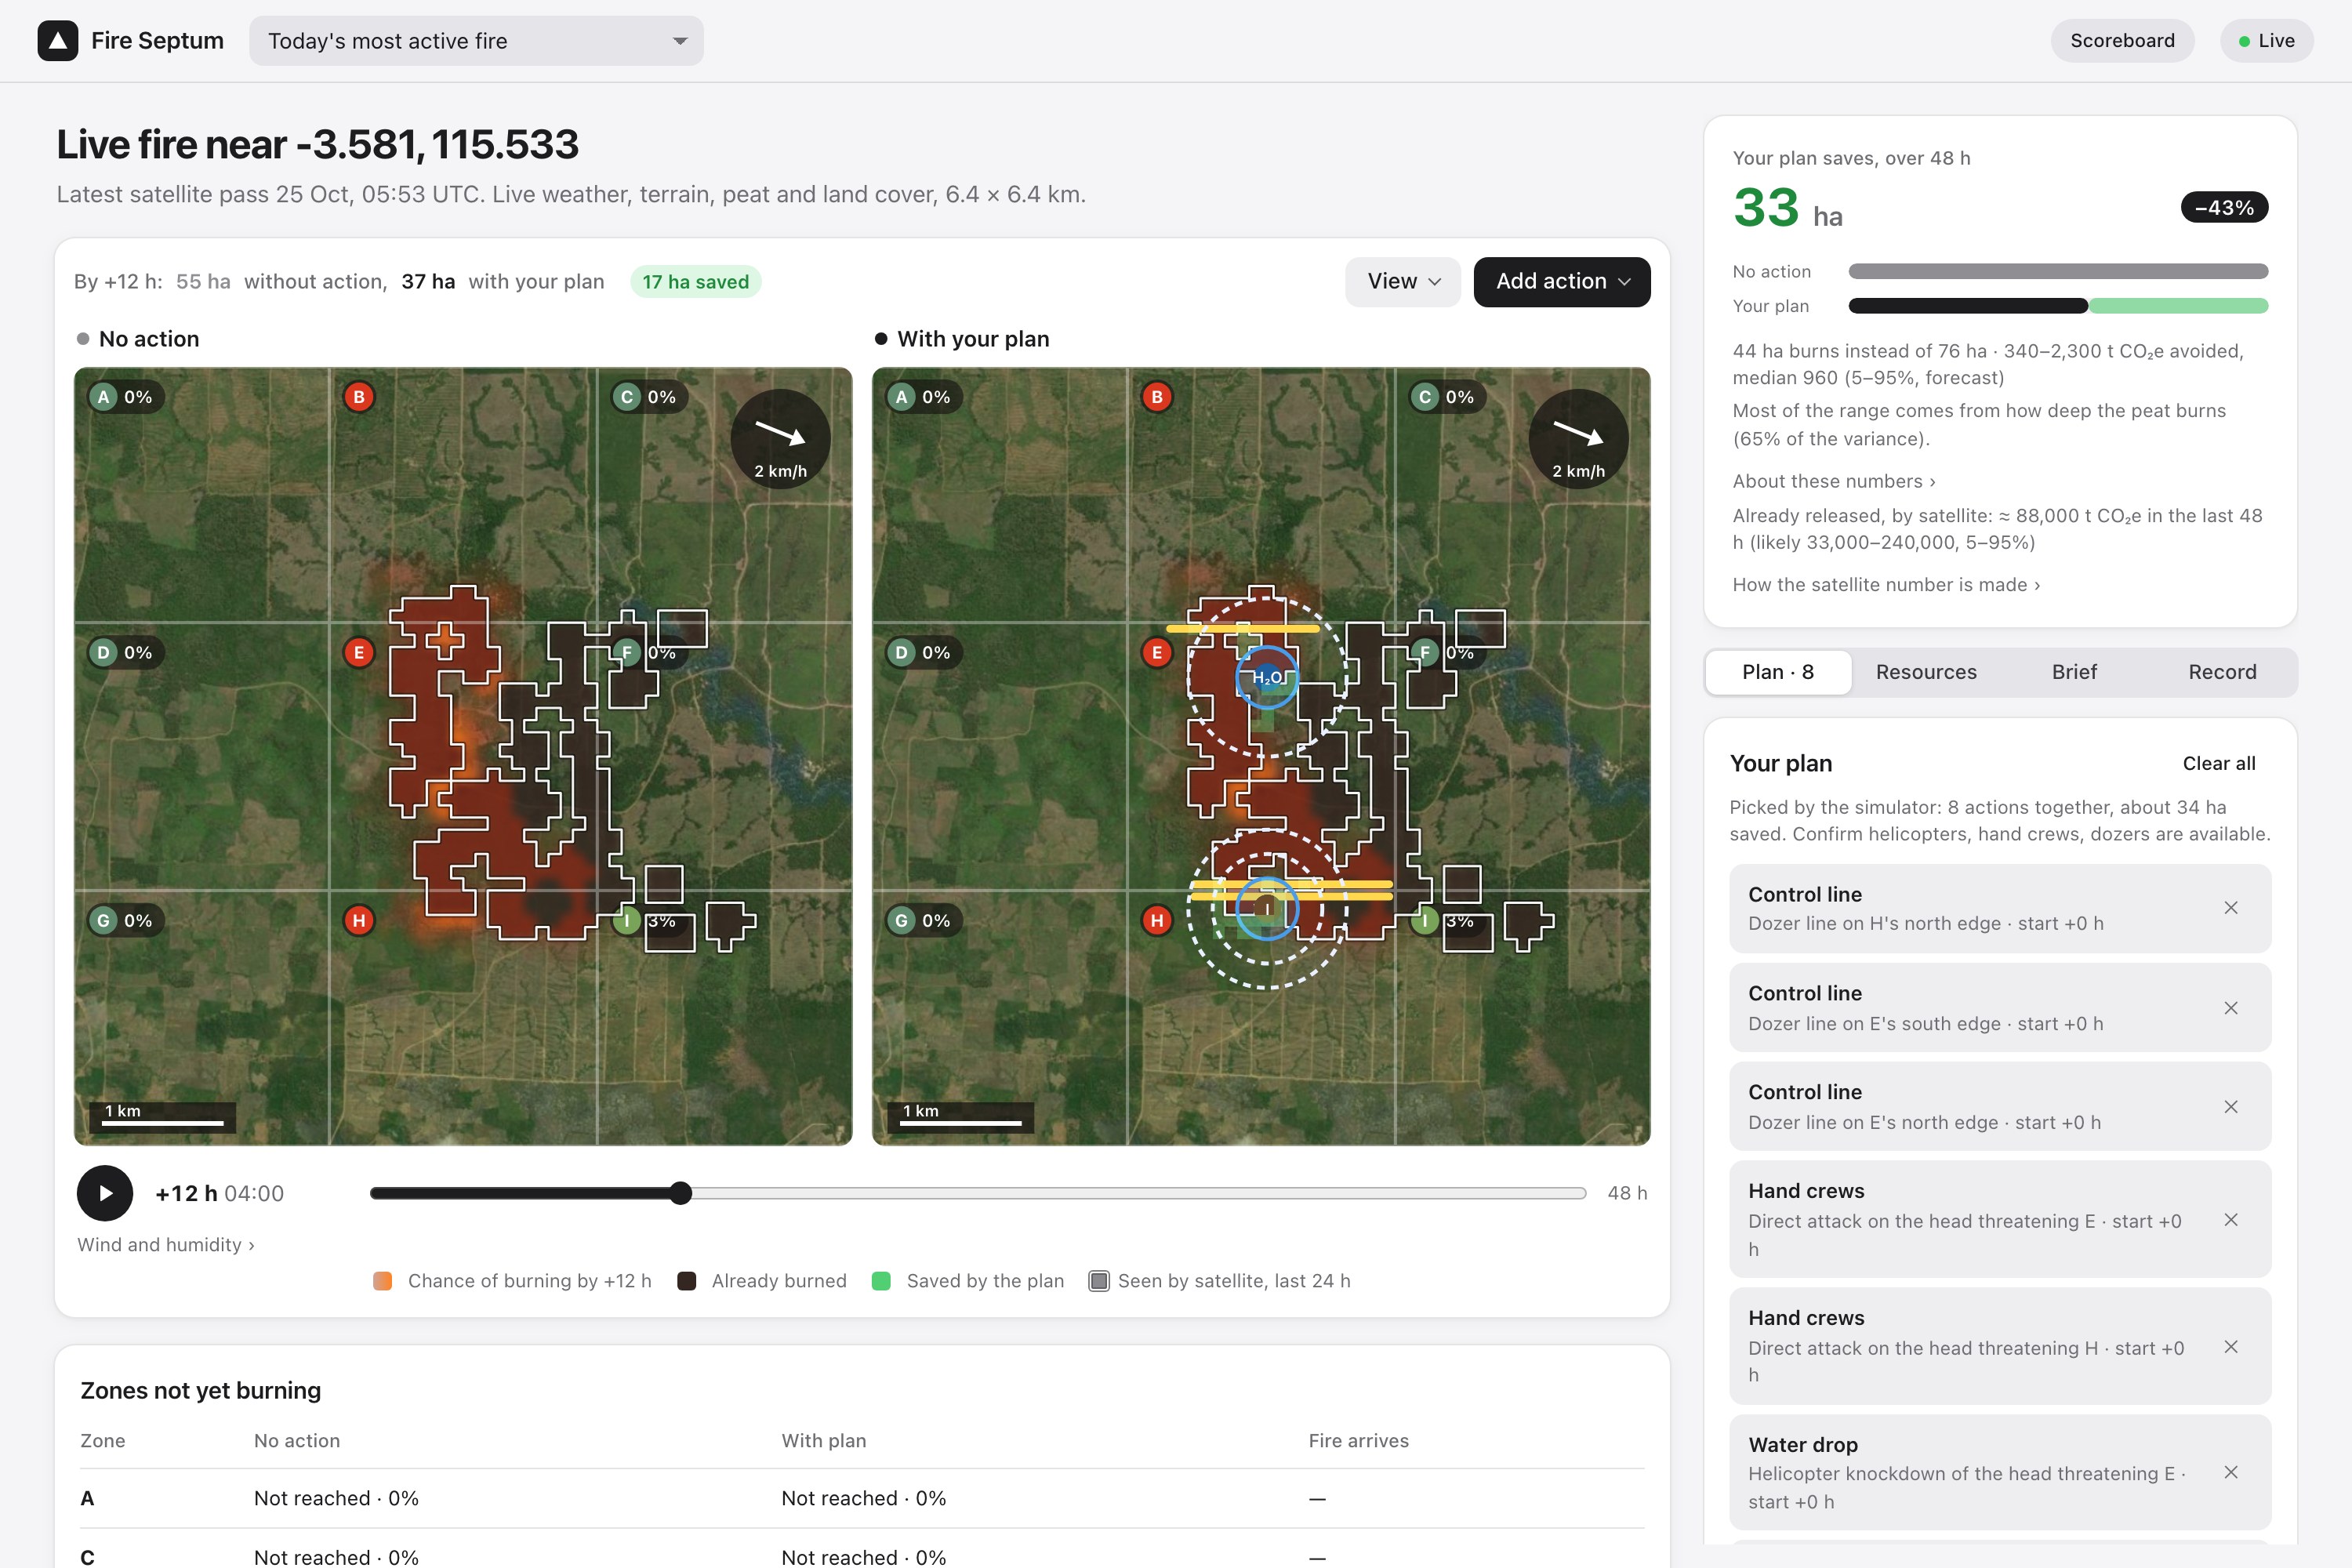
The plan: control lines, helicopter drops and hand crews, ranked by hectares saved across 40 simulated runs.
-
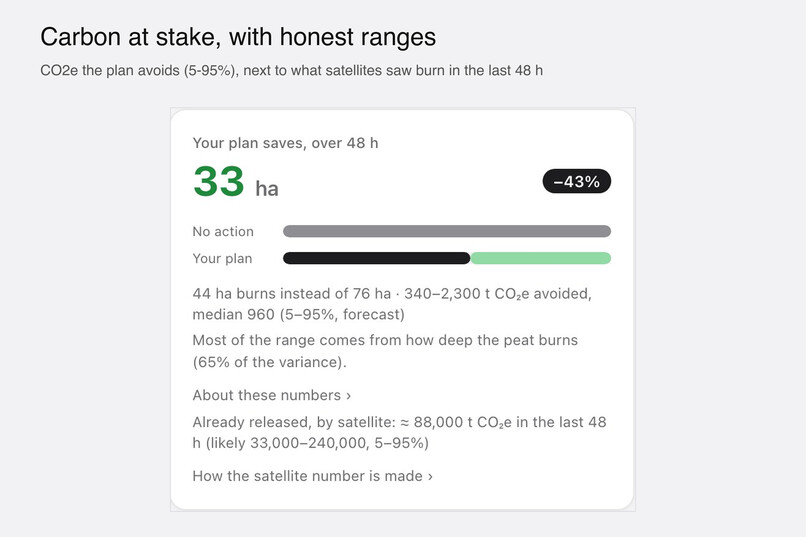
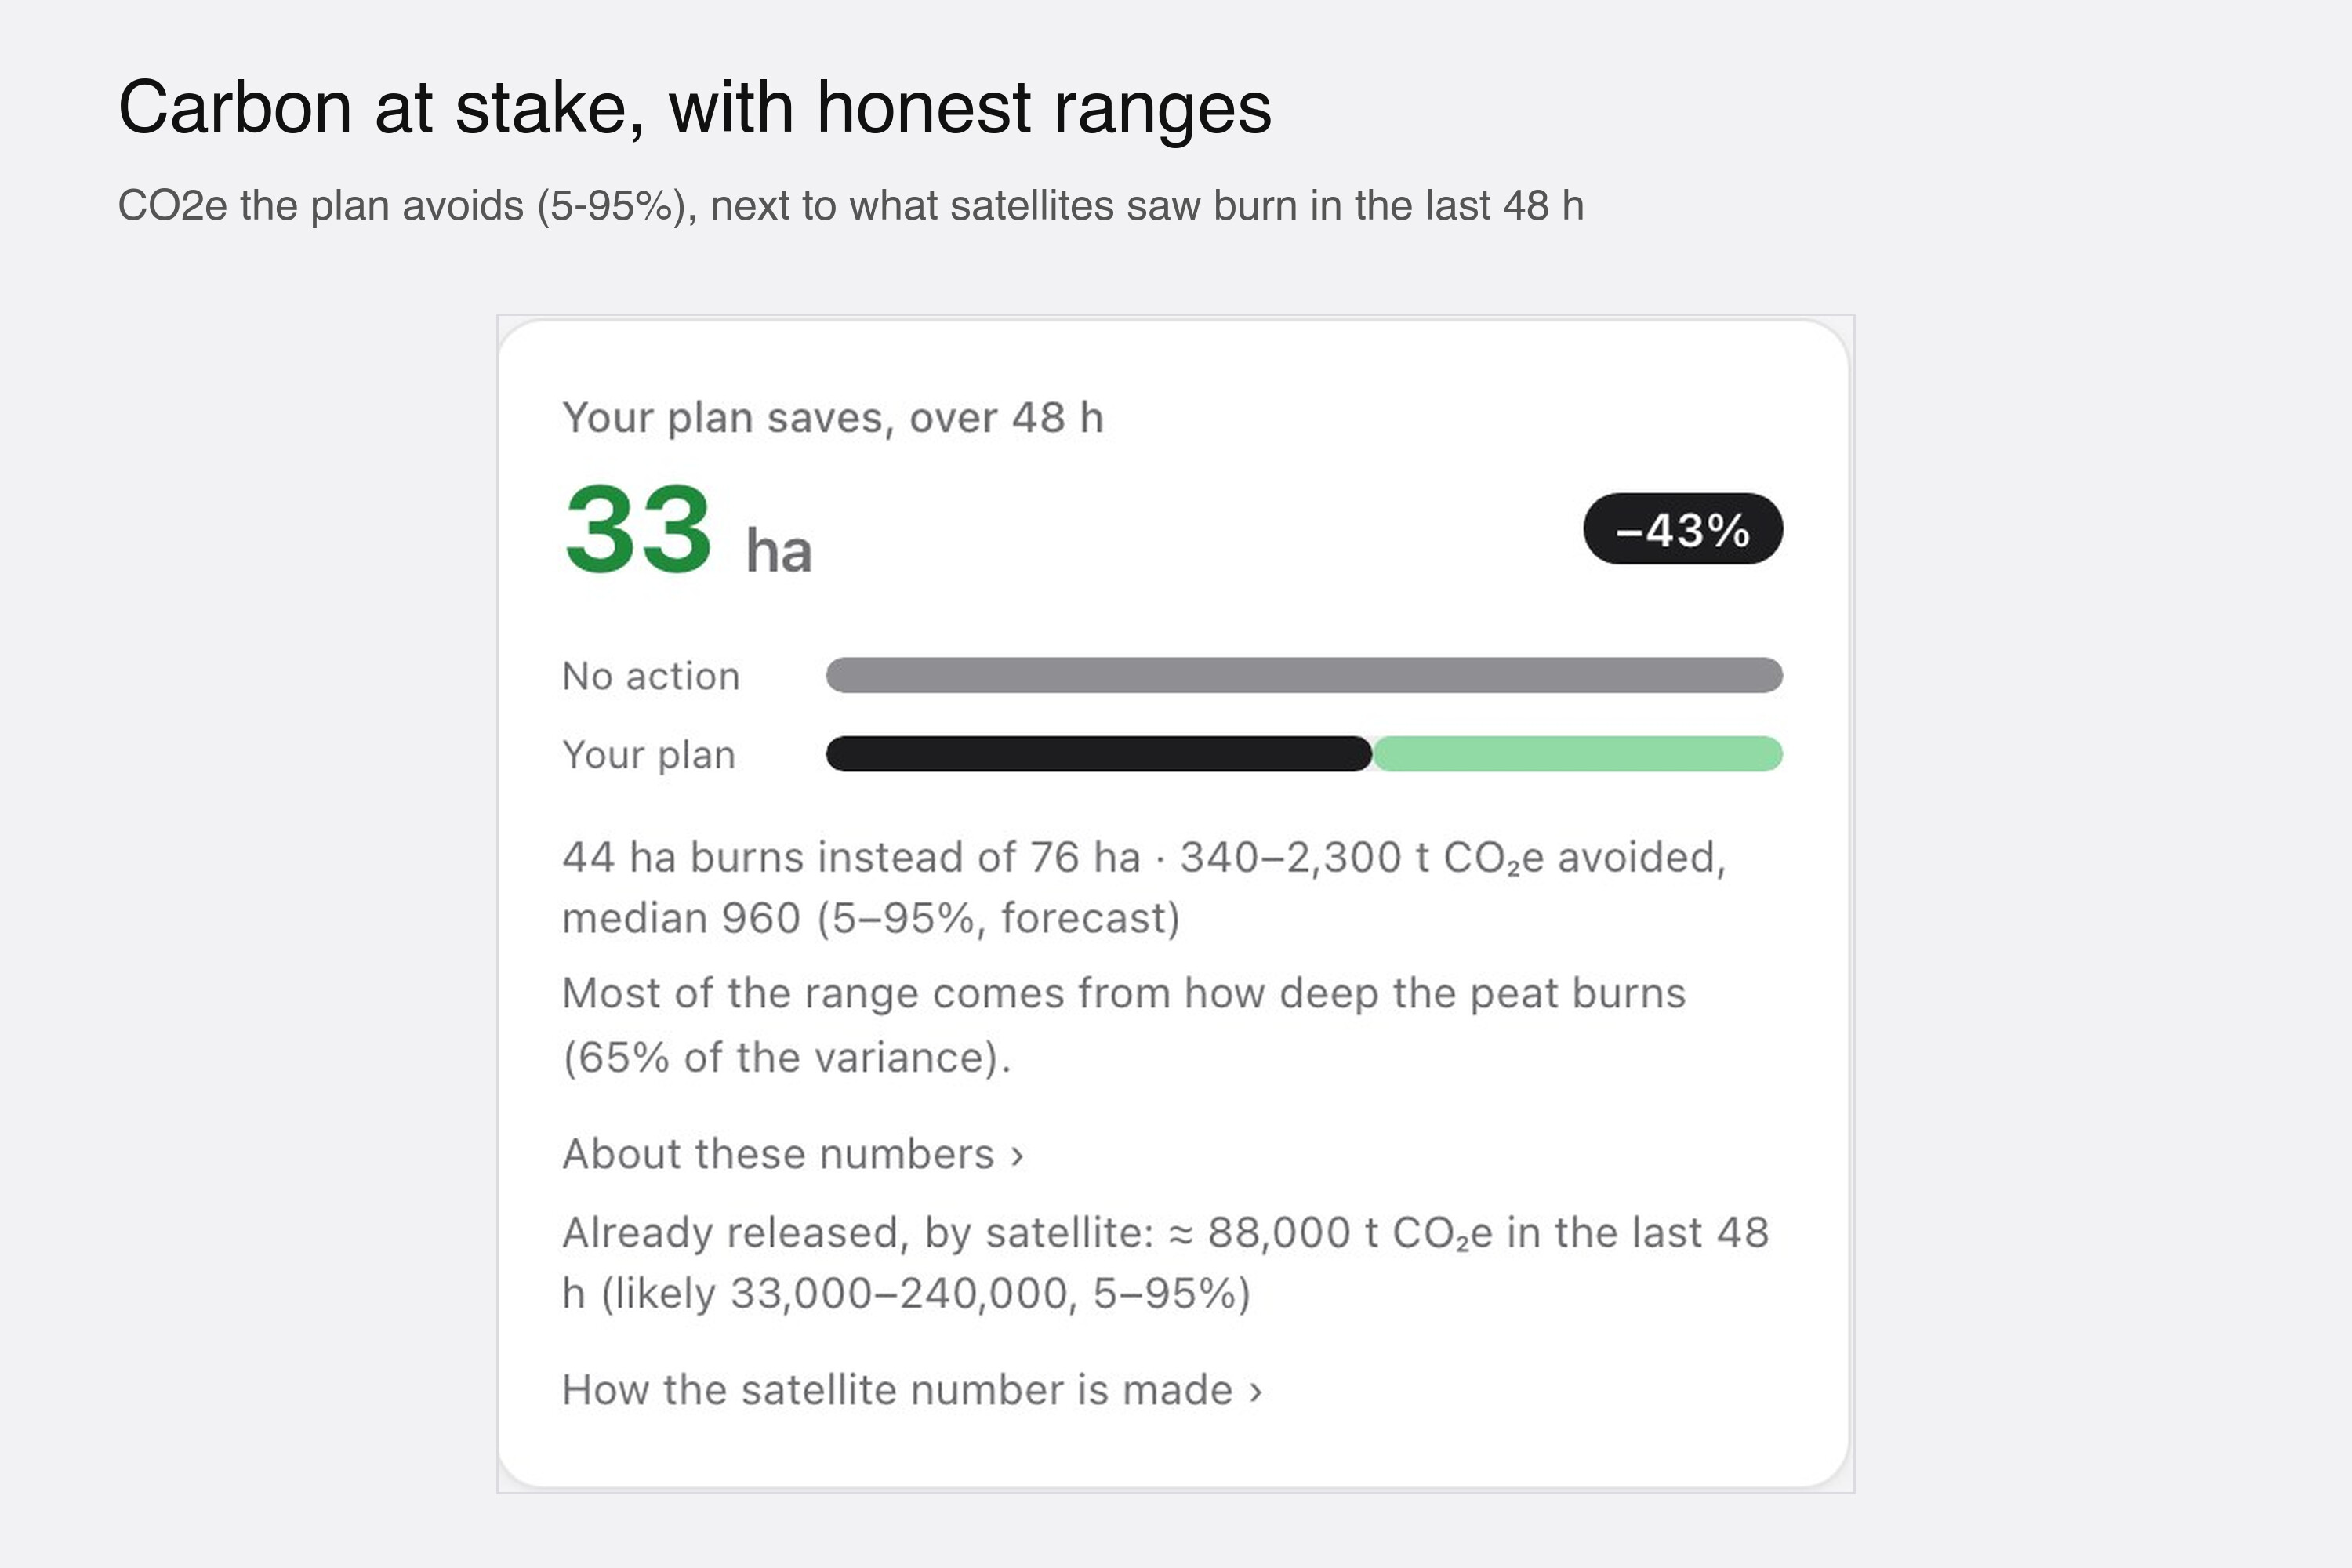
Carbon at stake: CO2e the plan avoids as a 5-95% range, next to what satellites saw burn in the last 48 h.
-
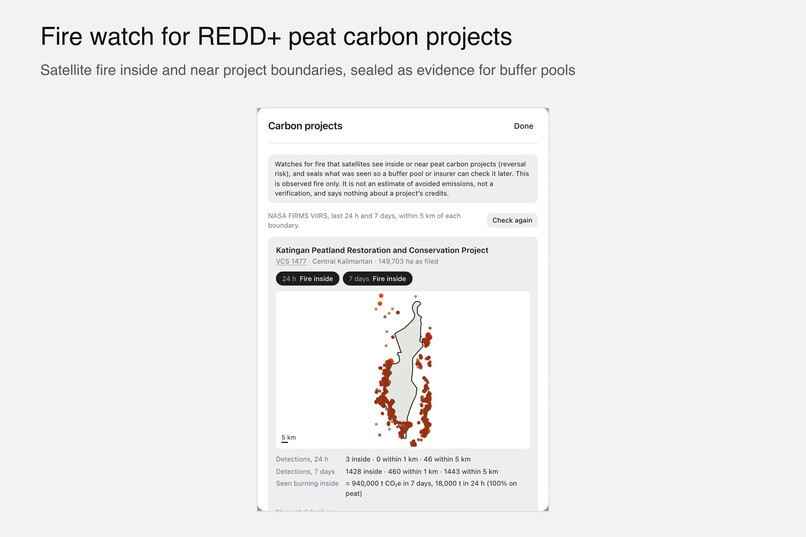
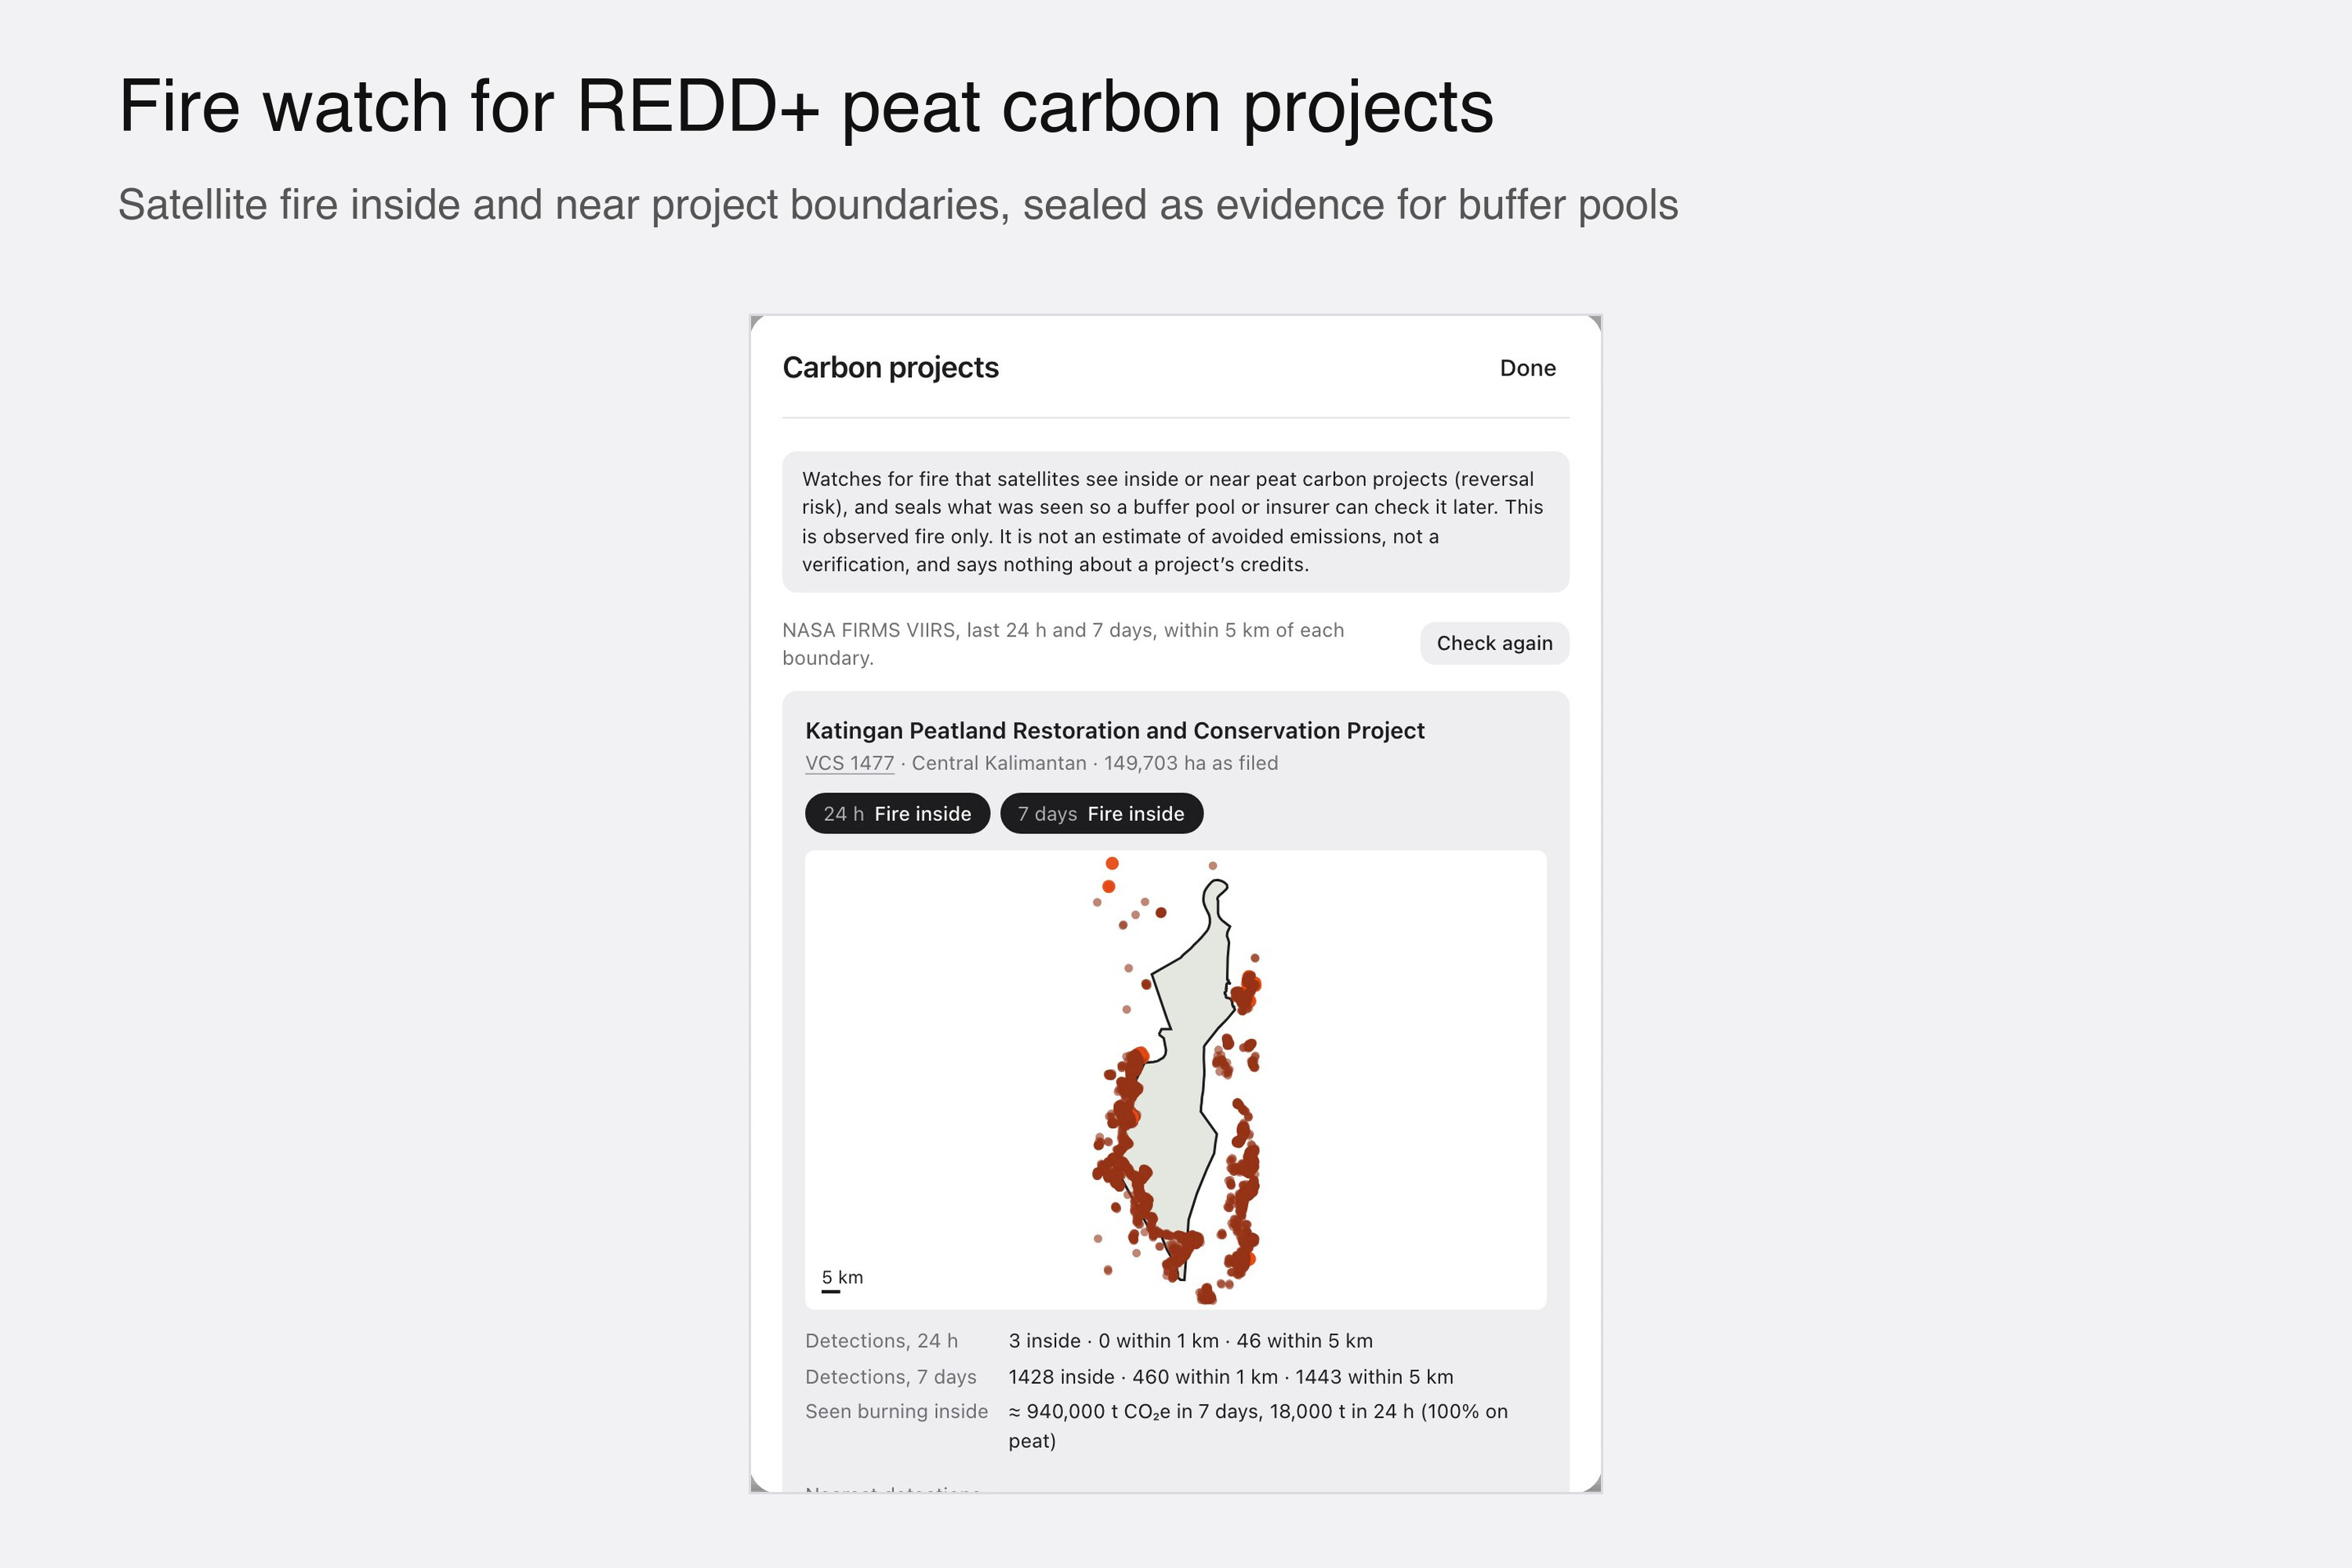
Fire watch for REDD+ peat carbon projects: satellite fire inside and near the boundary, sealed as evidence.
-
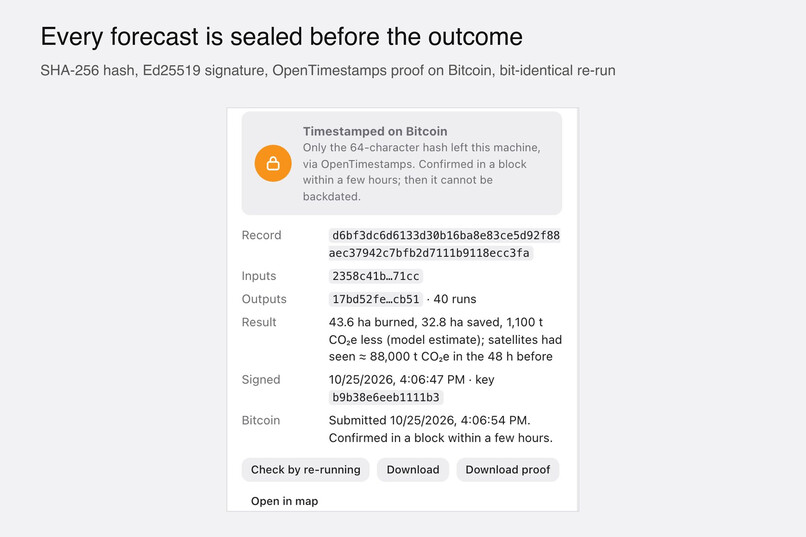
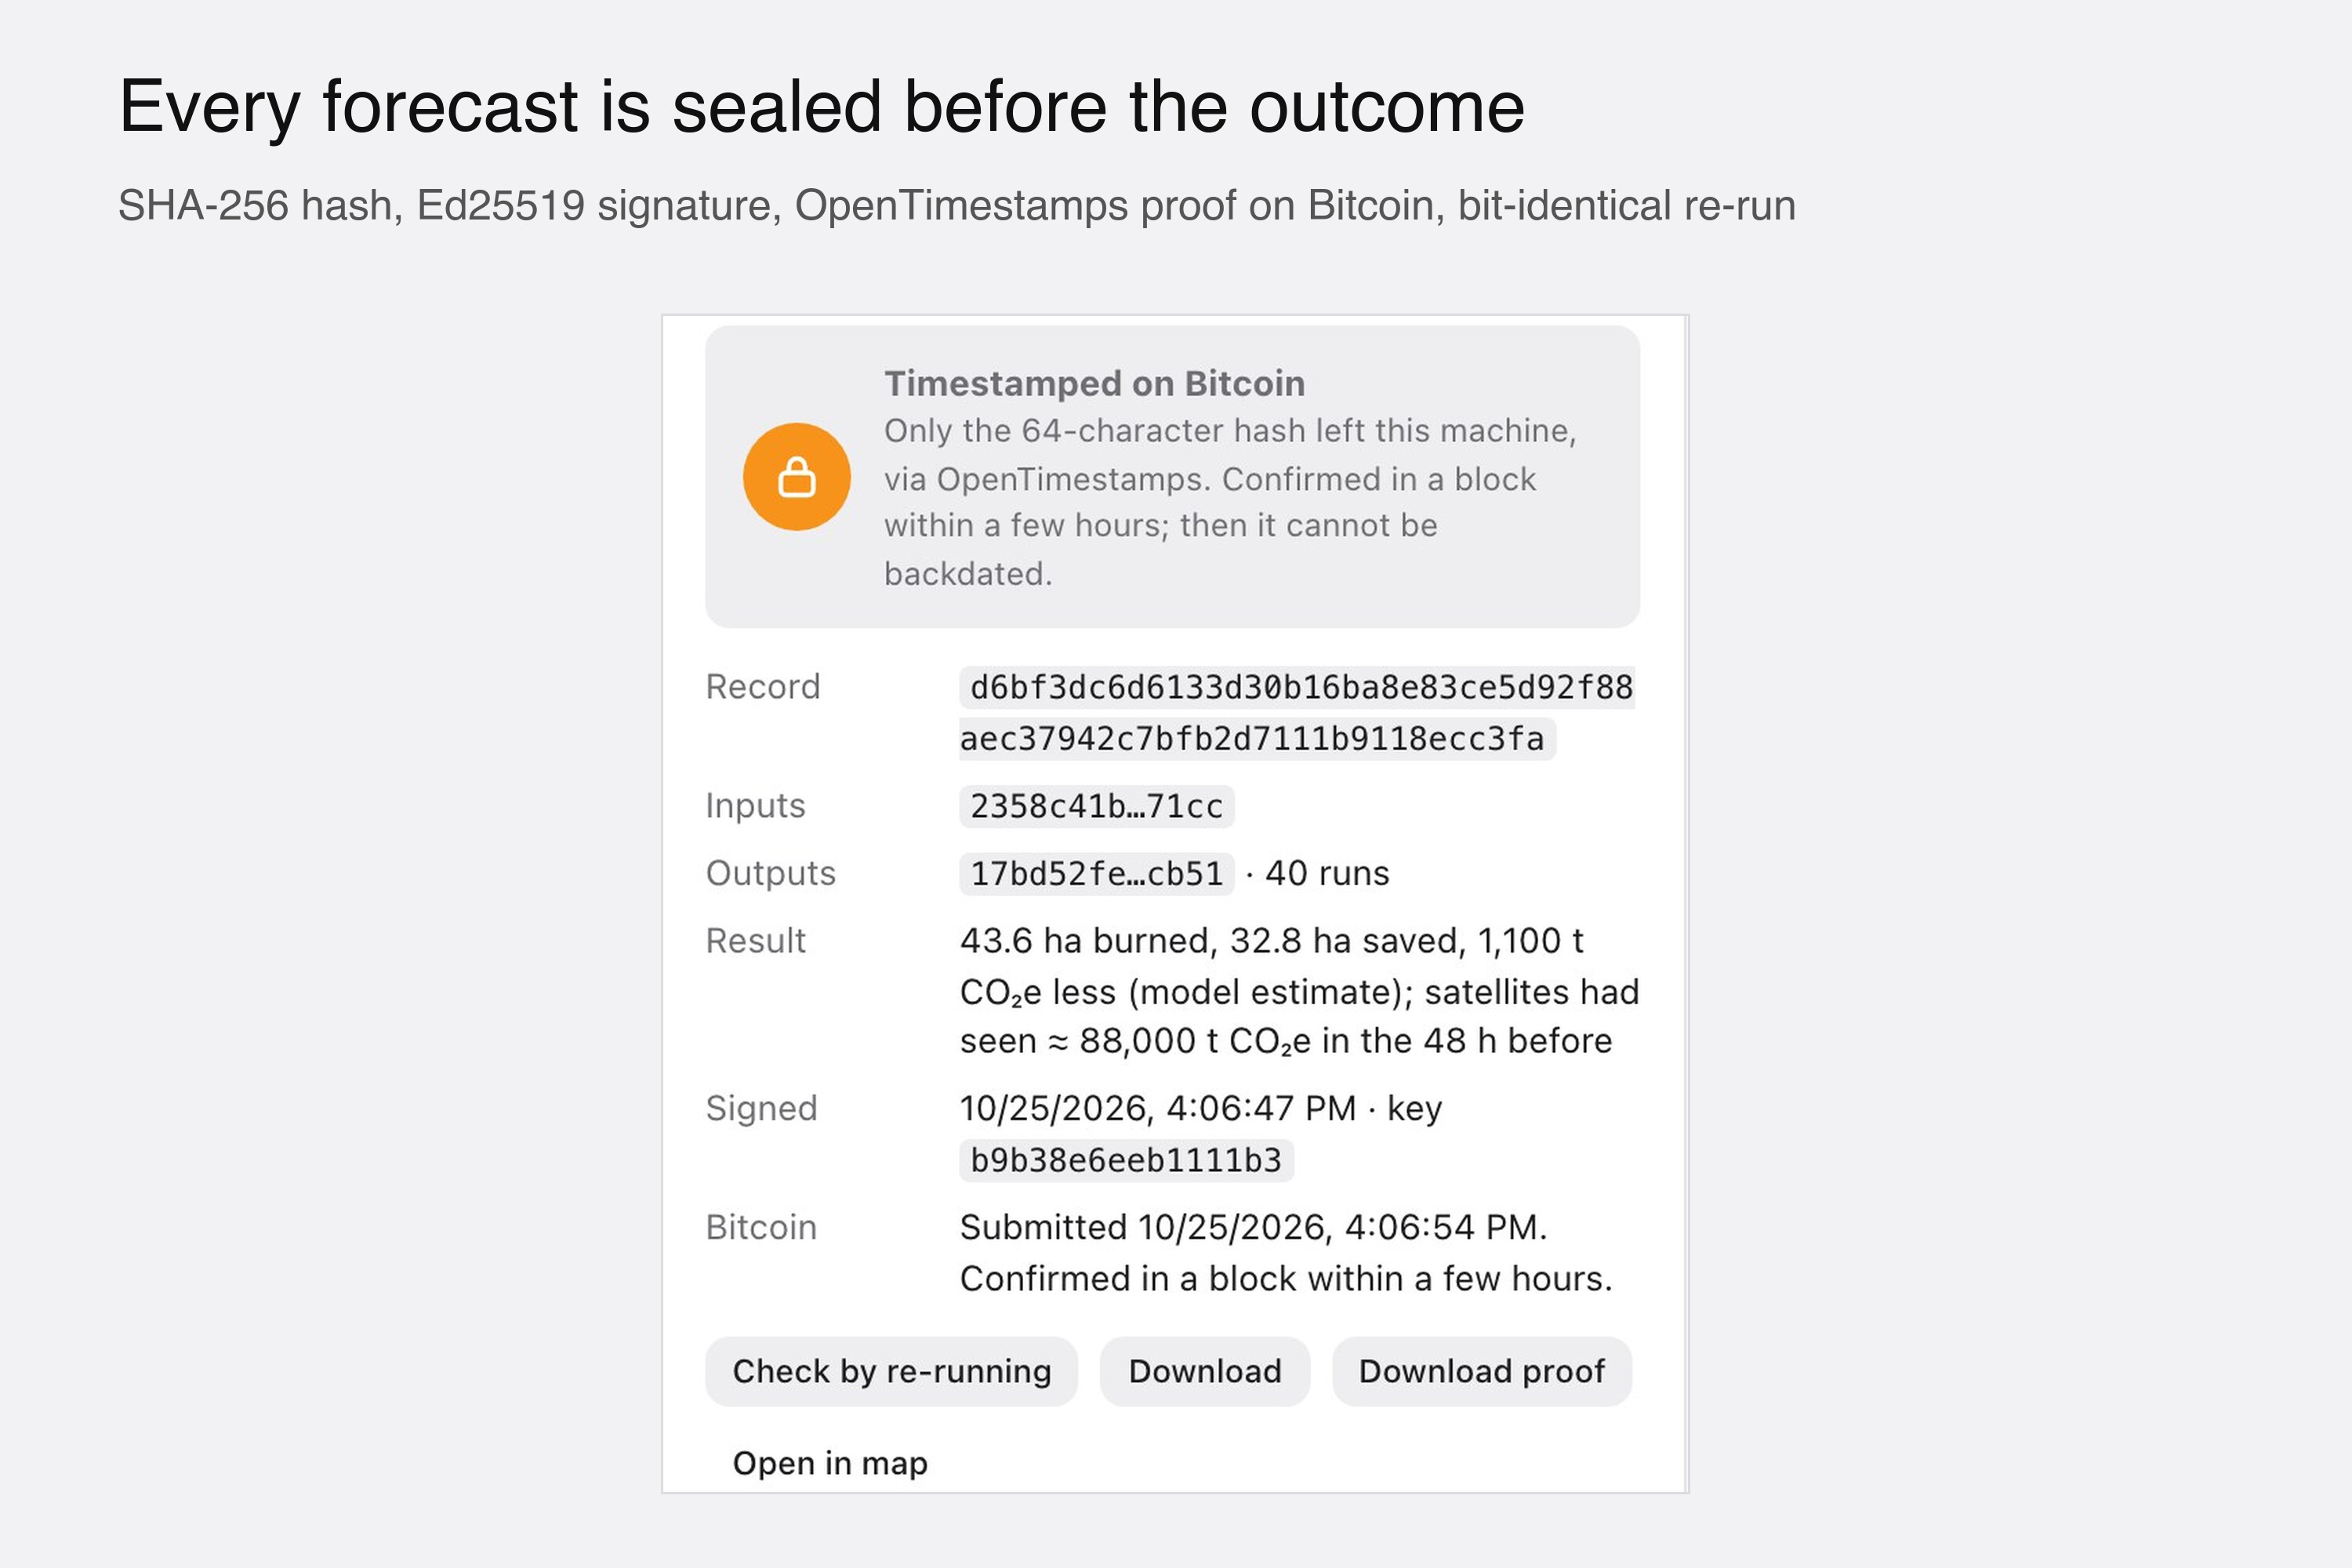
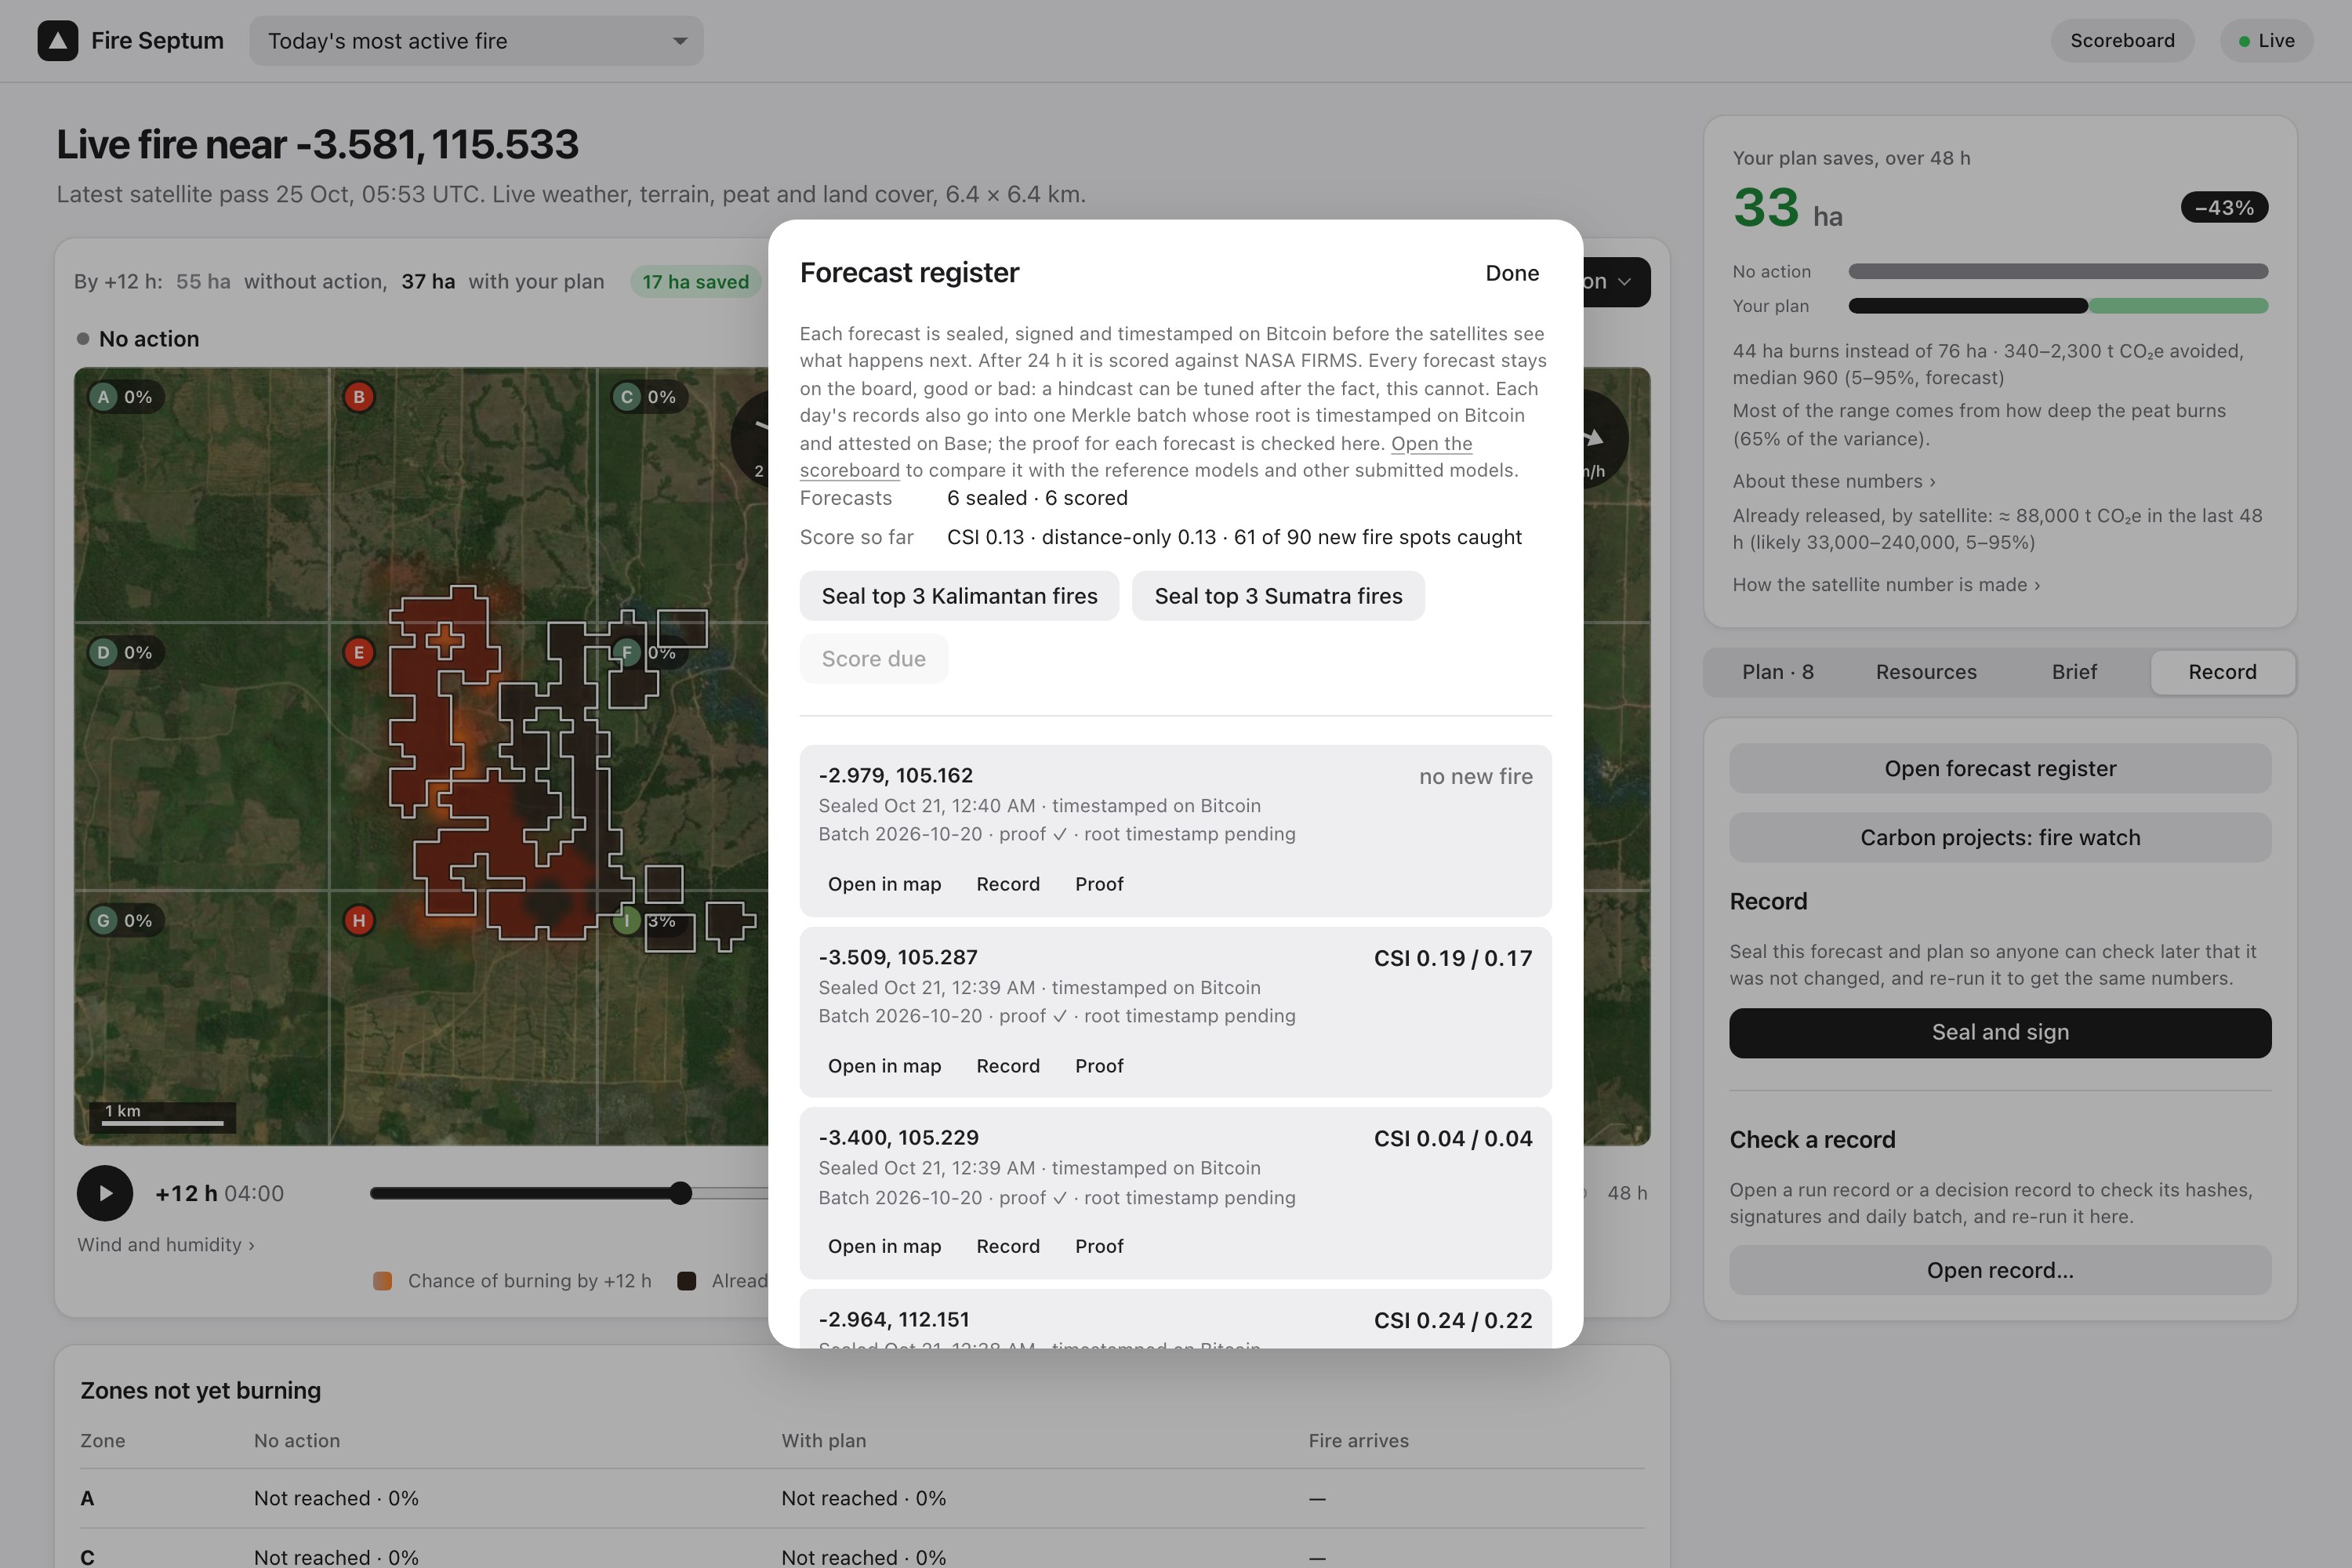
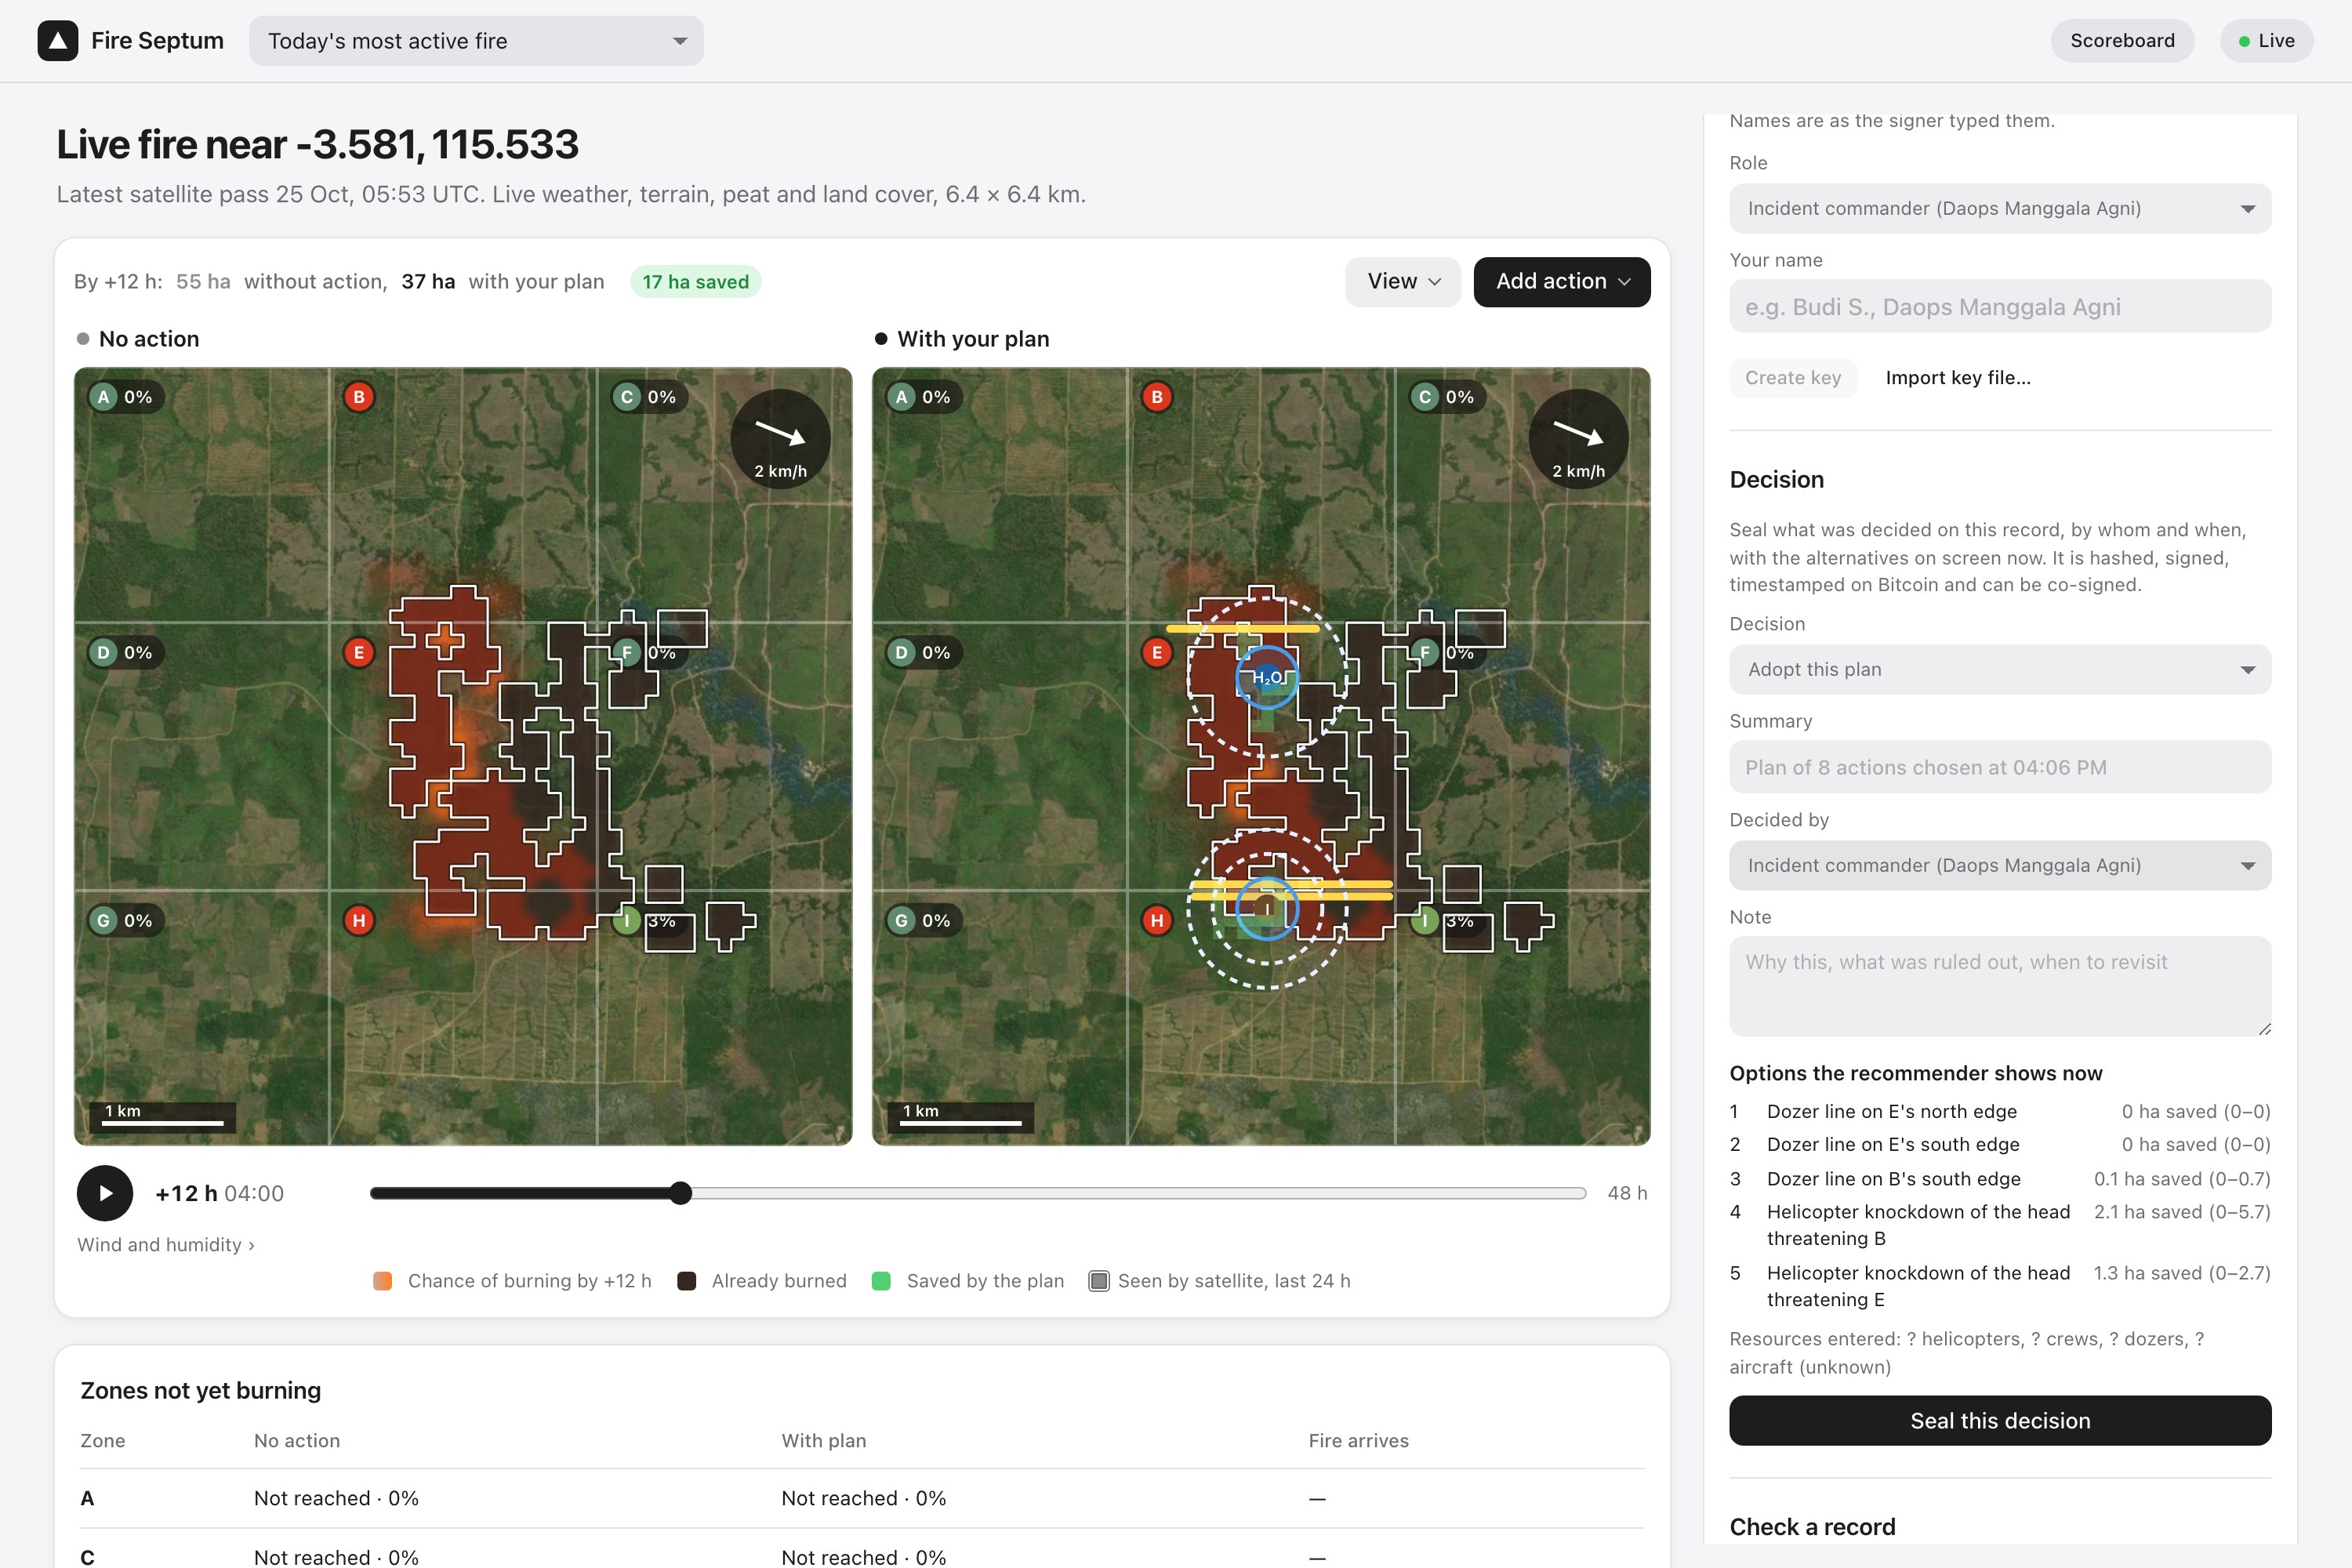
Sealed before the outcome: hashed, signed and timestamped on Bitcoin, so the forecast cannot be changed later.
-
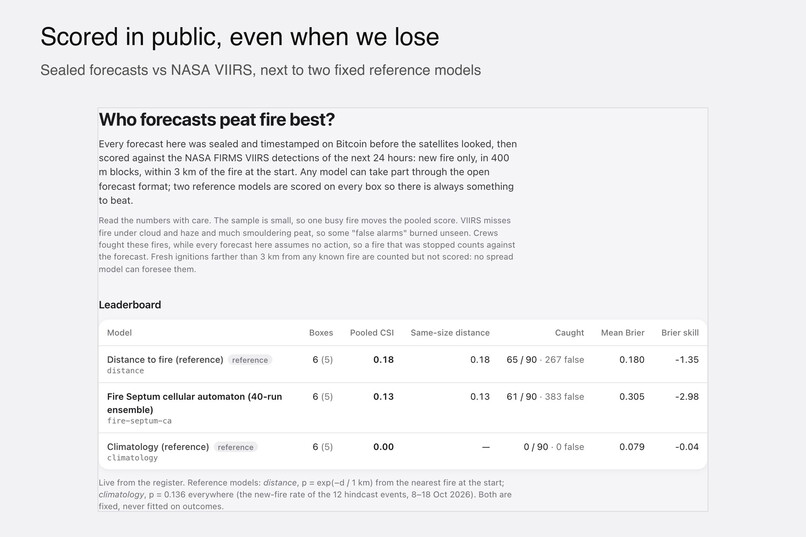
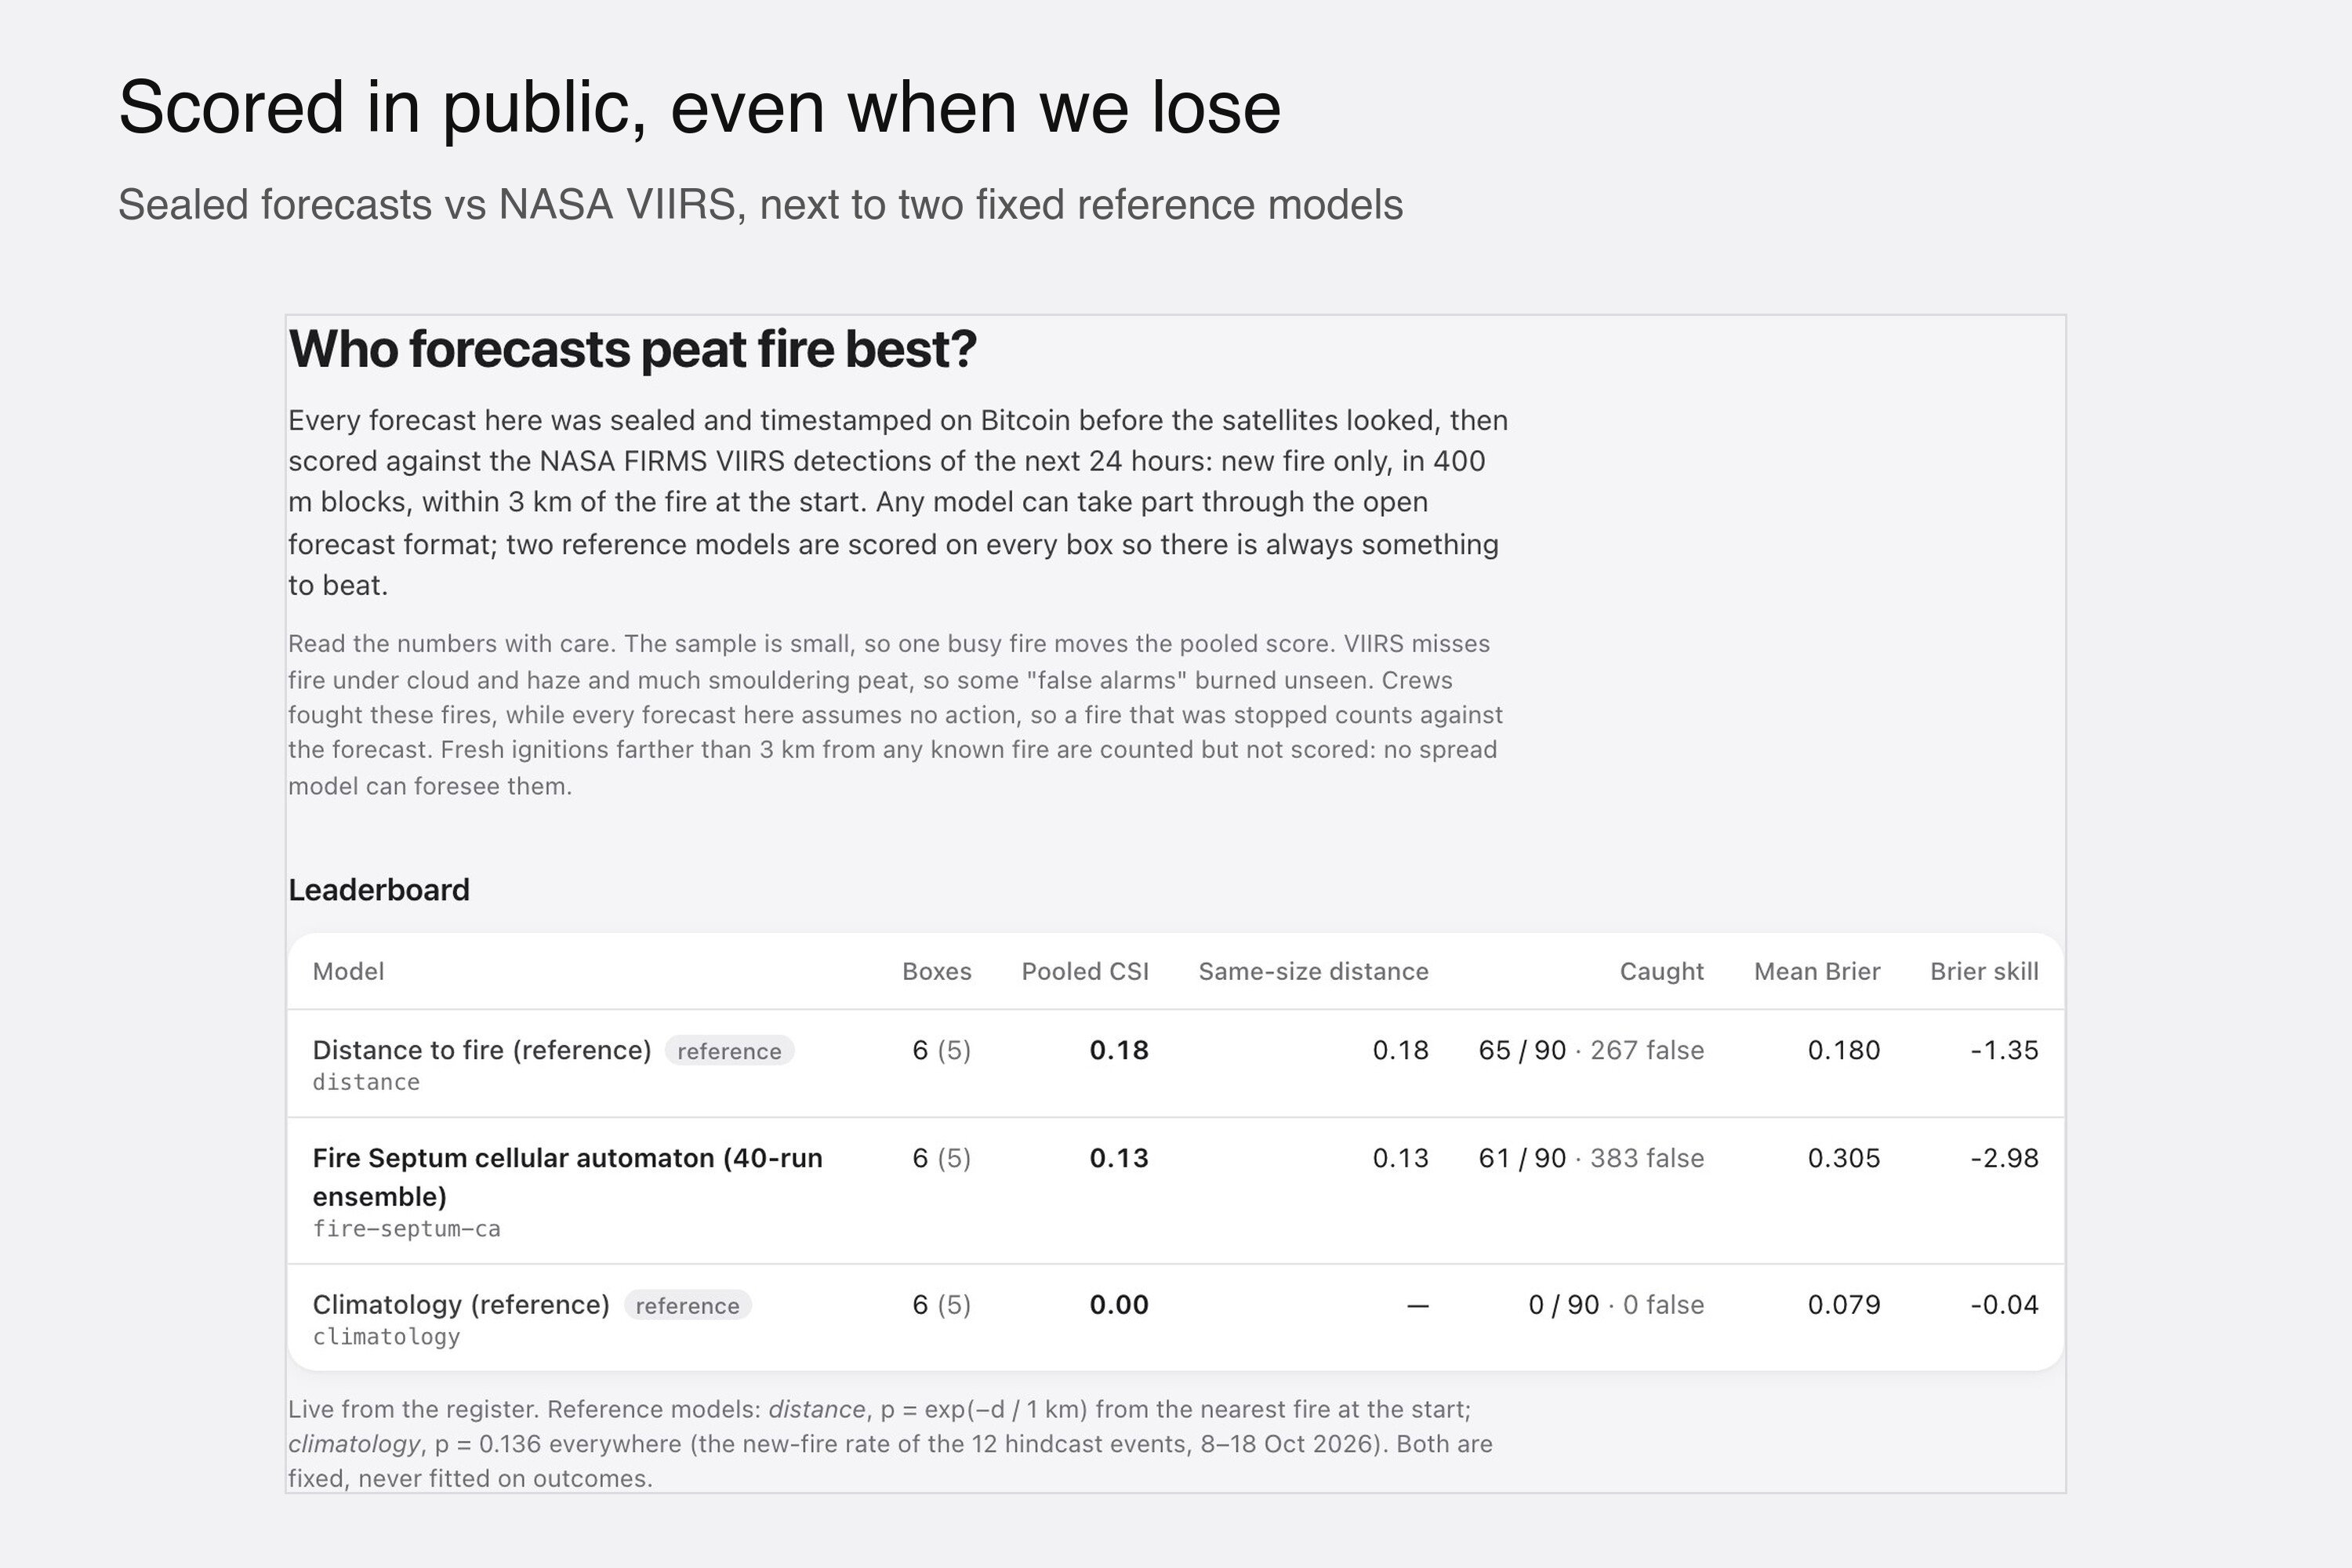
Public scoreboard: our model next to two fixed reference models, even where it scores lower.
-
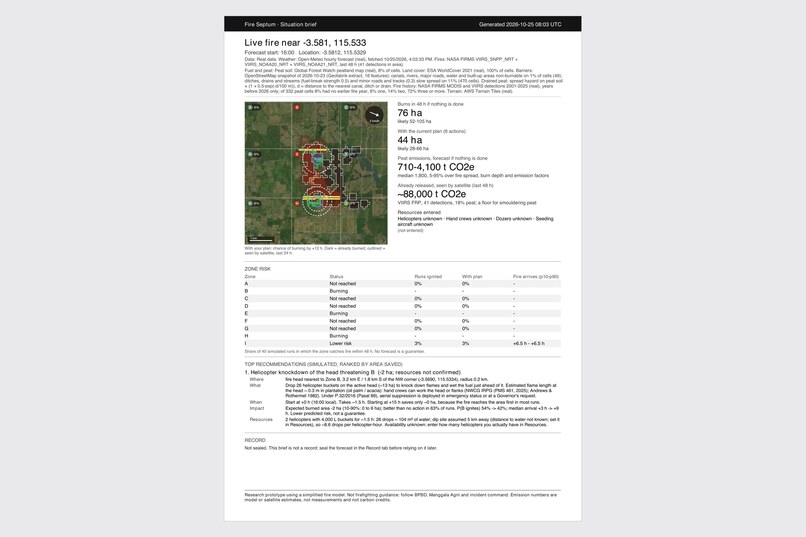
One-page PDF brief for commanders (Bahasa Indonesia or English): map, zone risk, emissions and top actions.
-
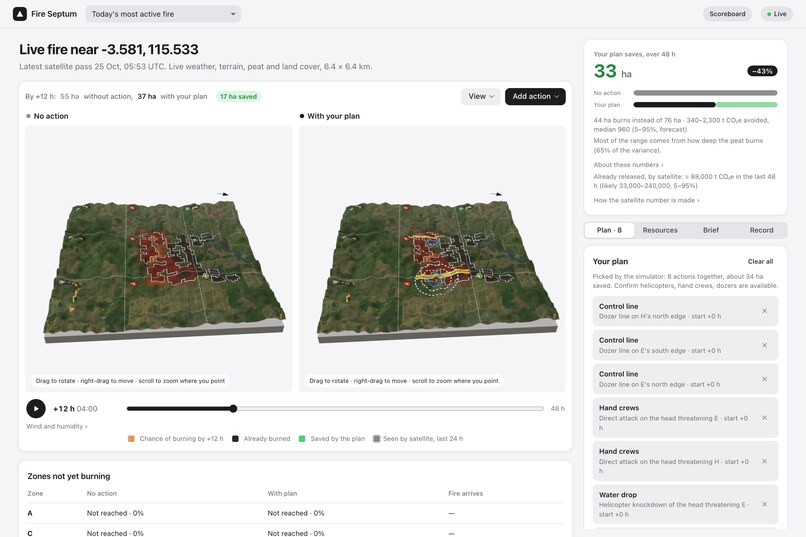
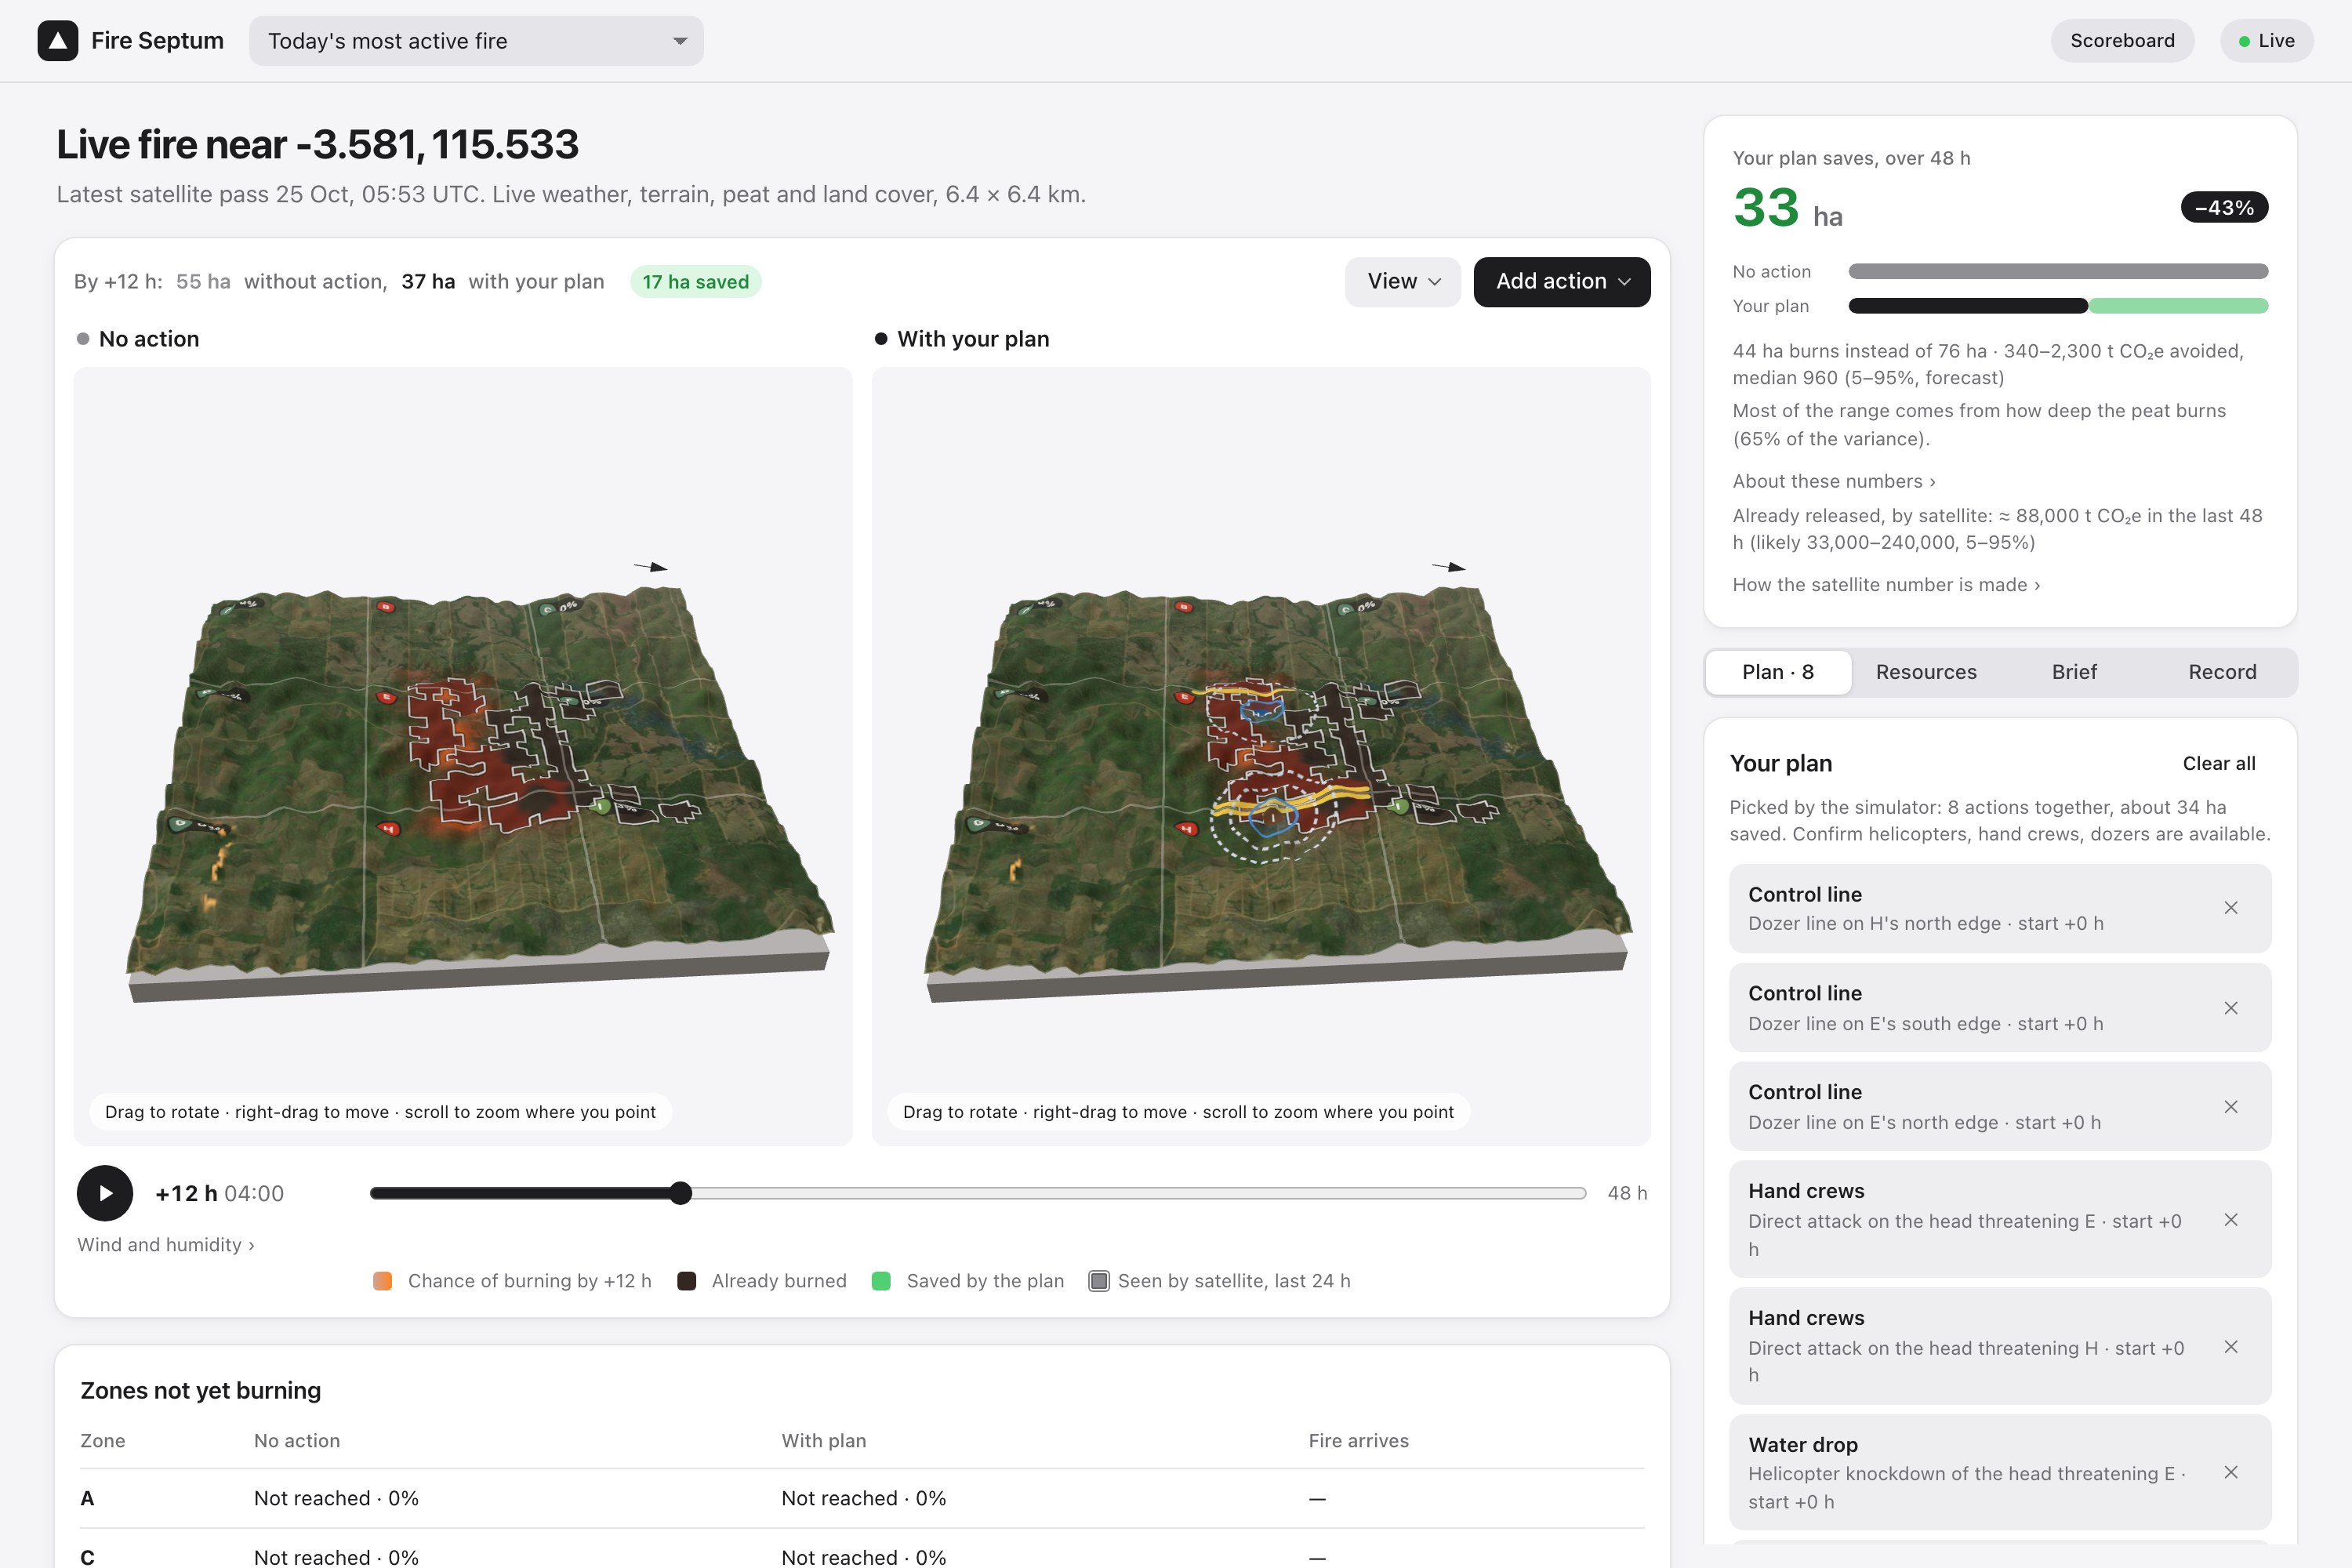
The same forecast on 3D terrain built from real elevation data and satellite imagery.
-
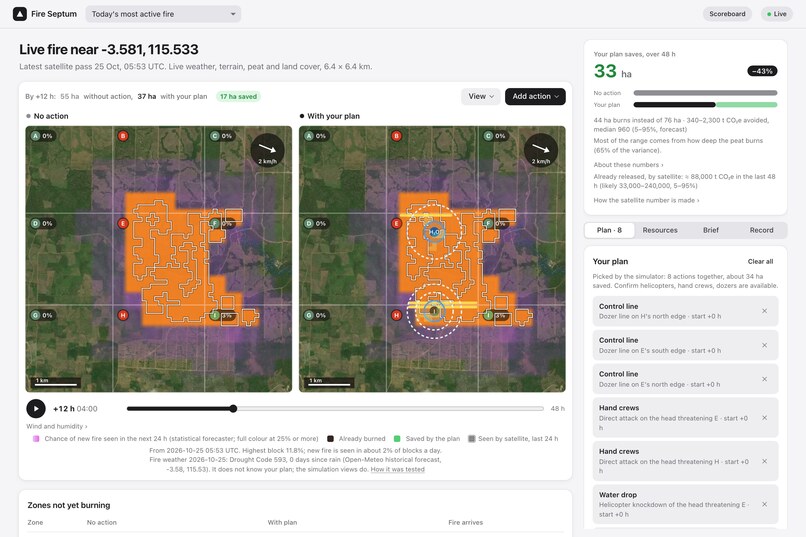
Tomorrow view: chance of new fire in every 400 m block in the next 24 h, from a model tested on fires it never saw.
-
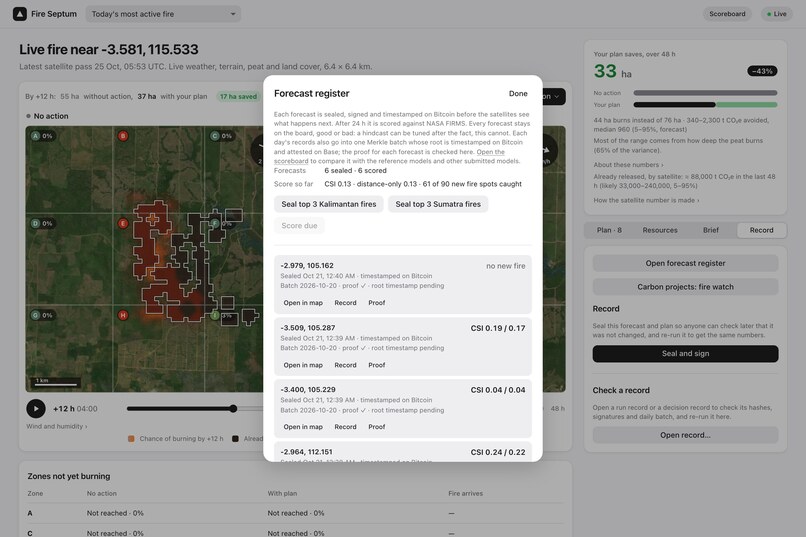
Forecast register: forecasts sealed by a fixed rule, then scored 24 h later against NASA detections.
-
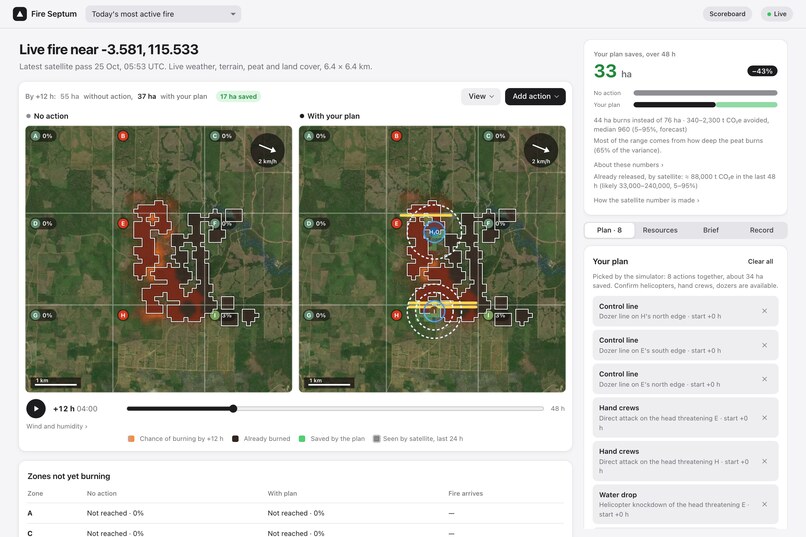
A real fire seen by NASA satellites today: left, what happens with no action; right, with the plan the simulator picked.
-
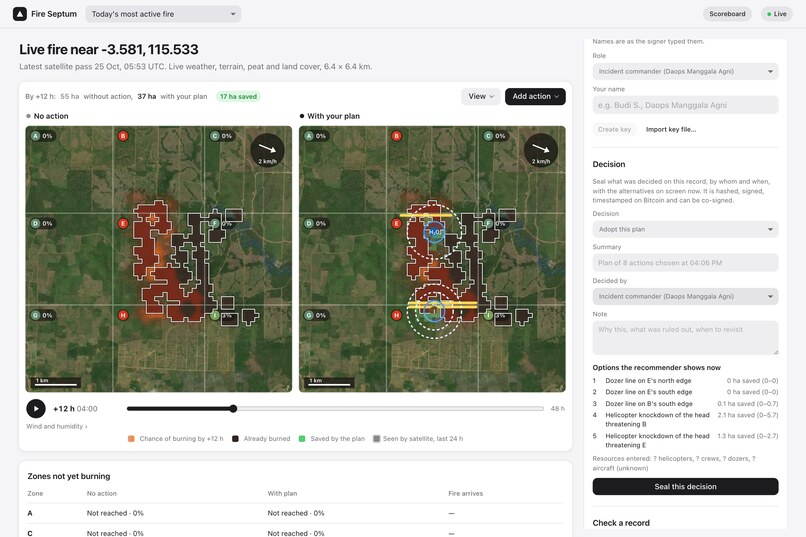
Decisions are sealed too: who decided what, and which options the recommender showed at the time.
The problem: nobody keeps score of fire forecasts
In 2015, Indonesia's peat fires released more CO₂ per day than the whole US economy (WRI, from GFED estimates). Drained tropical peat releases about 800 t CO₂e per hectare when it burns (IPCC Tier 1), and it can smoulder underground for weeks.
Every dry season, fire commanders at BPBD and Manggala Agni decide where to send crews, dozers and helicopters. They use hotspot maps and forecasts. But the data is scattered across NASA satellites, weather services, terrain, peat maps, canals and roads. And no one keeps score of the forecasts:
- You cannot prove what a model said before the fire spread.
- A model can always be tuned afterwards to look good on past fires.
- So no one knows which forecasts deserve trust, and decisions leave no record anyone can check later.
This is the track's problem exactly: environmental data that is fragmented and hard to verify.
Our answer: Fire Septum
Sekat api is Indonesian for "fire barrier". Fire Septum joins the open data into one forecast, then makes that forecast accountable. It does four things:
1. Forecast where fire goes next.
- Where will new hotspots appear tomorrow? A gradient-boosted model trained on the 2015 and 2019 fire seasons gives the chance of new fire in every 400 m block. It uses NASA FIRMS fire history, ERA5 fire weather (Drought Code), peat, land cover and canals. It is calibrated and tested on fires it never saw.
- What if we act? A 40-run simulation shows how a real fire spreads over 24–48 h, with the uncertainty visible.
2. Plan, and count the carbon. The app tests control lines, helicopter water drops, hand crews and peat injection at several start times. It ranks them by hectares saved, and only uses resources the commander says are really available. Each plan shows the CO₂e avoided as a range (for example 340–2,300 t, median 960), next to what satellites already saw burn. The app also says that most of the range comes from how deep the peat burns.
3. Seal before the outcome. Every forecast and decision is hashed (SHA-256), signed (Ed25519) and timestamped on Bitcoin through OpenTimestamps, before the satellites see what happens next. Each day's records go into one Merkle root, which can also be attested on Base with the Ethereum Attestation Service. Anyone can re-run a sealed record and get bit-identical numbers. We checked this on 4 JavaScript engines: Node, Chromium, Safari and SpiderMonkey.
4. Score in public. After 24 h, each sealed forecast is scored against NASA VIIRS satellite detections. It stays on a public scoreboard, good or bad, next to two fixed reference models. Anyone can submit their own model in an open format and be scored the same way.
It also watches fire inside and near REDD+ peat carbon projects and seals the satellite evidence. And it prints a one-page PDF brief for commanders in Bahasa Indonesia or English.
Does it work? What we measured, not claimed
We fixed the train/test split by a stated rule and timestamped it on Bitcoin before training any model. There are 1,492 fire events in all.
- Next-day forecaster: on held-out 2023 Sumatra fires (184 boxes), Brier skill +0.036 [95% CI +0.026, +0.045] and AUC 0.79. That beats persistence (+0.020) and distance-to-fire (+0.022) on the same rows.
- Spread simulation, 12 real fires (8–18 Oct 2026): CSI 0.23 against 0.18 for distance alone. The margin is small, and we say so.
- Pre-registered forecasts: 6 sealed and 6 scored so far. The simulation currently scores below the simple distance reference (CSI 0.13 vs 0.18). That result is on the public scoreboard because that is the point: a sealed forecast cannot be tuned after the fact.
- Carbon cross-check: our satellite (FRP) CO₂ estimate is 1.0–3.0× GFED4.1s in the most-burned peat cells. Burned area measured afterwards from Sentinel-2 and Sentinel-1 for 9 fires lies 81–100% inside the satellite footprints.
- Third-party check: the Bitcoin proofs verify in the reference OpenTimestamps client, with no Fire Septum code involved.
How we built it
TypeScript, React and Vite, with three.js for 3D terrain. The spread model is the Alexandridis et al. (2008) cellular automaton, with a Horn slope kernel as in Köse et al. (2008, IEEE 3DTV-CON). It runs in Web Workers. Common random numbers let us compare a plan with "no action" run by run. We wrote our own fdlibm-based math functions so the output hash is the same in every browser engine. The forecaster is scikit-learn gradient-boosted trees, exported to JSON and evaluated by the same TypeScript feature code in training and in the app. Emissions use the IPCC 2013 Wetlands Supplement factors with per-cell burn depth. 191 automated tests run in CI.
All data is free and open: NASA FIRMS, ERA5 / Open-Meteo, AWS Terrain Tiles, Global Forest Watch peat, ESA WorldCover, OpenStreetMap, Sentinel-1/2 and BMKG.
Who it is for
- BPBD and Manggala Agni commanders: where fire is likely tomorrow, and what acting would change.
- Provincial governments: when to request aircraft, on a record that shows what was known at the time.
- Researchers and agencies: a public, pre-registered scoreboard where any fire model can be compared.
- Carbon-project verifiers, buffer pools and auditors: proof of what was forecast, decided and observed, and when.
It runs in a browser. Adding a new region is just a bounding box.
Challenges and honest limits
- Peat fires smoulder and creep, so a flame-front model fits them poorly. Its skill over distance-only is small, and its raw probabilities are not calibrated. This is why we added the separate statistical forecaster.
- Peat burn depth is inferred from satellite fire history, not measured in the field.
- OpenStreetMap canals are patchy, so the drainage effect is an assumption.
- SiPongi (Kemenhut) data needs written permission, so that adapter is off.
- It has not yet been tested with BPBD or Manggala Agni staff.
What we learned
A good-looking hindcast proves little. The honest test is a forecast sealed before the outcome. Building that showed us the weak spots of our own model faster than any tuning would have.
What's next
Run the register through the 2026 dry season and invite other models onto the scoreboard. Add peat-moisture data (SMAP / SiPALAGA) to the forecaster. Test the planning view and the PDF brief with one Daops Manggala Agni unit.
Research prototype: not firefighting guidance. Emission numbers are estimates, not carbon credits.
Built With
- aws-terrain-tiles
- base
- bitcoin
- ed25519
- era5
- esa-worldcover
- ethereum-attestation-service
- github-actions
- global-forest-watch
- nasa-firms
- open-meteo
- openstreetmap
- opentimestamps
- playwright
- python
- react
- scikit-learn
- sentinel-1
- sentinel-2
- three.js
- typescript
- vercel
- vite
- vitest
- web-workers

Log in or sign up for Devpost to join the conversation.