-
-
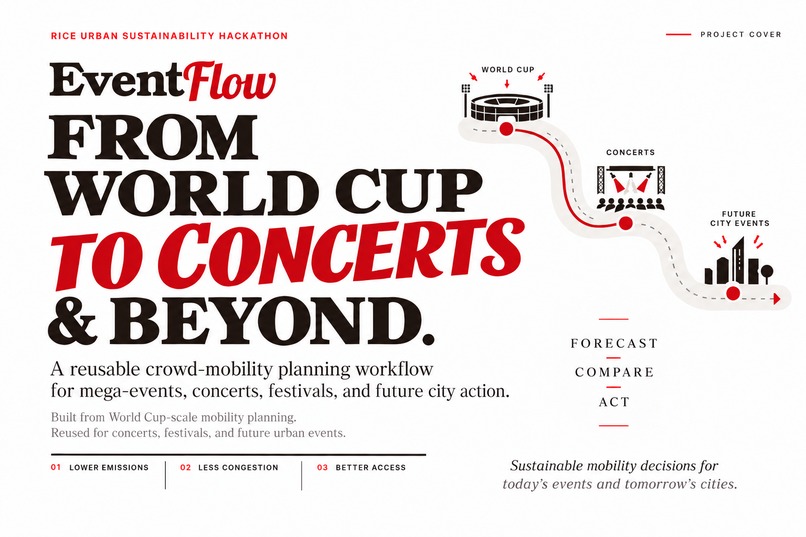
Poster
-
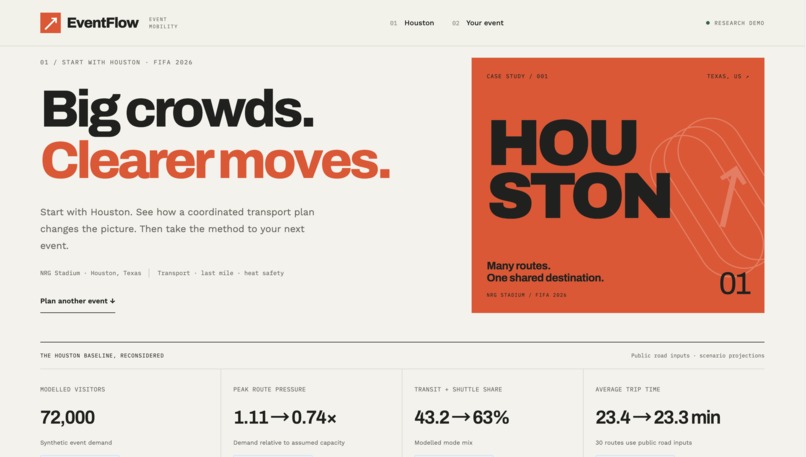
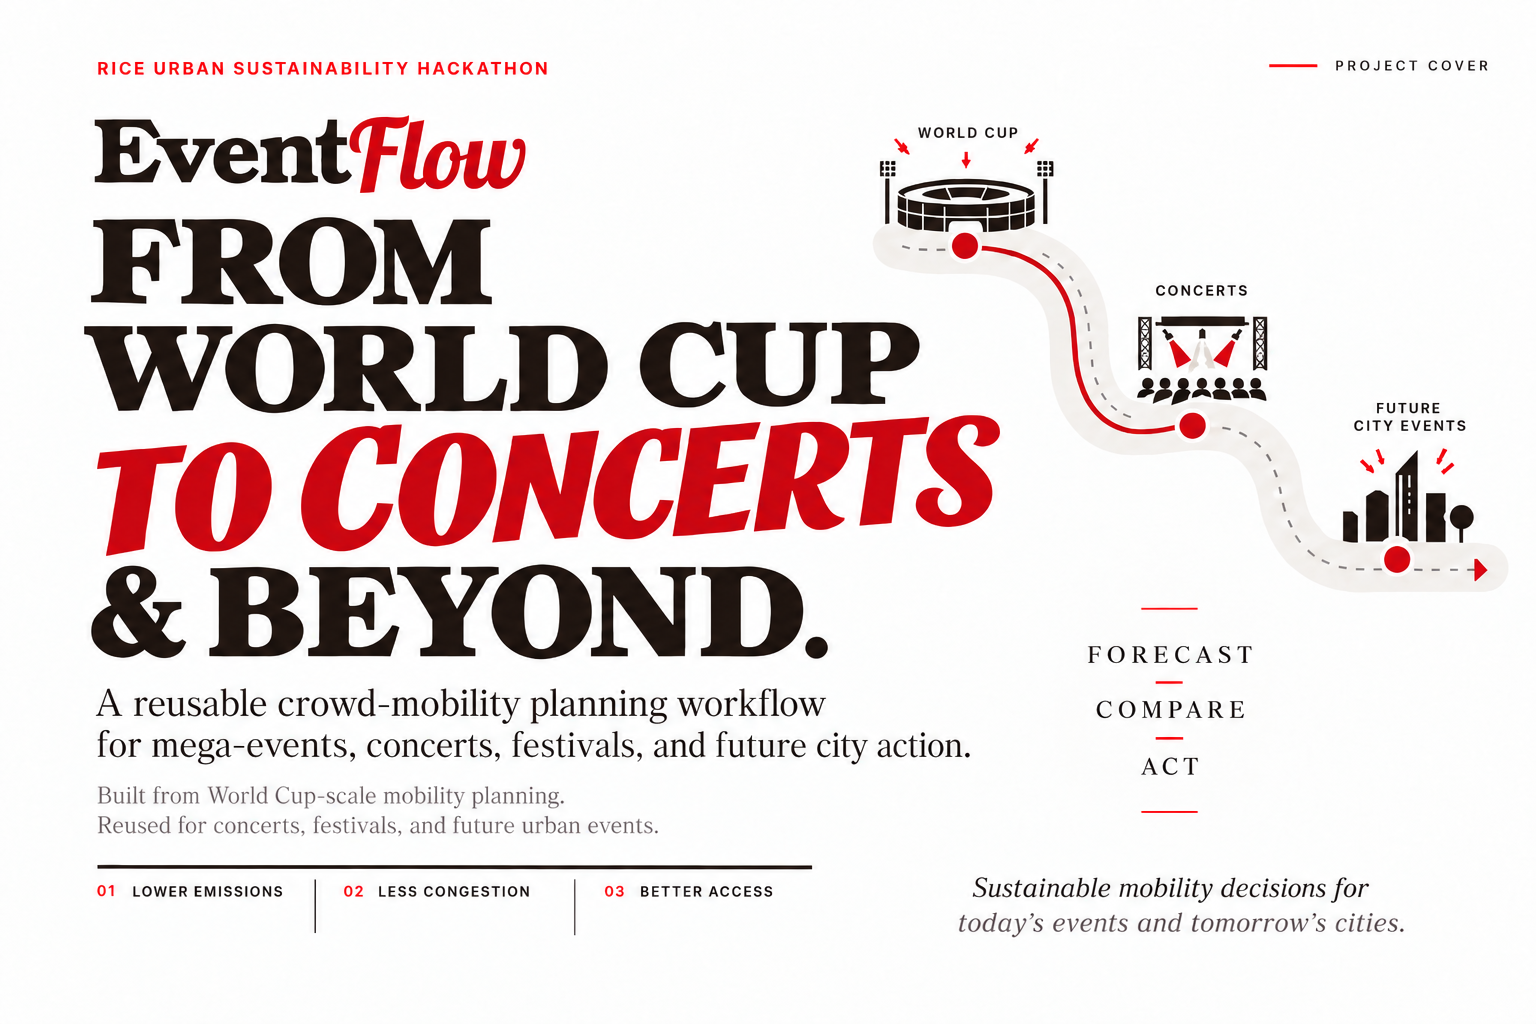
EventFlow turns city-scale event data into actionable decisions for safer, smoother, and more efficient crowd movement.
-
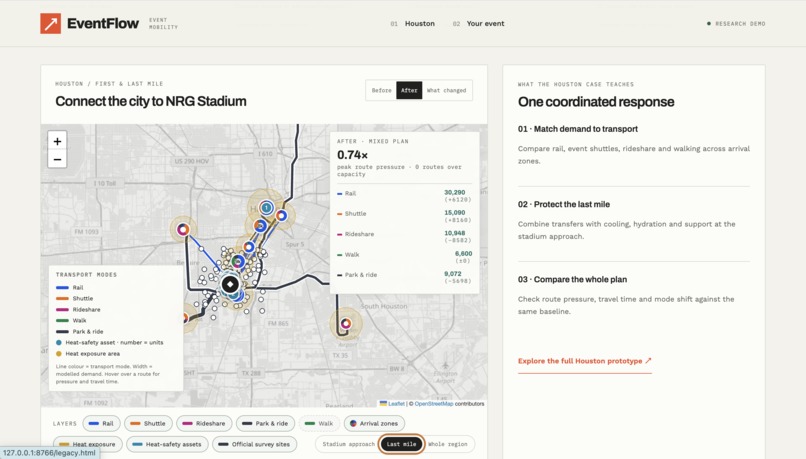
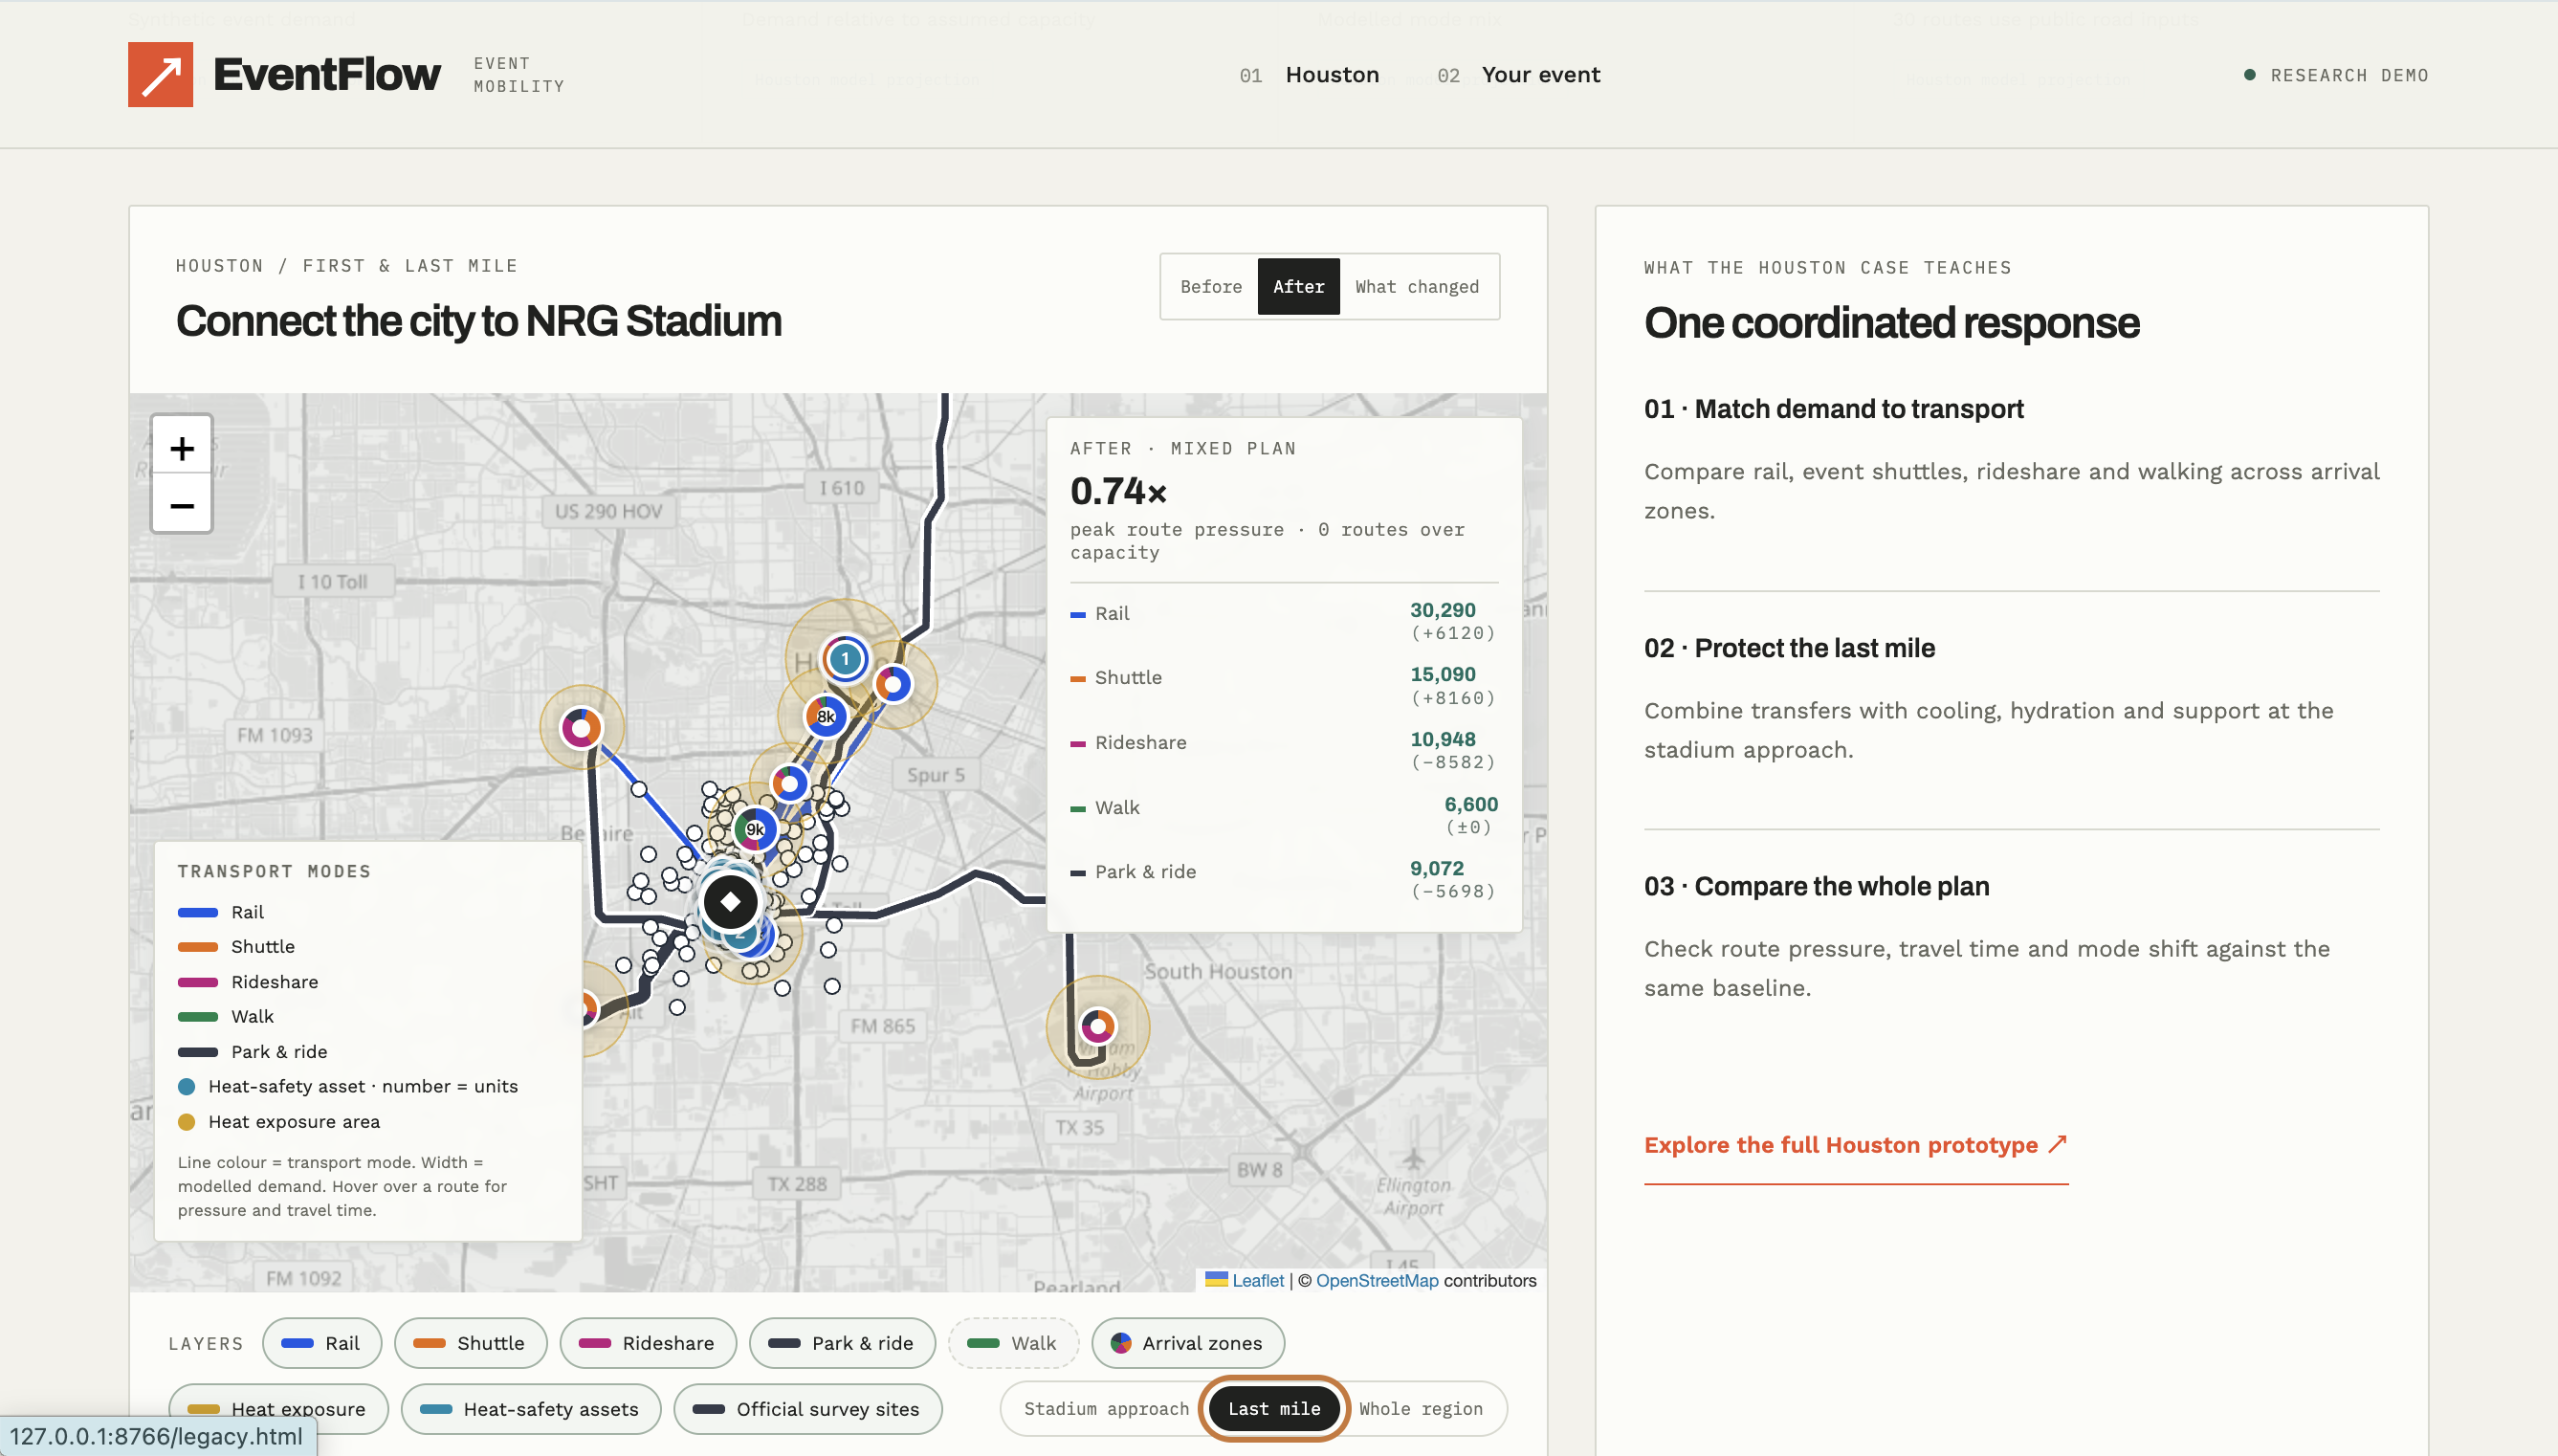
Interactive Houston map compares venue connectivity, transit access, congestion risk, and first/last-mile travel options.
-
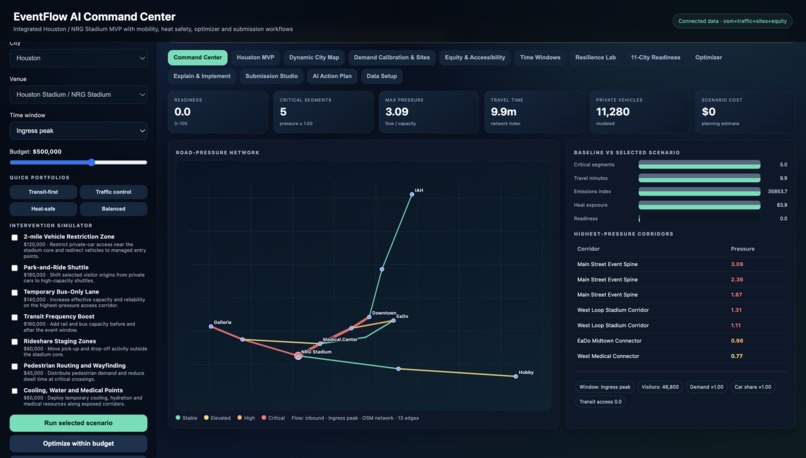
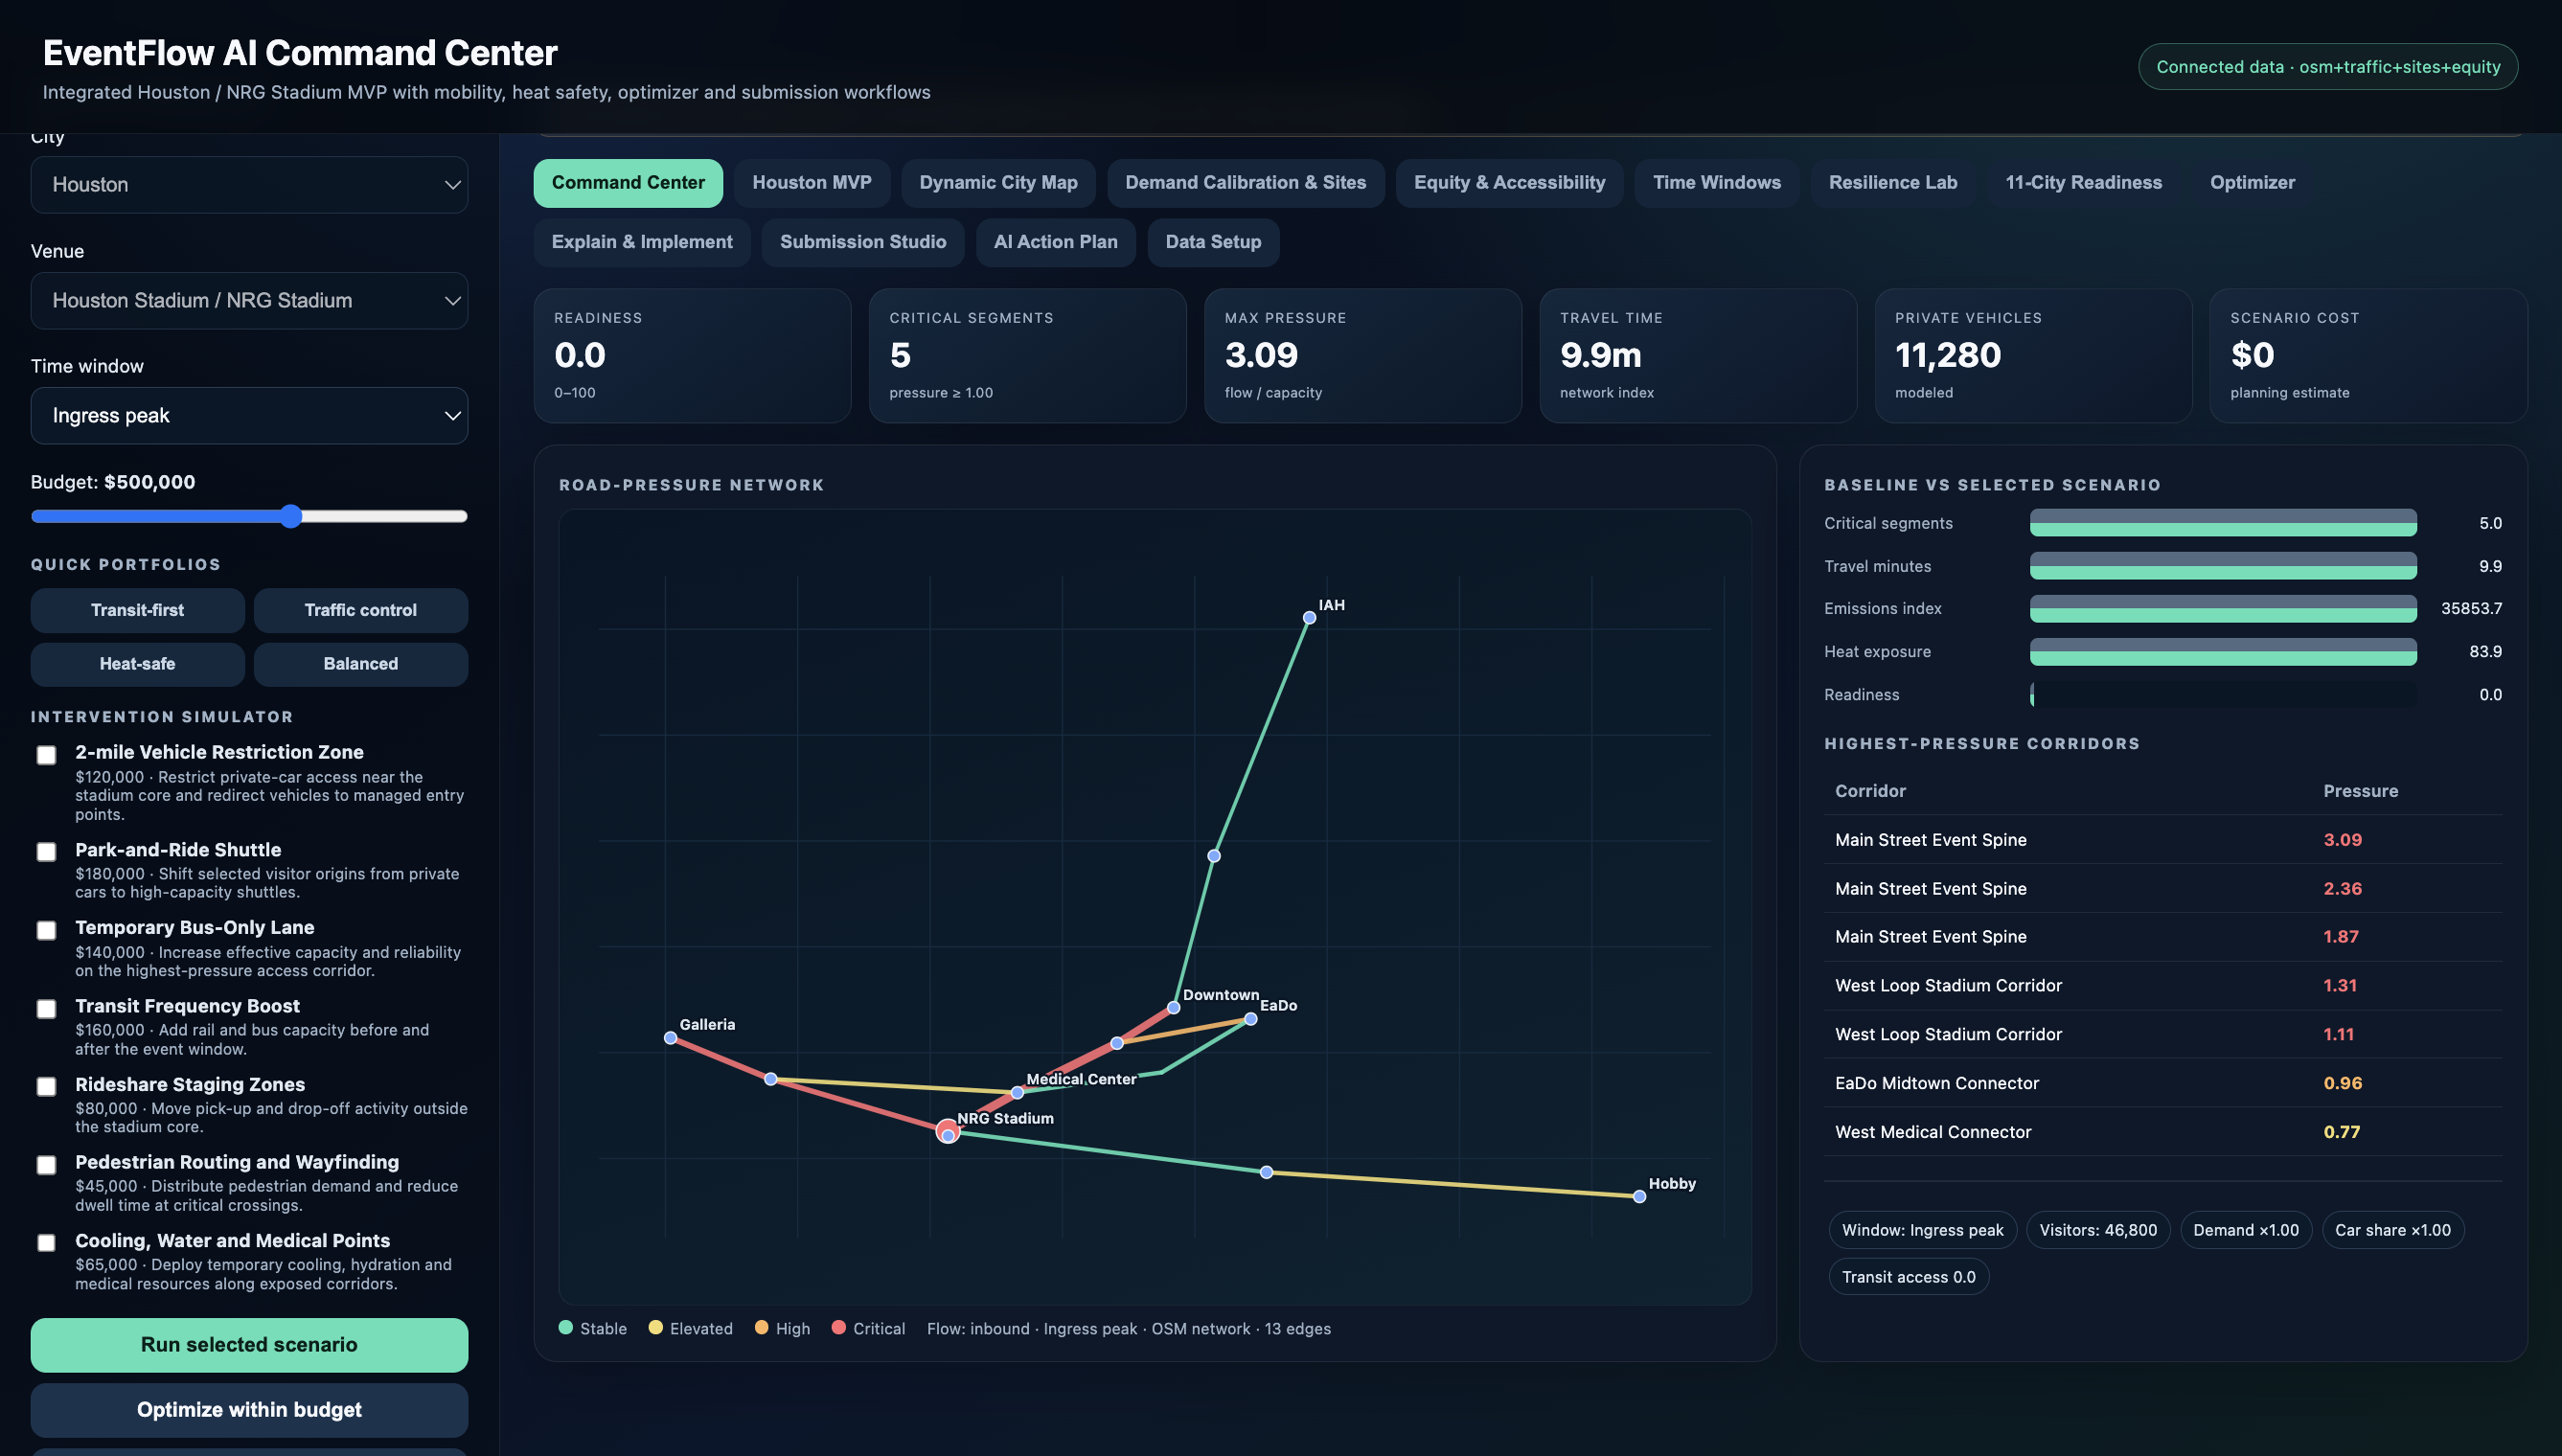
Scenario planner lets organizers test attendance, budget, location, and constraints before committing public resources.
Inspiration
Major events require cities to spend enormous amounts of money on transportation, crowd management, temporary infrastructure, staffing, and public safety.
But the planning process can still rely on fragmented datasets, expensive consulting, and decisions that are difficult for the public to verify.
That led us to a simple question:
Before public money is committed, can we quantitatively compare which investments actually appear most useful?
We built EventFlow to connect spending decisions with transparent evidence.
Instead of producing another congestion map or mobility score, EventFlow helps planners ask:
- Which interventions relieve the most pressure?
- Which combinations fit within the available budget?
- What happens if demand increases or transportation capacity fails?
- Which assumptions are supported by evidence, and which still need validation?
Our first prototype focuses on Houston and the mobility challenges surrounding NRG Stadium: crowd movement, first- and last-mile access, transportation pressure, accessibility, and heat safety.
But the underlying idea extends far beyond one World Cup.
The same planning workflow can be used for concerts, football games, festivals, conventions, and other large events.
For governments, more transparent planning can help public money serve a clearer purpose. For privately funded events, more efficient operations could also reduce unnecessary costs and potentially make large events more affordable.
What it does
EventFlow turns event-mobility data into a costed, stress-tested action plan.
The platform follows a repeatable workflow:
Understand demand → establish a baseline → compare interventions → optimize under a budget → stress-test the plan → explain the evidence
Houston: from mobility pressure to coordinated planning
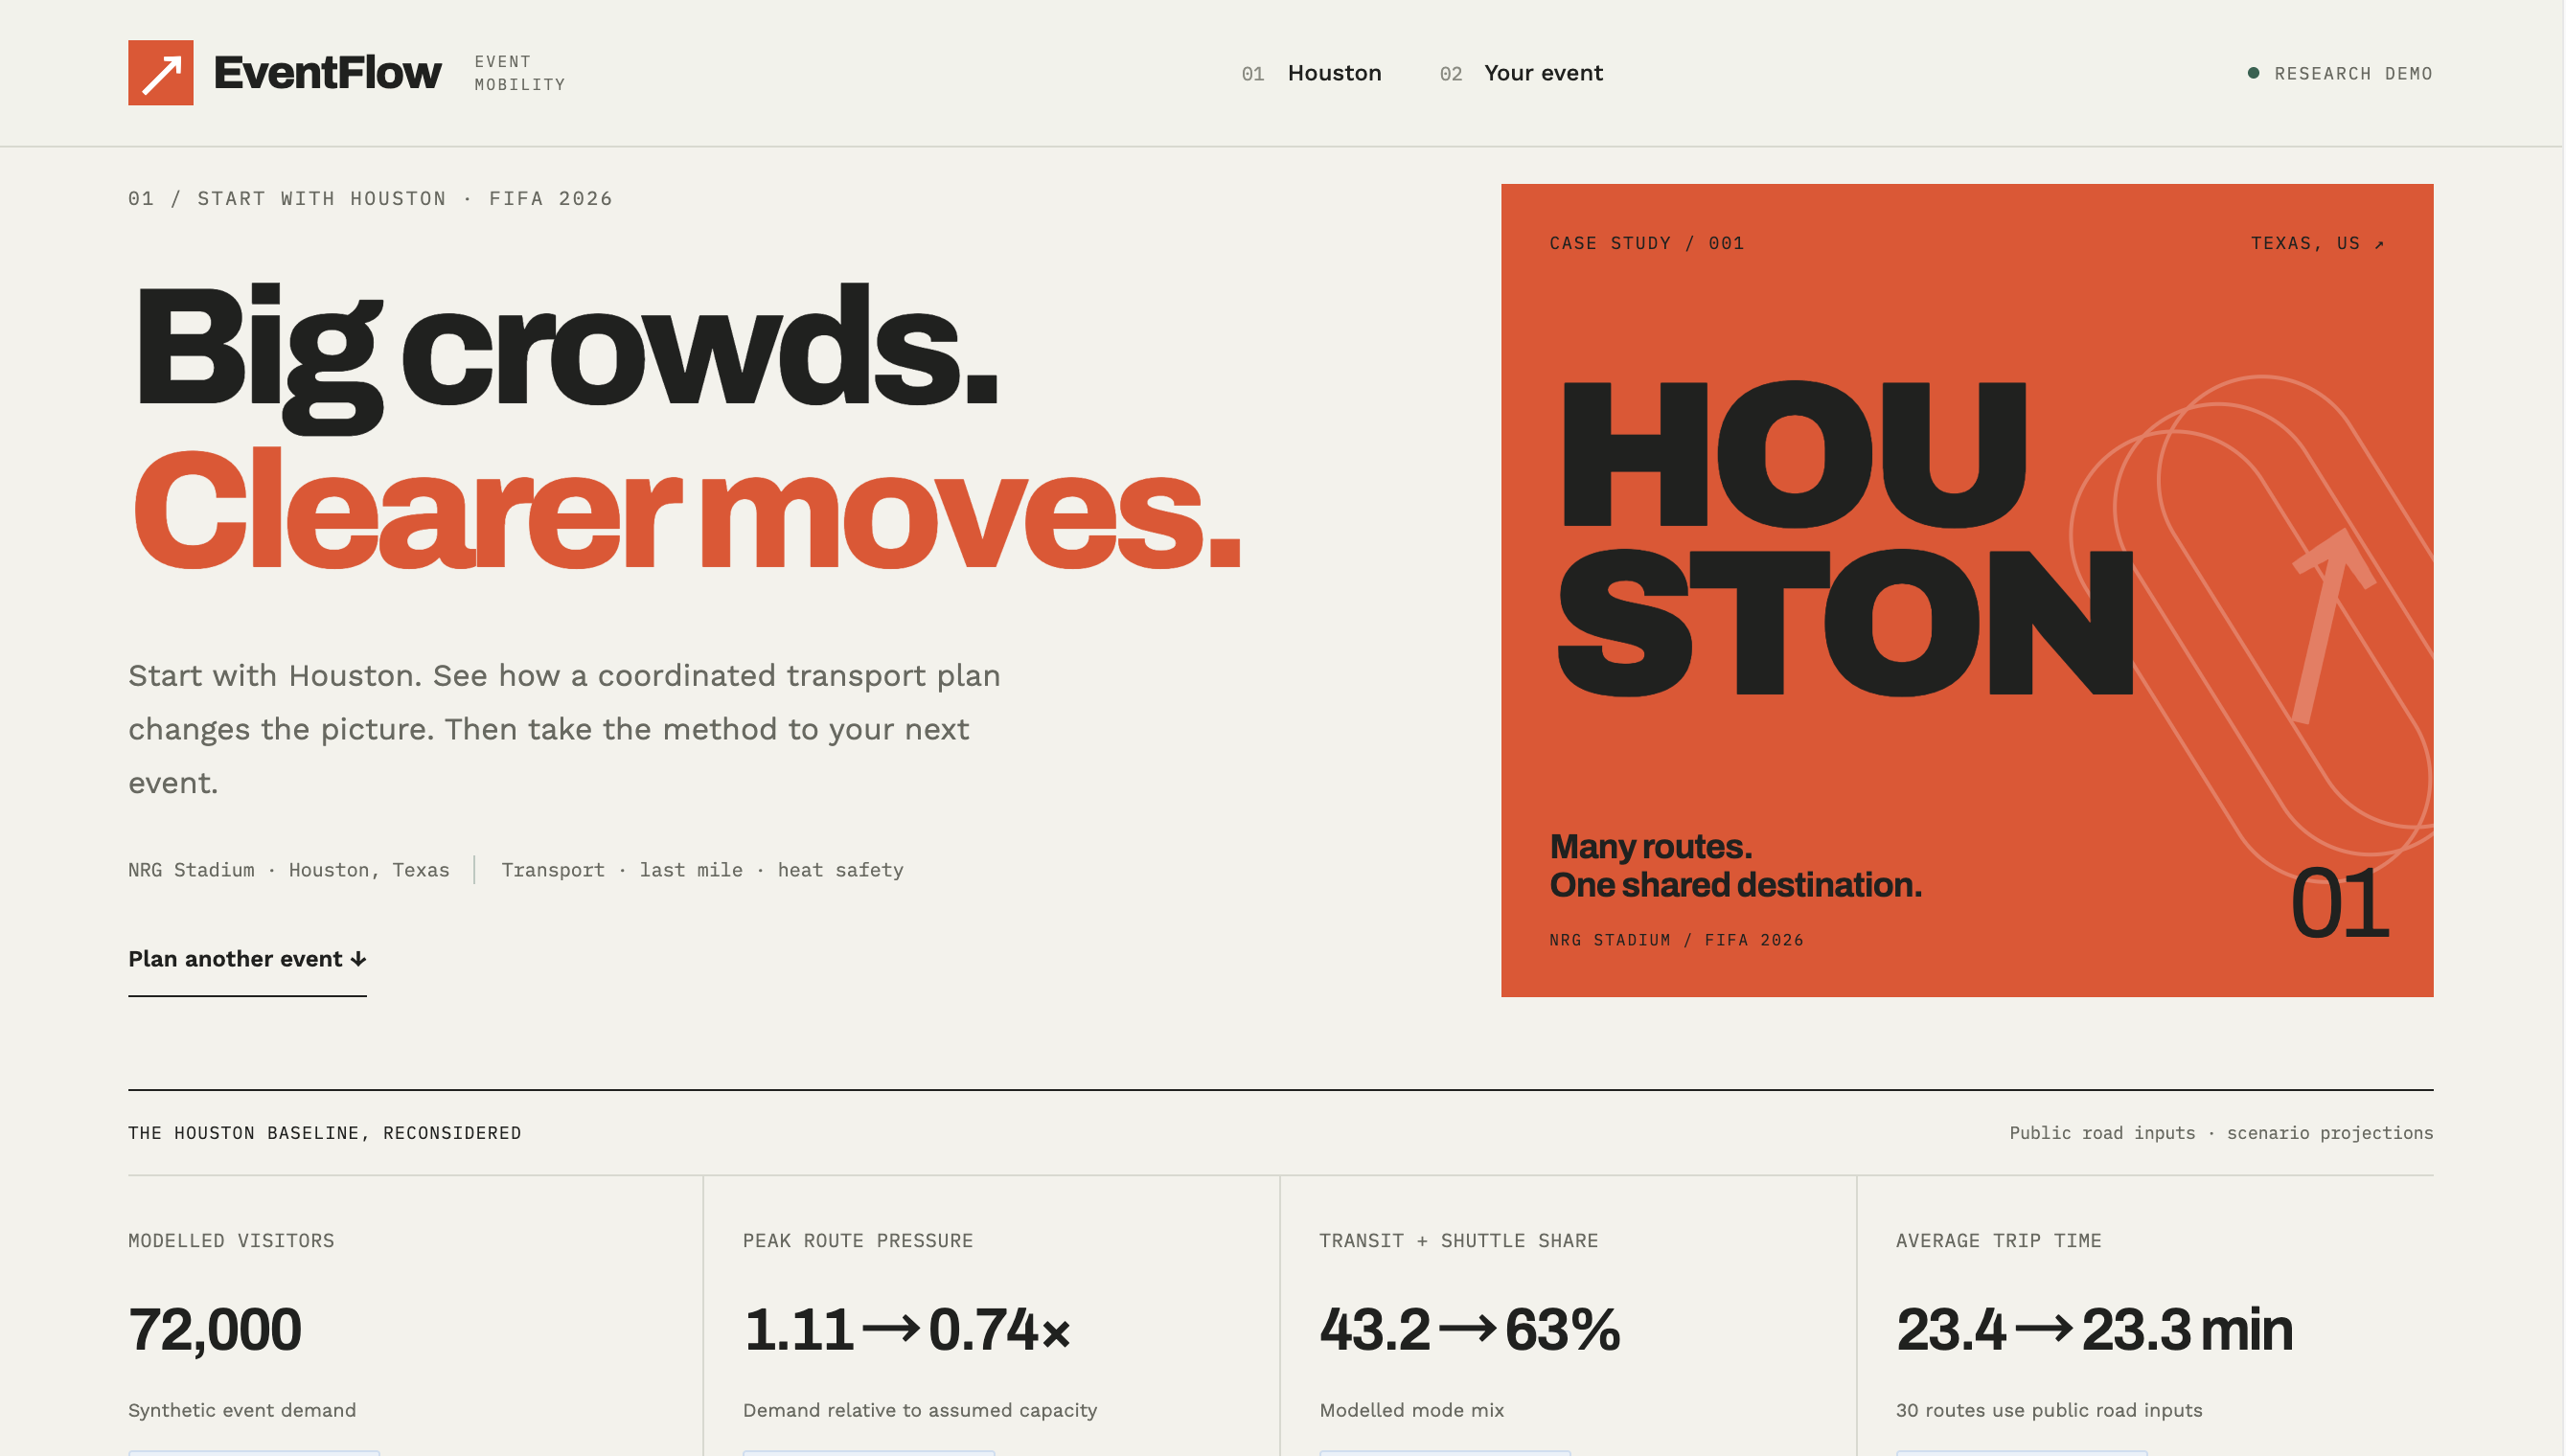
Our Houston prototype models 72,000 visitors traveling to NRG Stadium.
Rather than evaluating rail, shuttles, rideshare, walking, park-and-ride, and heat-safety measures separately, EventFlow treats them as one connected first- and last-mile system.
Users can compare a modeled baseline with a coordinated intervention scenario.
In our Houston demonstration:
- peak route pressure falls from 1.11× to 0.74× assumed capacity
- the combined transit and shuttle share increases
- modeled routes operating above assumed capacity fall from six to zero
The interface allows planners to switch between Before, After, and What changed views so they can see not only the final result, but which corridors are relieved and which still require attention.
These Houston results are synthetic model projections. They demonstrate the decision process and are not presented as measured outcomes that have already occurred.
The full Houston command center also lets planners define a budget, select interventions, compare prepared strategies, and evaluate transportation improvements alongside cooling, water, and medical resources.
A reusable workflow for new events
The larger goal of EventFlow is not to build a one-time Houston dashboard.
A planner can start with a different:
- city
- venue
- event type
- crowd size
- budget
- transportation capacity
- policy objective
and reuse the same planning logic.
Our platform supports event briefs in natural language as well as structured inputs.
When configured, OpenAI is used only to transform an event description into structured planning inputs. It does not generate transportation outcomes.
The transportation calculations themselves are produced by deterministic models using explicit assumptions and public geographic data.
New York / New Jersey case study
To test the framework against stronger real-world evidence, we built a prepared New York / New Jersey stadium-event case.
The scenario assumes 50,000 departures from MetLife Stadium after a concert.
Instead of reusing Houston's assumptions, EventFlow replaces the local evidence with New York and New Jersey transportation data, transfer locations, and historical stadium-event observations.
The workflow remains the same:
- quantify demand
- establish a baseline
- generate feasible intervention portfolios
- apply a budget constraint
- compare policy priorities
- test disruption scenarios
- expose assumptions and limitations
For a $500,000 incremental event budget under a balanced policy objective, EventFlow recommends a portfolio including:
- accessible transfer capacity
- a protected shuttle operating window
- managed rideshare loading
- 20 additional event coaches
- additional staffing at the Penn–Secaucus transfer
The central planning estimate is $435,000.
Under the model, maximum clearance falls from 186 to 138 minutes, while total modeled queue burden falls by 18.3%.
These numbers are planning projections, not improvements we claim have already occurred.
Making recommendations explainable
A recommendation is only useful if planners can understand why it was selected.
EventFlow therefore shows the trade-offs behind each plan.
Pareto frontier
Every point represents a different intervention portfolio.
The chart helps planners see whether spending more actually produces additional policy value and whether another portfolio could achieve a similar result with fewer resources.
Queue-clearance model
The platform also visualizes how the modeled population clears the transport system over time.
Instead of simply reporting one final percentage improvement, planners can see when the improvement occurs and which transport cohorts remain constrained.
Stress testing
Users can change operating conditions and examine how the same plan performs during scenarios such as:
- rail disruption
- increased event demand
- heat conditions
- changes in transportation capacity
This turns the recommendation into an explainable planning decision rather than a black-box score.
How we built it
EventFlow combines a web-based decision interface with a reproducible modeling backend.
Our backend is built with Python and FastAPI.
We use:
- OpenAI Structured Outputs for optional event-brief parsing
- OpenStreetMap
- Nominatim
- Overpass
- OSRM for route and travel-time context
- deterministic queue models
- fleet-capacity modeling
- budget optimization
- scenario and sensitivity analysis
For shuttle planning, we estimate vehicle cycle time using round-trip travel time plus loading and unloading time.
Additional hourly capacity is modeled as:
$$
\text{Capacity}
\frac{ \text{Fleet Size} \times \text{Seats} \times \text{Load Factor} \times 60 }{ \text{Cycle Time} } $$
For a passenger cohort of size (Q) with service rate (\mu), modeled clearance time is:
$$ T = \frac{60Q}{\mu} $$
The system evaluates feasible fleet configurations and intervention portfolios under the available budget, then compares their modeled queue burden and policy value.
For the NY/NJ case, we also:
- compiled transportation evidence from eight observed matches
- processed all 191 compressed organizer-data shards
- modeled rail, shuttle, and rideshare cohorts separately
- compared portfolios across different budgets and objectives
- ran 81 deterministic sensitivity scenarios
- performed leave-one-match-out baseline validation
- documented implementation owners, estimated costs, lead times, dependencies, and verification metrics
The frontend is built with JavaScript, HTML, CSS, and Leaflet, combining interactive maps, queue animations, intervention portfolios, scenario comparisons, and downloadable decision briefs.
Challenges we ran into
Evidence is not the same as assumption
One of our biggest challenges was determining what we could responsibly claim.
Our project combines several fundamentally different types of information:
- observed transportation evidence
- organizer-provided transformed samples
- public geographic data
- planning assumptions
- model outputs
Treating all of them as equally reliable would make the interface look more confident, but less useful.
Instead, EventFlow explicitly separates evidence, assumptions, and projections.
A precise number is not always a reliable number
Large-event transportation is highly uncertain.
Demand can change. Rail service can fail. Rideshare behavior can vary dramatically. Procurement costs can exceed initial estimates.
Rather than hiding this uncertainty, EventFlow makes it visible through sensitivity analysis and stress testing.
For example, our baseline transfer test trains on seven observed matches and predicts the eighth.
Rail transfers relatively well, with a mean absolute error of about 4.1 minutes.
Rideshare has a much larger error.
That result is valuable because it tells planners exactly where additional evidence is required before a model should be trusted operationally.
Turning analytics into action
Another challenge was moving beyond prediction.
A model might identify an attractive intervention, but a city still needs to know:
- Who implements it?
- How much might it cost?
- How long will it take?
- What approvals are required?
- How will success be measured?
For this reason, our NY/NJ recommendations include implementation information alongside the quantitative results.
The final plan can also be exported as a decision brief containing the recommendations, evidence, assumptions, and limitations.
What we learned
The most important thing we learned is that good decision-making is not the same as producing the most confident forecast.
A useful model should show both:
what it knows and what it does not know.
Uncertainty is not necessarily a weakness. It can tell decision-makers what to measure next.
We also learned that optimization alone is not enough.
A portfolio can look mathematically attractive but fail because of procurement costs, staffing requirements, accessibility constraints, agency coordination, or operating approvals.
Those constraints have to be part of the decision process itself.
Impact
EventFlow connects:
Evidence → Modeling → Investment → Implementation → Measurement
For governments, that creates a more transparent way to examine how public money could be allocated before it is spent.
Instead of simply saying that a city needs "more transportation," EventFlow can compare specific combinations of investments and show their modeled consequences.
For private event organizers, the same framework could help control transportation and operating costs while improving the visitor experience.
And because the workflow is event-agnostic, its value does not end with FIFA.
It can support:
- concerts
- football games
- festivals
- conventions
- university events
- future World Cups
- other large temporary gatherings
Our goal is to give every dollar a clearer purpose.
Not by pretending we can perfectly predict a city, but by making large-event planning more quantitative, explainable, and testable.
What's next
The next step is to replace more planning assumptions with measured local evidence.
We want to incorporate:
- event-specific GTFS and transit schedules
- real-time service information
- ticketing and visitor-origin data
- pedestrian and vehicle counts
- actual procurement quotations
- operator and venue feedback
- accessibility-path audits
- measured intervention outcomes
Ultimately, we want to test an EventFlow recommendation during a real large event and compare the observed result with the model.
The long-term vision is simple:
Every assumption in today's planning model should be capable of becoming tomorrow's measured evidence.
Built With
- api
- apis
- css3
- fastapi
- github
- gtfs
- html5
- javascript
- json
- leaflet.js
- nominatim
- openai
- openstreetmap
- osrm
- overpass
- pydantic
- python
- rest


Log in or sign up for Devpost to join the conversation.