


Inspiration
The World today is facing acute Energy crisis. With increased global demand for energy in recent years, it has become imperative for Electricity, Gas and Water Utility companies to better optimize their processes in order to increase operational efficiency. With technology, it has now possible to gather insights which can help them achieve it. Hence, to solve this problem facing our society, we have leveraged Splunk Data Platform, The Platform for Operational Intelligence, to monitor, gather insights and optimize Energy Load Profile.
How it works
Energy Scan is a Splunk based Analytics Solution to monitor , analyse and optimize your Energy Load Profile. Connect your Telemetry System Feed/Logs to obtain real-time information to manage your company's Energy Load Profile.
Key Features:
- Monitor Energy Demand in Real Time
- Get Insights from Historical Demand Profile to optimize Energy Distribution
- Geo-Analytics to obtain geography-aware Insights
- Can be used to understand Energy Demand for various utilities including Electricity, Water and Gas
- Connect your real-time Telemetry Systems to gain real-time Energy Demand Information
- Data input can be as granular as end-customer level details to understand market segmentation and plan campaigns accordingly
- Gain insights on consumer consumption pattern to optimize costs and plan Energy Generation/Abstraction in advance
Dashboards:
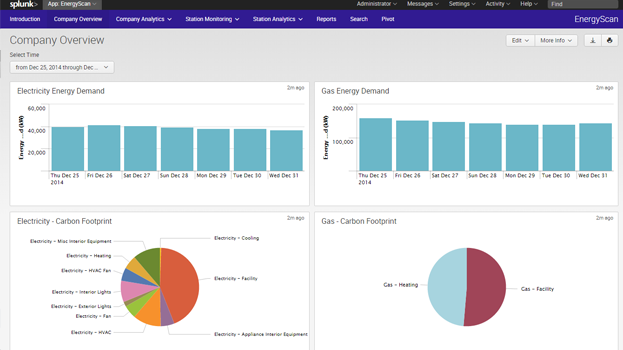
Company Overview:
- Gain a high-level Information about the Energy Demand across the company.
- Gain insights on distribution of Energy requirements. for e.g. Heating, HVAC, Lighting, Cooling, etc
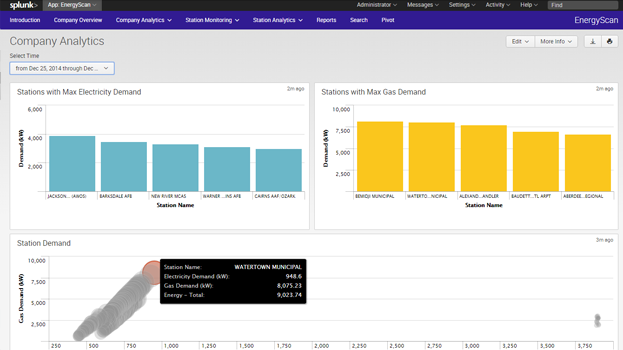
Company Analytics:
- Obtain insights on Energy Demand across various stations and geography
- Determine stations with maximum demand based on time factor
Company Energy Visualization:
- Energy Demand Insights through interactive Visualizations
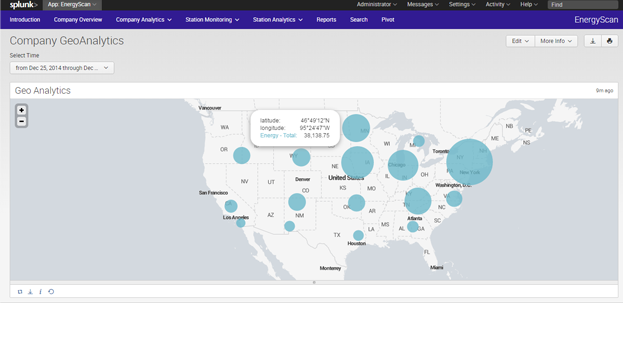
Company Geo-Analytics:
- Visualize Energy Demand on Maps and compare Stations
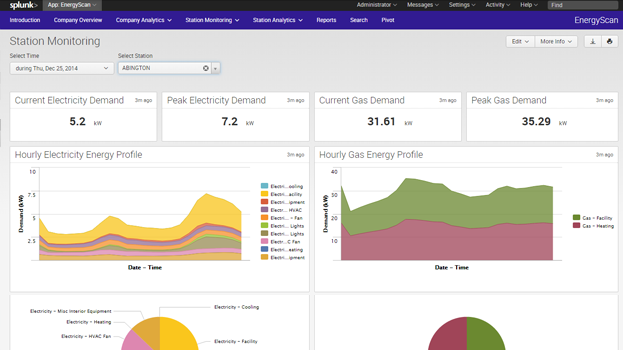
Station Monitoring:
- Monitor Energy Demands in real-time
- Understand current demand and peak demands
- Gain Insights on distribution and time factor
Station Performance:
- Analyse Station Demand using Historical Data
- Understand Daily Energy Load Profile to gain insights on consumer consumption pattern
- Understand Monthly Peak Energy Requirements
Station Analytics:
- Understand Energy Profile based on various factors including Weekend/Weekdays/Seasons/Time Period
- Gain Insights on consumer consumption pattern based on these factors, which can help plan Energy Generation/Abstraction in advance
Station Comparison:
- Compare different Stations to understand changes in Demand Patterns
- Compare data of a single Station under different conditions
Reports:
- Energy Load Profile Reports - Monthly and Hourly
Custom Search and Pivot:
- Use the power of Splunk to create your own insights
Challenges I ran into
Finding the right Data Set. However, Open Data from OpenEI came to my rescue.
Data Set used: Commercial and Residential Hourly Load Profiles for all TMY3 Locations in the United States
From within the Dataset, selected Residential Load Profile worth 515 MB used to analyse the data and create insights.
Accomplishments that I'm proud of
Use Splunk as a Analytics Solution to come up with insights to better optimize the Load profile and thereby use it for energy optimization.
What's next for Energy Scan
Enhance the Application to support Industry standard Inputs and add further Analytics, Alerts and Reports. Also provide advanced analytics to predict Demand based on historical information.
Entry to Splunk Apptitude Challenge 2
This solution is developed as a part of Splunk Apptitude Challenge 2. Request you to please consider this entry as an entry to both categories:
- Social Impact
- Innovation


Log in or sign up for Devpost to join the conversation.