-
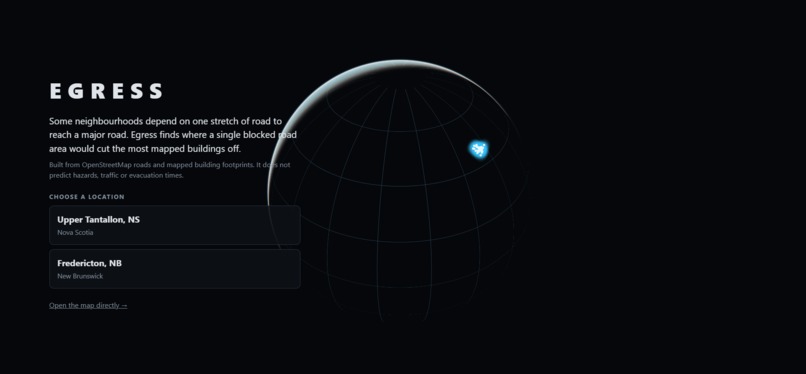
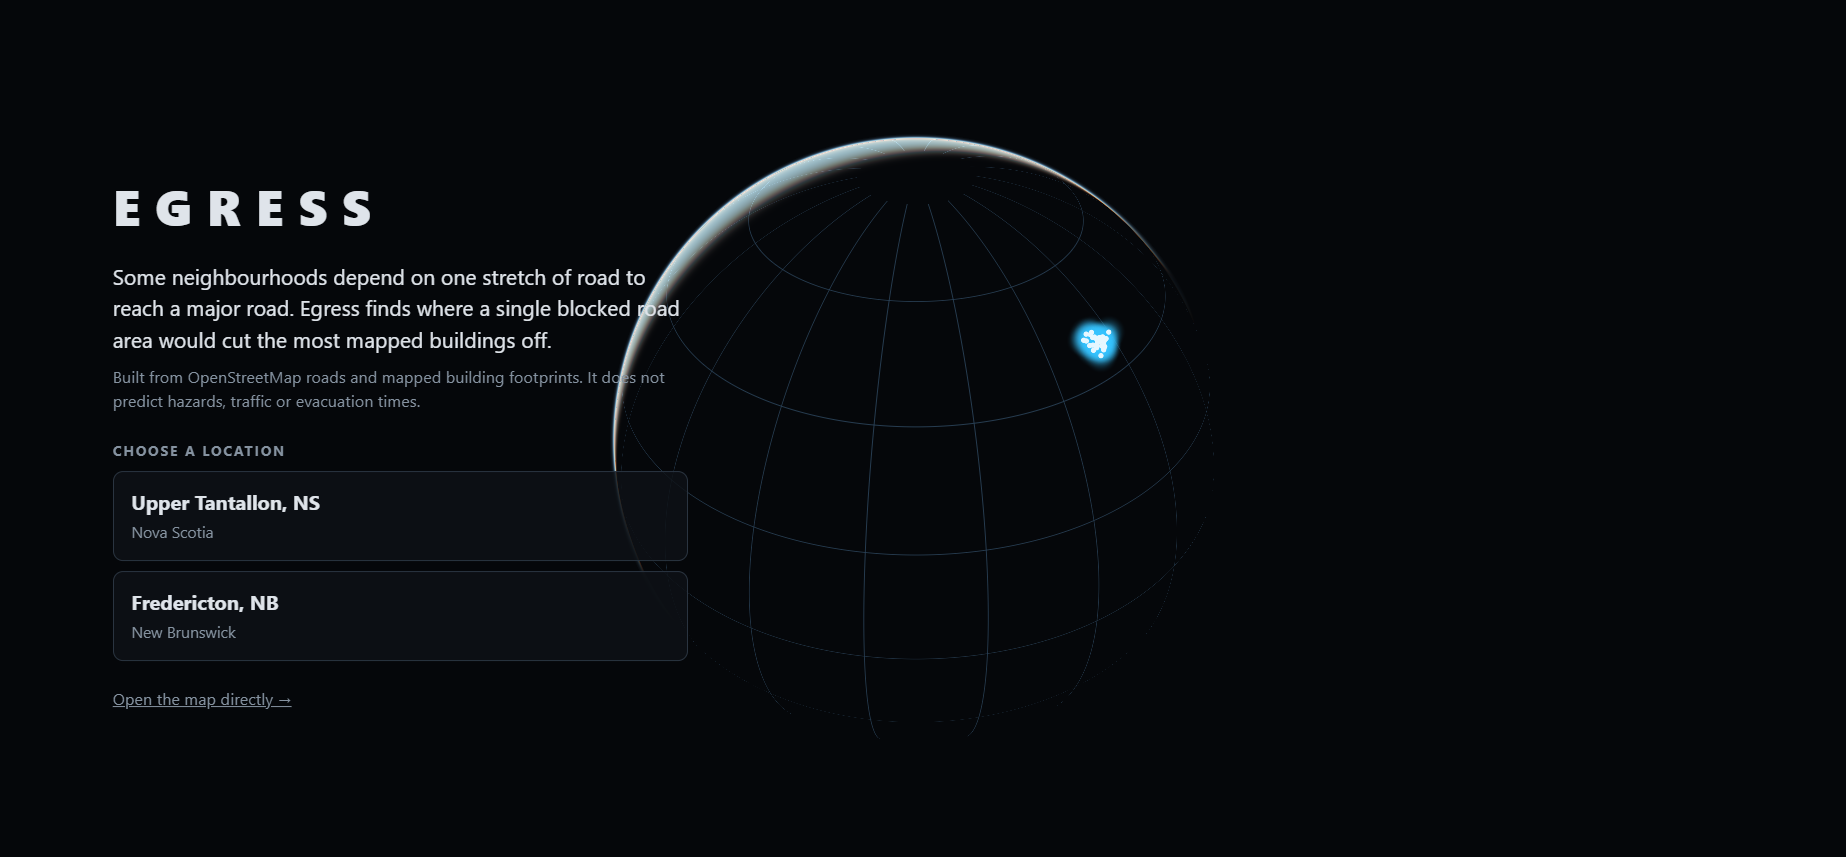
Landing page
-
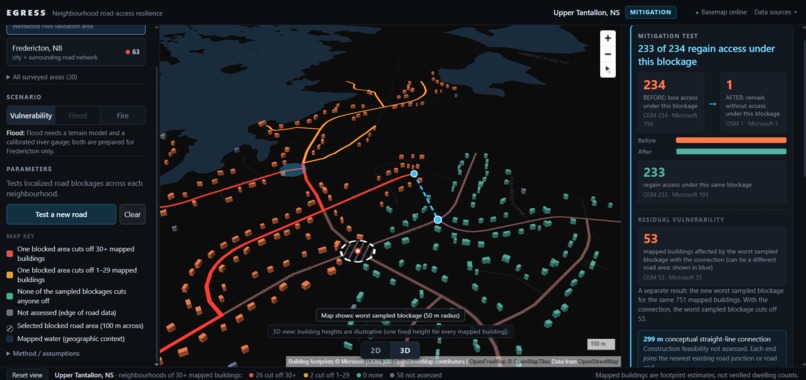
Clearer view of the interface
-
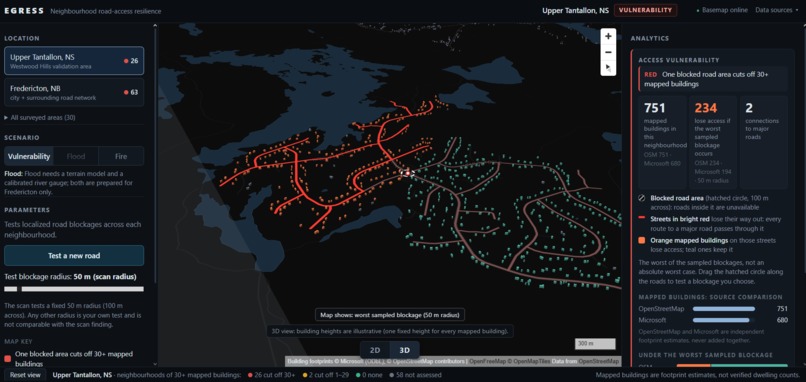
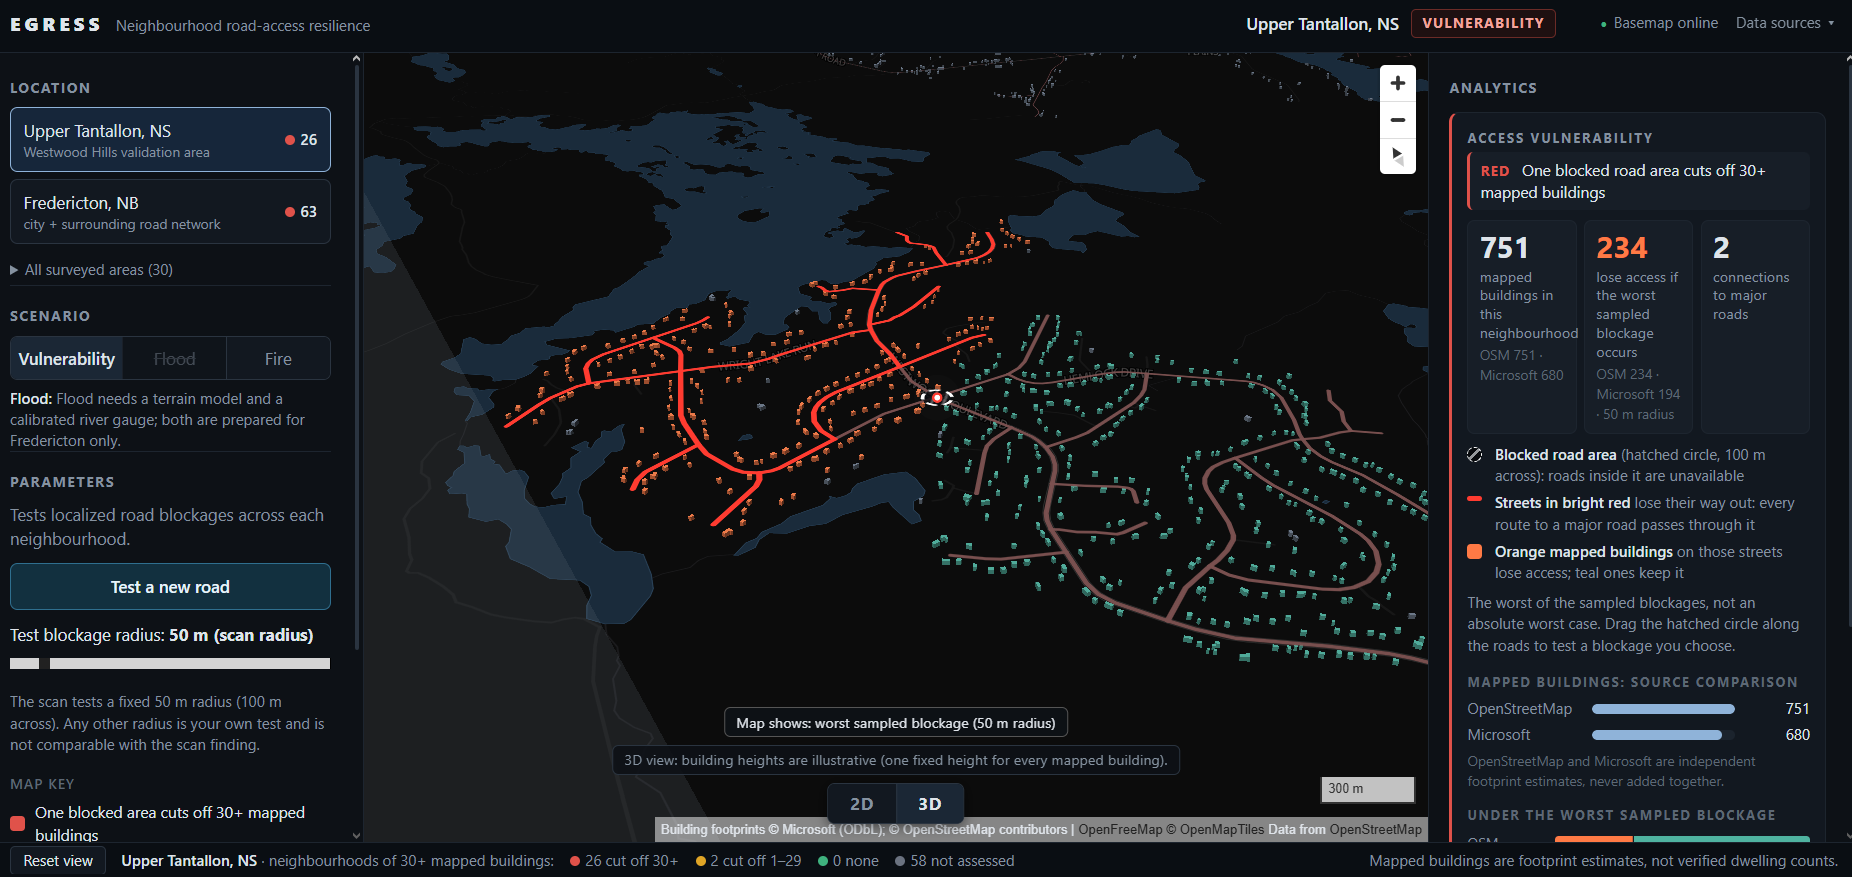
Westwood hills in action showing validation
-
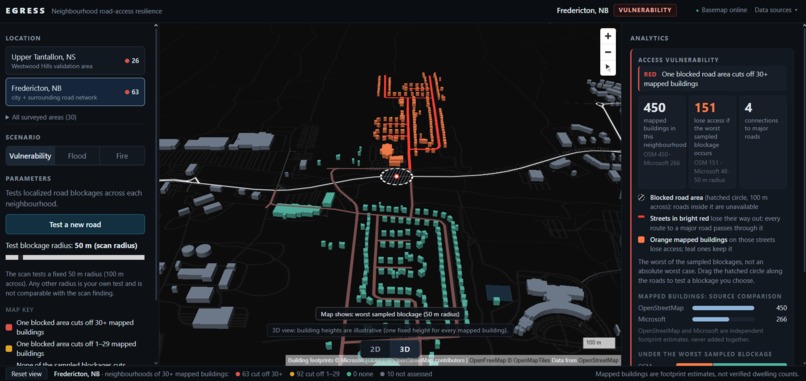
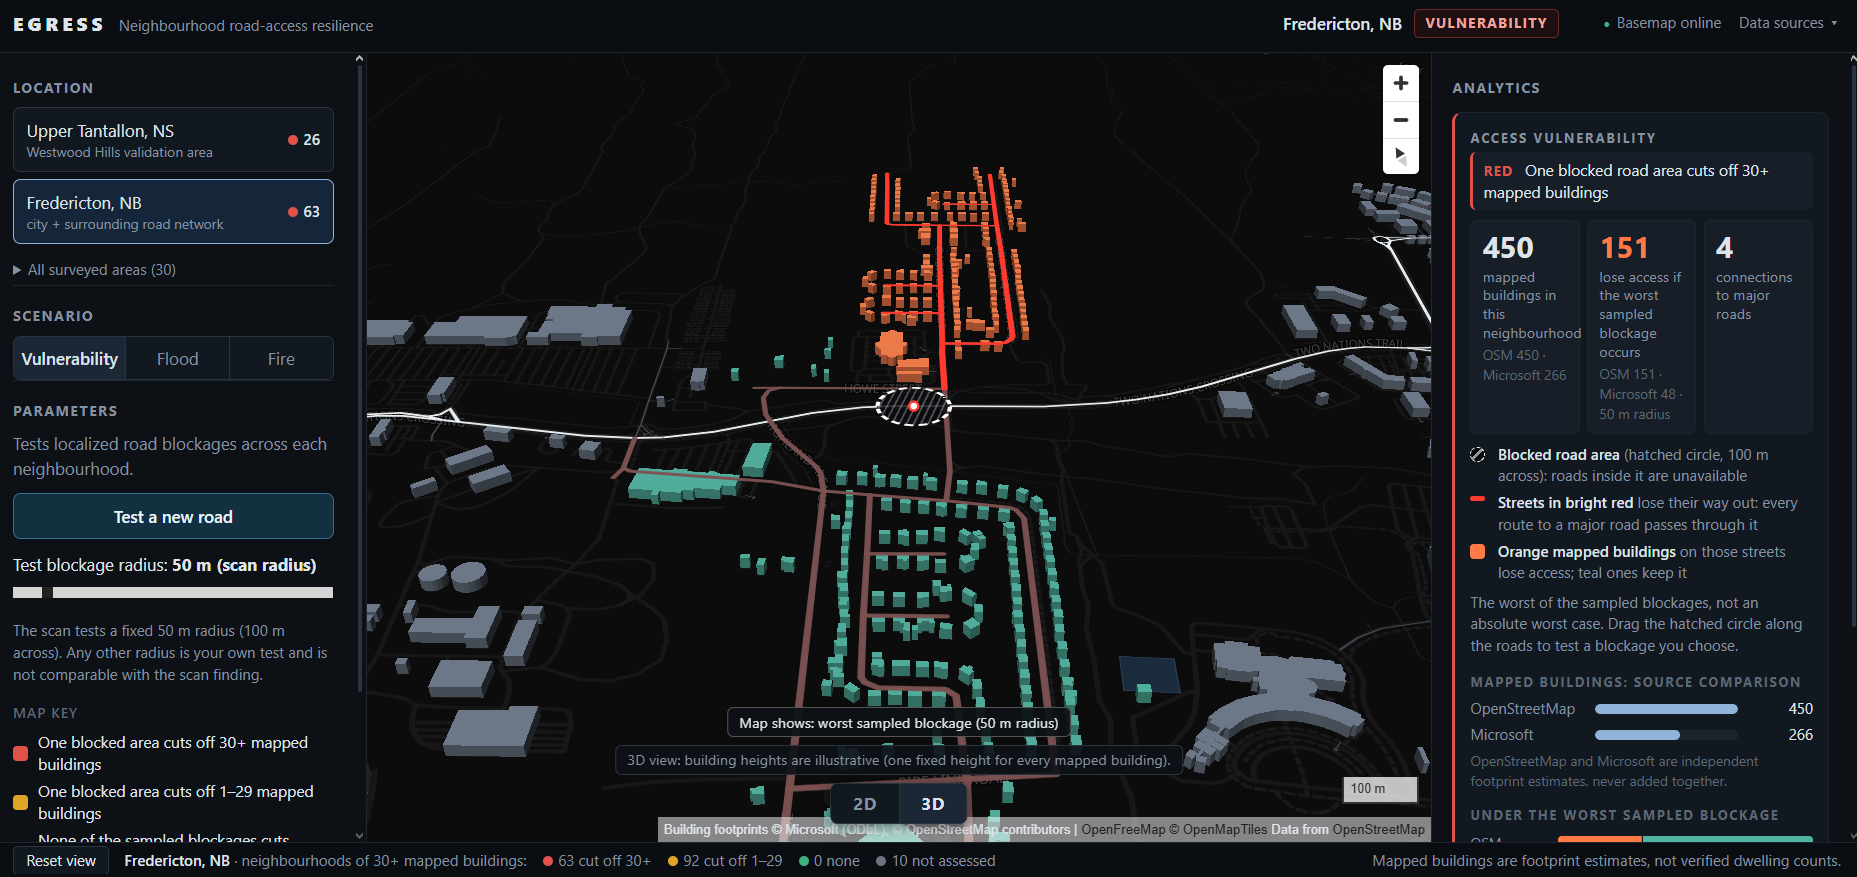
Neighborhood identified in need of attention in Fredericton via the software
-
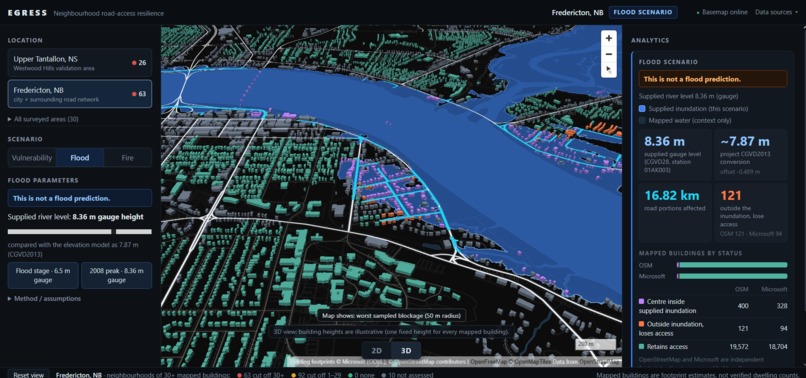
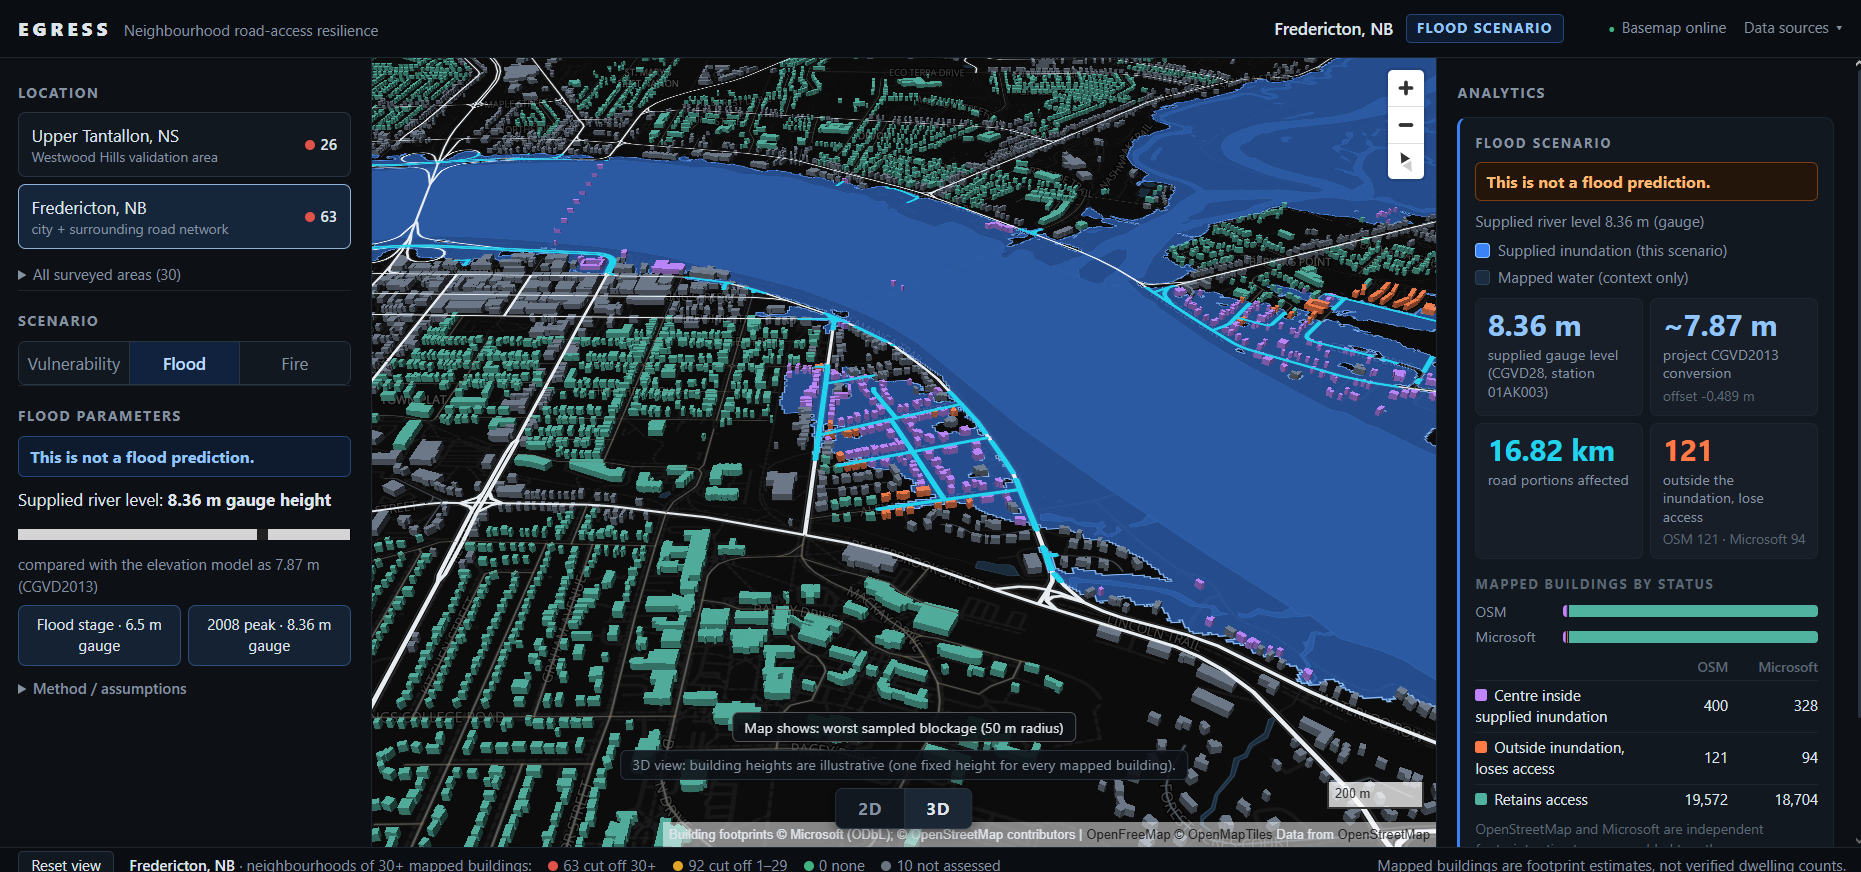
Flood scenario in action
-
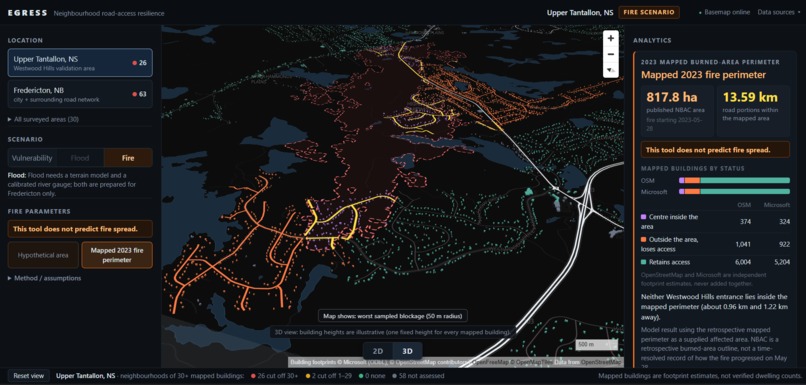
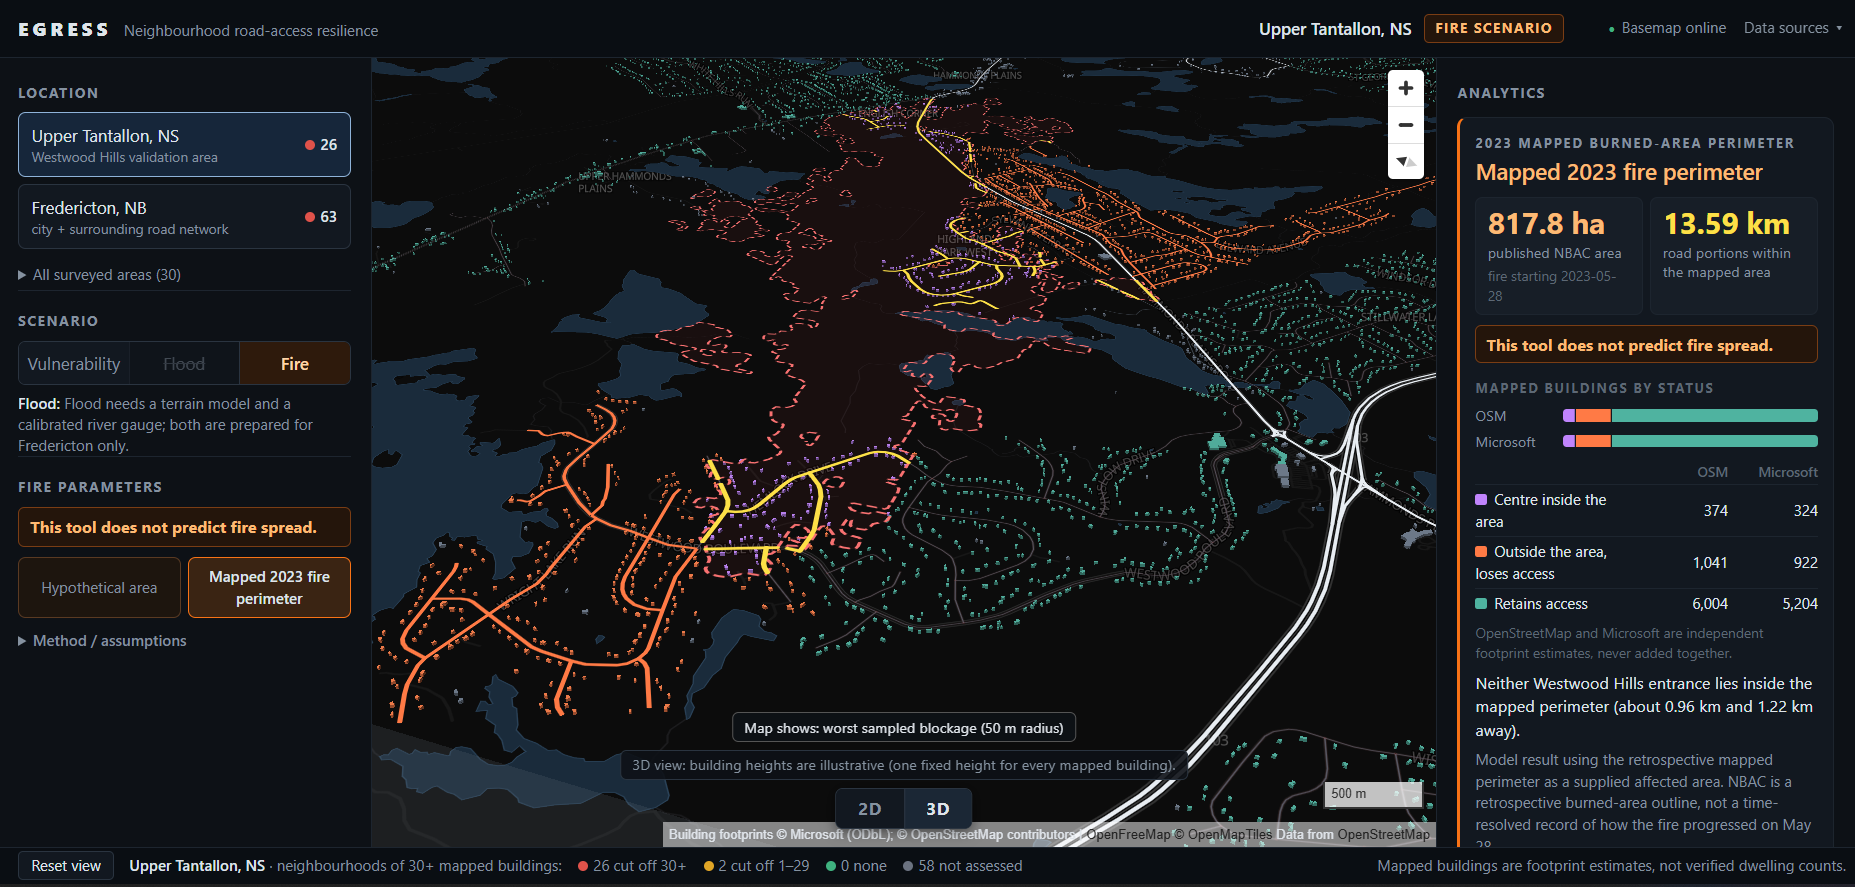
Fire from 2023 mapped as a example and validation
Inspiration
As a Geomatics Engineering student, I am naturally drawn towards more spatial problems that could be solved via coding and my research found that on 28 May 2023, a wildfire started inside Westwood Hills, a subdivision in Upper Tantallon, Nova Scotia. Within four hours it had taken 128 homes. 16,400 people were told to leave, and Halifax's own report on the evacuation found residents exposed to life-threatening conditions after becoming stuck in a traffic bottleneck trying to get out.
On paper the subdivision had two exits. I measured the distance between them myself: 318 metres, both feeding onto the same road. Residents had been asking for another way out for years. Afterwards, Halifax approved a $2.7 million emergency exit, which wasn't finished in time for the following fire season.
What struck me was that nobody had counted. Every building over a certain occupancy is required to have more than one fire exit, positioned far enough apart that one fire can't block them all. Neighborhoods have no equivalent rule. New Brunswick's subdivision regulation caps a cul-de-sac at 180 meters and says nothing about how many buildings can sit behind a single exit. California made this a legal requirement after the 2018 Camp Fire in Paradise, SB 99 requires cities to identify residential developments without at least two evacuation routes. Canada has no equivalent.
What it does
Egress asks one question: if a road becomes unavailable, who can no longer reach a major road?
The vulnerability scan needs no hazard at all. It sweeps a 50 m blocked area across every road at 50 m intervals and records, at each position, how many mapped buildings lose their route to a qualifying collector or arterial road. Neighborhoods of 30+ mapped buildings come back red, amber, or not assessed, with the specific choke point identified.
You can move the blockage yourself, drag it anywhere on the road network and vary its radius from 25 to 300 m, to see how sensitivity changes with position and scale.
Hazard scenarios take a supplied extent instead of a swept one. Fire: place an area anywhere, or load the real mapped 2023 Tantallon burn perimeter (817.8 ha, NRCan NBAC). Flood: supply a Fredericton river gauge level, converted from CGVD28 to CGVD2013, with inundation that must connect through valid low terrain to the river channel rather than a naive fill.
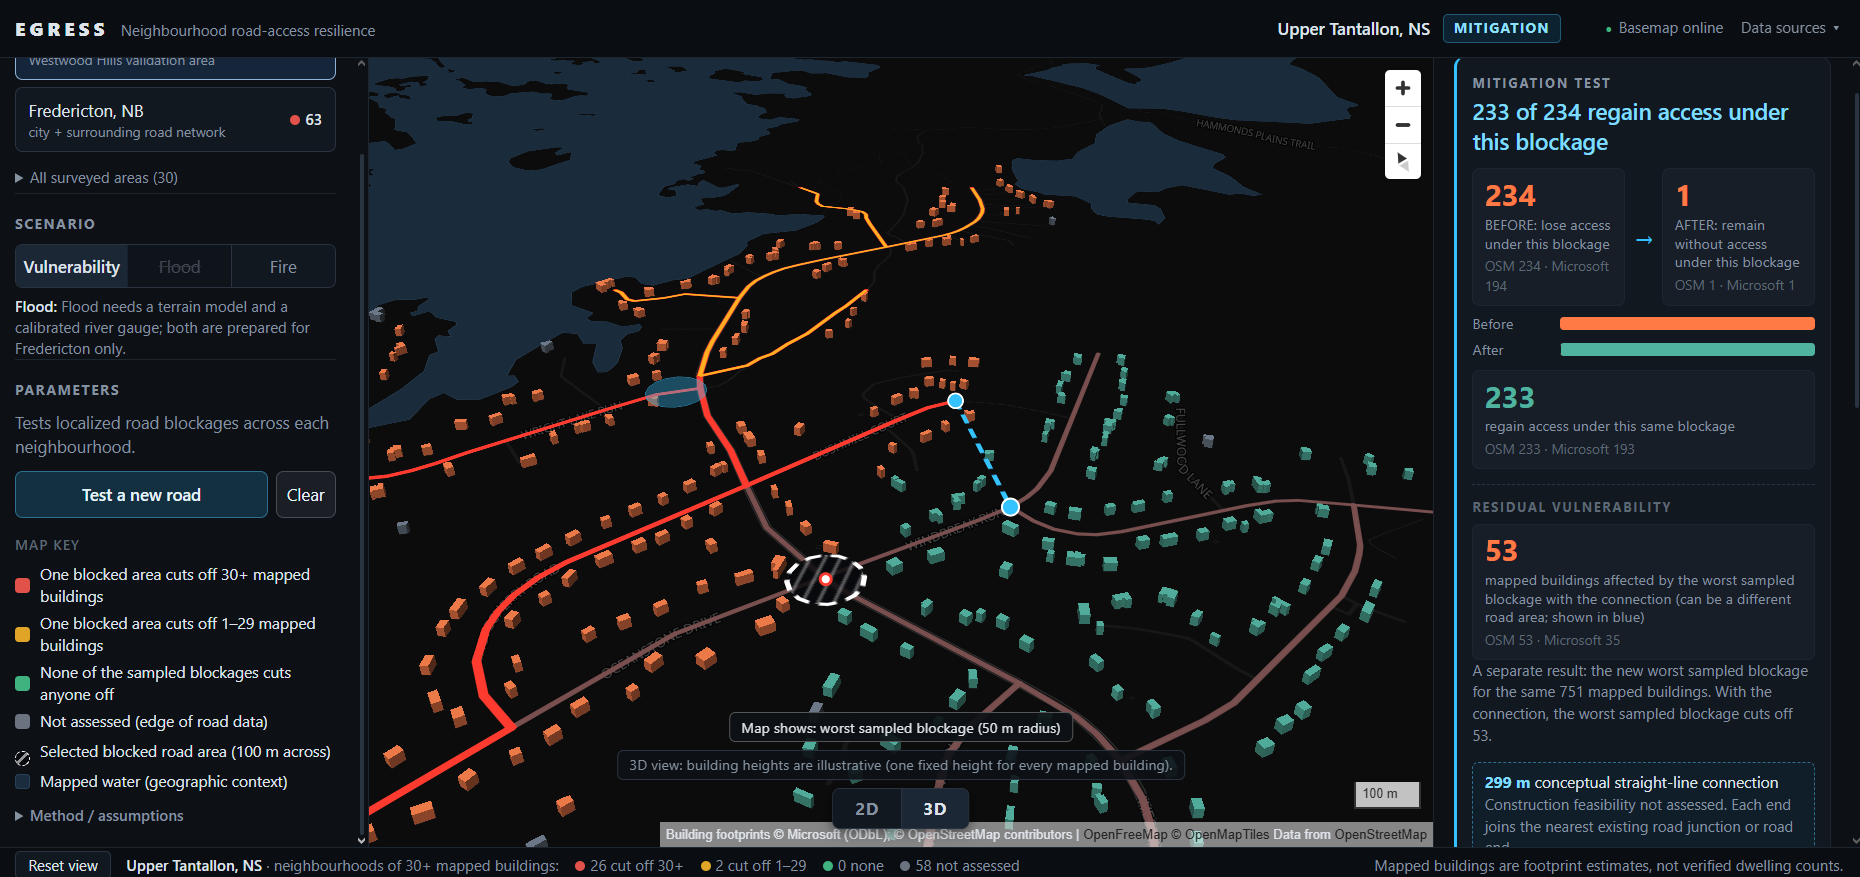
The mitigation test is the part a city actually needs. Draw a proposed connection and it reports how many mapped buildings regain access, and the residual worst case afterwards, so it never claims the problem is solved.
How I built it
Data pipeline first and foremost. Road networks are cut from Geofabrik provincial OSM extracts with osmium, using the complete-ways strategy so roads crossing a study-area boundary keep all their nodes a truncated way would create a fake dead end, which for this project is a false positive. Those cuts are built into graphs with OSMnx. I verified the topology survived extraction by confirming that the Westmorland Street Bridge shares no nodes with the roads passing beneath it; an overpass treated as a junction would make the network look far better connected than it is.
Everything downstream runs in EPSG:2953, the New Brunswick Stereographic Double Projection, so every distance and buffer is in metres rather than degrees.
Buildings come from two independent sources, OpenStreetMap and Microsoft's open Canadian footprints, kept in separate files and never summed. Elevation is NRCan's 2024 HRDEM Fredericton corridor survey in CGVD2013, read as a Cloud Optimized GeoTIFF over HTTP rather than downloading the 51.8 GB source. Fire perimeters come from NRCan's CWFIS WFS endpoint.
Stack. Python 3.11 with GeoPandas, Shapely, NetworkX and Rasterio for the analysis; FastAPI and Uvicorn for the API. The frontend is MapLibre GL JS with fill-extrusion for the 3D view. No database, flat files throughout. Everything is local so the tool runs without internet, and the basemap degrades to a built-in dark style if tiles can't be reached.
Testing. The analytical core was frozen early and every later change had to leave it untouched. Testing ran at five levels:
Unit and regression. A Python suite over the engine, plus browser suites covering the probe, mitigation, fire, flood, 3D, transitions, area picker and cross-area behavior, around 90 checks, run in real Chrome rather than headless after the flood suite turned out to need four minutes to complete.
Equivalence. The radius control needed a wrapper the frozen engine didn't expose, so I proved the copy identical to the original across all 562 Westwood scan sample points rather than assuming it.
Validation against ground truth. It flags the neighborhood that burned in 2023, and leaves a well-connected downtown grid at single-digit losses. The flood model reproduces the documented 2008 event in both directions covering Officers' Square at the peak, leaving the streets dry at flood stage.
Adversarial audit. Every phase was reviewed by an independent auditor with no authority over the architecture, whose job was to construct sequences the implementation hadn't anticipated. It found real defects each time: buildings' physical location confused with road attachment, winding-road blockage intervals collapsed, the mitigation test comparing different building populations, async races where a late response could overwrite newer state, and one case where a neighborhood's numbers could be displayed under a different area's name. Each was fixed, then re-verified against the auditor's exact reproduction steps.
Independent reproduction of published numbers. Before quoting the 30-area survey, every area was re-run independently and checked against the committed results, status, cohorts, gateways, ranks, along with geometric checks that no two study boxes overlap and no neighbourhood is double-counted. The audit also rejected two claims I'd intended to make: that the survey total was a guaranteed floor, and that results were independent of how study boxes were drawn. Both were reworded to what the evidence actually supports.
The survey outputs are committed to the repository, so every figure in this submission can be checked against the data it came from.
Challenges I ran into
The validation case didn't say what I assumed. I built the pitch around "one fire blocked both exits" then pulled the actual burn perimeter and found both entrances roughly a kilometre outside it. That forced a real reframing, and the honest version turned out to be stronger.
The vertical datum: The Fredericton river gauge reports CGVD28; the elevation model is CGVD2013 — about half a metre apart. Getting this wrong produces a flood map that looks completely convincing and is wrong by metres.
Roads that lie: Westwood Boulevard is tagged tertiary but functions as an internal subdivision spine, so simply reaching a tertiary road wasn't sufficient. I added a global rule: a qualifying road only counts as a way out if it provides onward access through the broader qualifying network.
Independent audit found real bugs every single time: population mismatches in the mitigation comparison, async races in the UI, and one case where an old neighborhood's numbers could be displayed under a new area's name.
Accomplishments that I am proud of
The project validates itself which is huge. Against a real event, it flags Westwood Hills, where Halifax independently reached the same conclusion and spent $2.7M on a second exit. Worth being precise: the fire never reached the two entrances, they were 0.96 km and 1.22 km outside the mapped perimeter. Tantallon was a capacity failure caused by a connectivity condition. This tool finds the condition.
Westwood reproduces identically in the original Tantallon study box and in the far larger HRM box — 751/680 mapped buildings, 234/194 losing access, identical road endpoints, building centroids and gateways, and the same choke point to zero metres.
It also validates against discrimination: A tool that flags everything says nothing. Three road clusters in Fredericton, same parameters: the downtown Town Plat (surveyed in 1785) has 9 connections and its worst blockage cuts off 3; New Maryland, the largest of the three at 826 mapped buildings, has 7 connections and loses 21; Douglas on the suburban fringe has 2 connections and loses 416. It isn't measuring size, it's measuring ways out.
At Westwood Hills: OpenStreetMap 751, Nova Scotia's own civic address file 717, Microsoft footprints 680. Three independent datasets within 5%. Addresses aren't buildings, so it's corroboration rather than ground truth.
The flood model covers Officers' Square at the 2008 peak (8.36 m gauge — where kayakers were photographed) and leaves the streets dry at flood stage, which is also what happened.
What I learned
There is always room for more and that the hardest part of a geospatial tool isn't the algorithm, it's knowing what your data doesn't contain. Rural OpenStreetMap building coverage collapses: at Pointe-Sapin it shows 160 buildings across 30 km of inhabited coast, where the province's own civic address record shows about 1,589 residences. If you used one source you'd conclude nobody lives there.
And that stating your limitations plainly is more persuasive than hiding them.
What's next for EGRESS
The idea of capacity modelling, California splits route identification (SB 99) from route capacity assessment (AB 747); this is the first. Running the same computation in reverse to ask whether emergency vehicles can get in, since egress failure is ingress failure. Exit remoteness as a computed ratio, using the fire code's standard that two accesses be at least half the served area's diagonal apart. Live fire perimeters, which NRCan publishes daily. And an address-level version for municipal use, deliberately not built here, because a public tool listing specific residential addresses as "will lose access" is a different product with a different privacy question.
Built With
- fastapi
- gdal
- geopandas
- javascript
- maplibre-gl-js
- networkx
- openstreetmap
- osmium
- python
- rasterio
- shapely

Log in or sign up for Devpost to join the conversation.