-
-
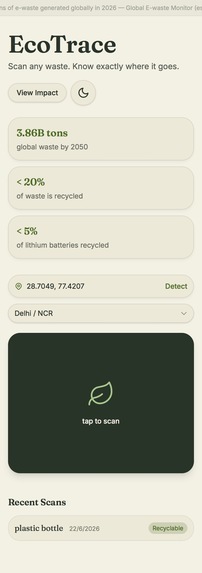
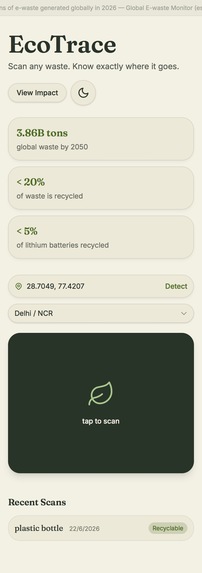
EcoTrace installed as a PWA on mobile — full native app experience, no app store needed. Live location detection and one-tap scanning.
-

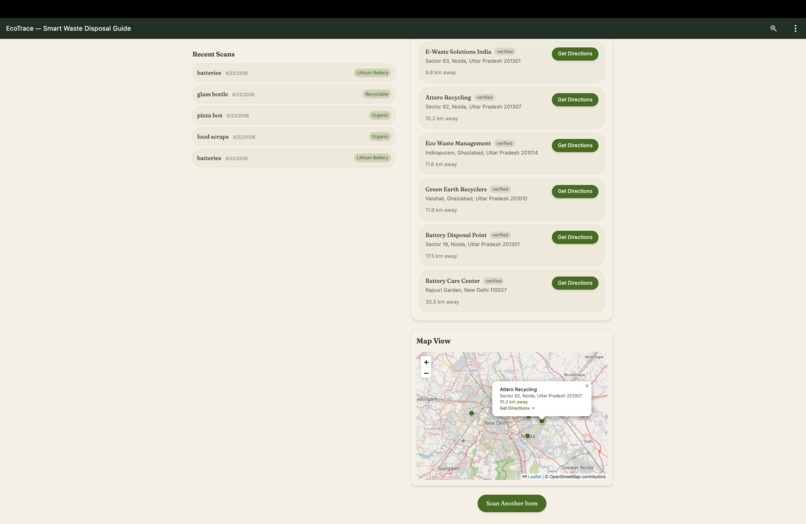
Verified collection points sorted by distance, one-tap directions, and an interactive map showing all nearby drop-off locations.
-
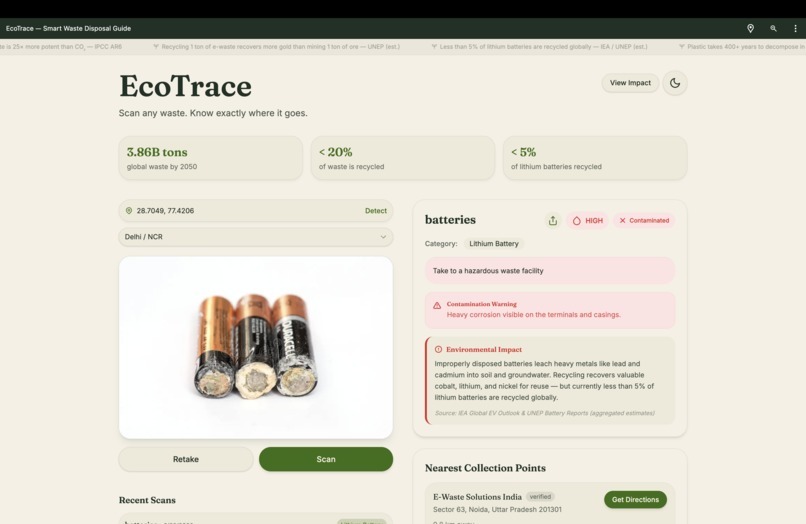
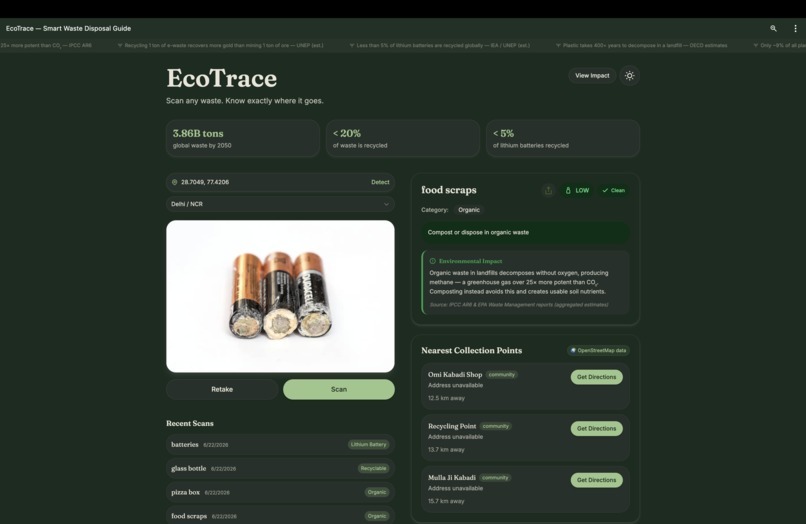
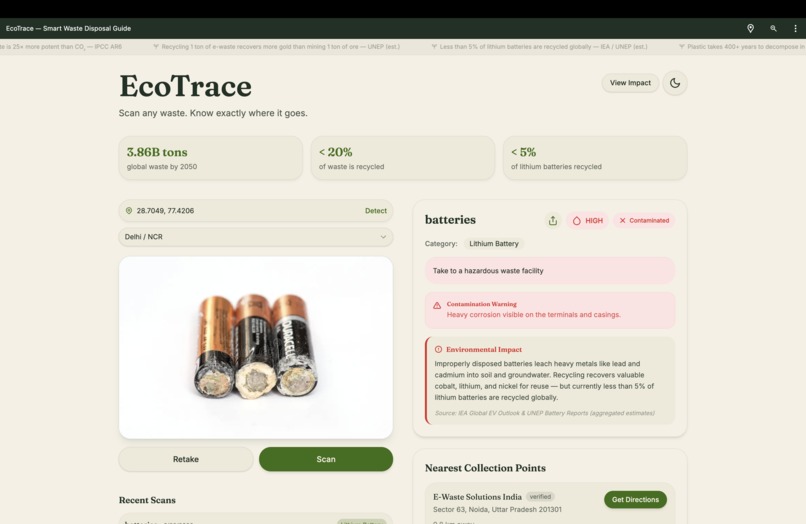
Corroded batteries: High Hazard, Contaminated. Disposal instructions, impact data & nearest verified collection points — instantly
-

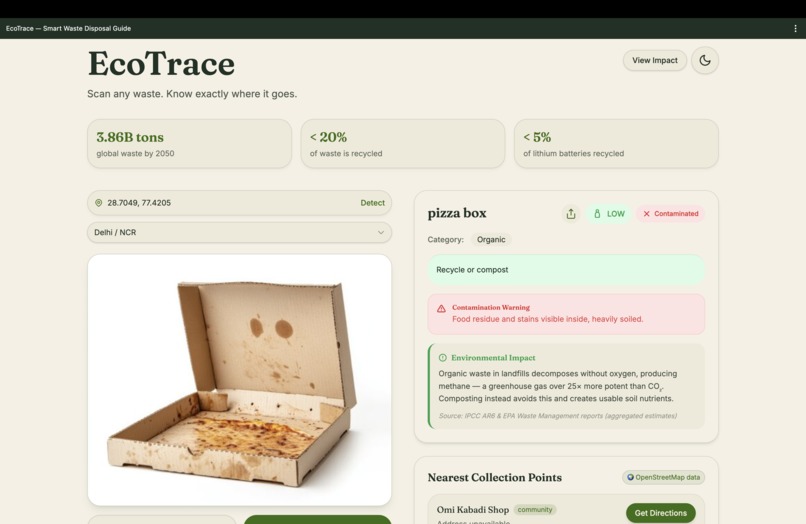
Contamination detected on a greasy pizza box — food residue flagged before it reaches a facility and ruins an entire recycling batch.
-
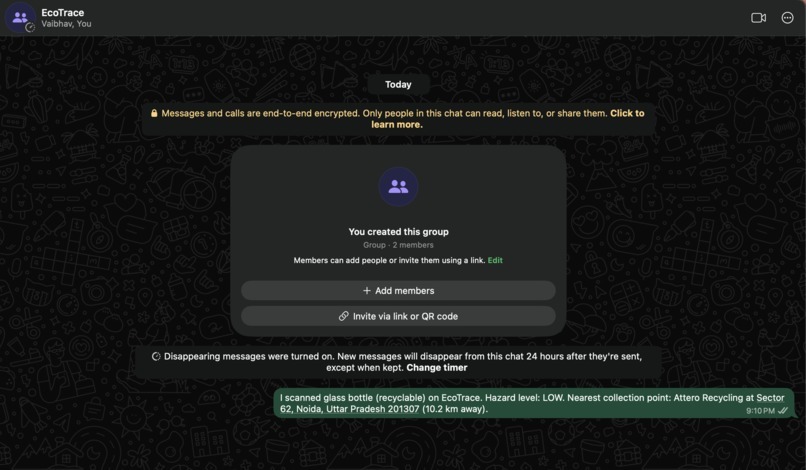
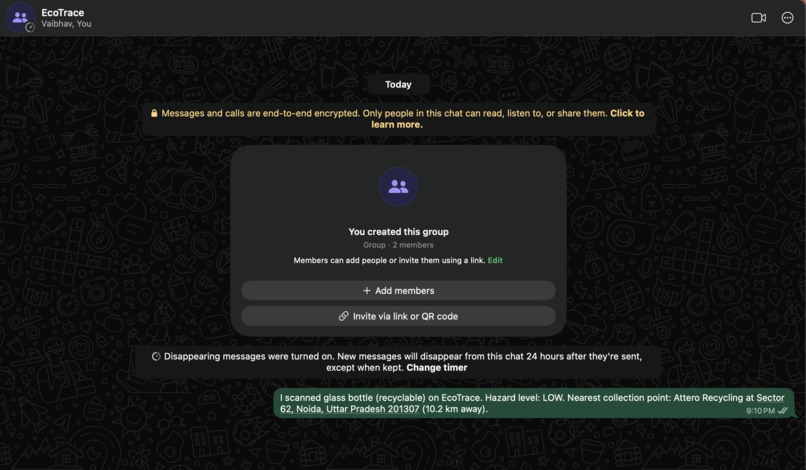
Scan results shared to WhatsApp via Web Share API — pre-filled with item, category, hazard level, and nearest collection poin
-
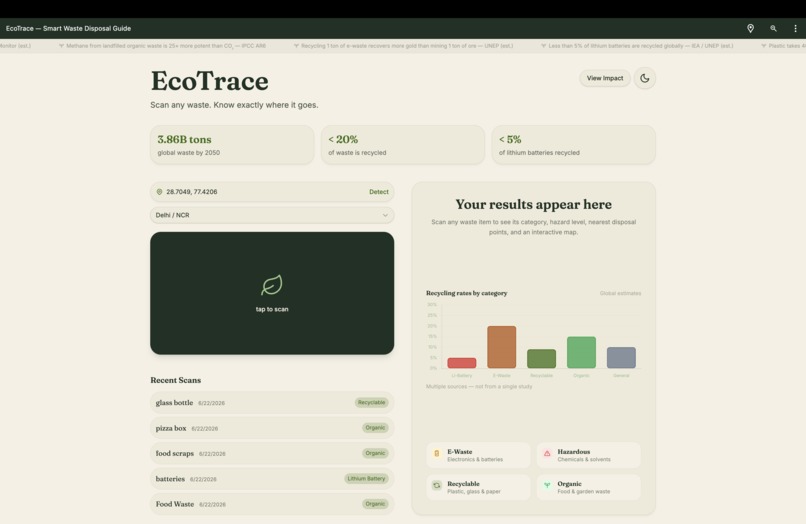
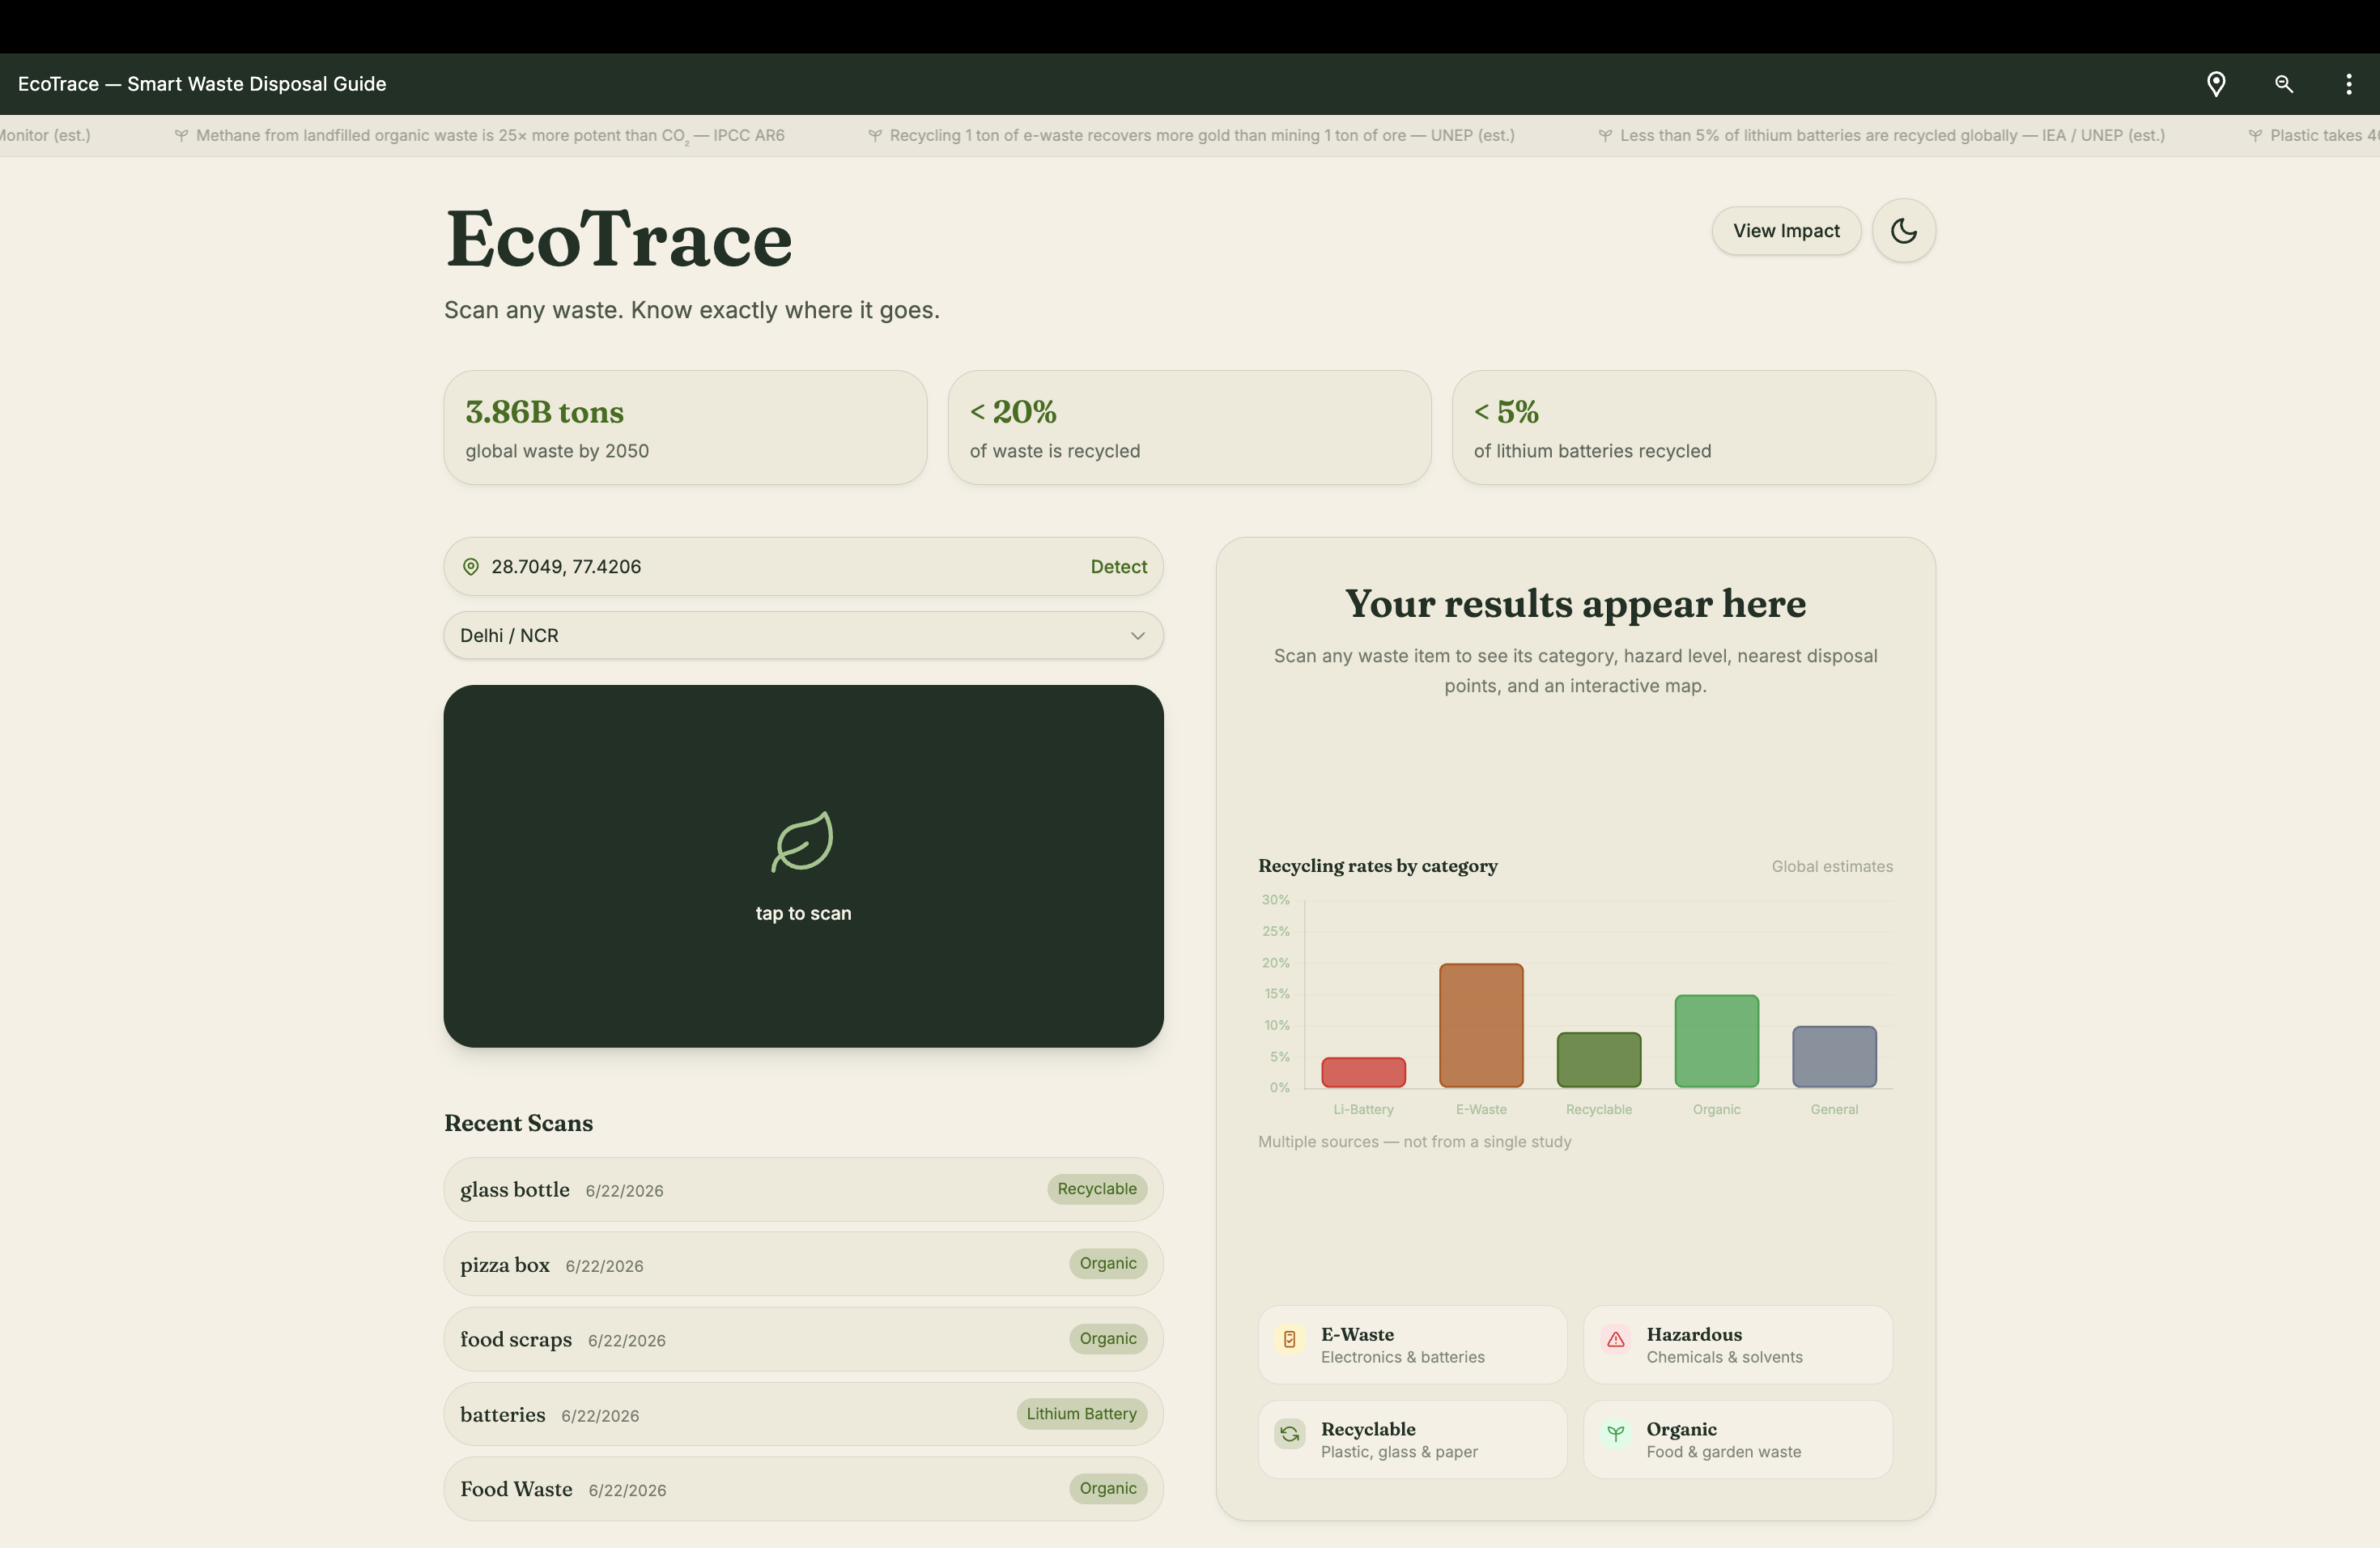
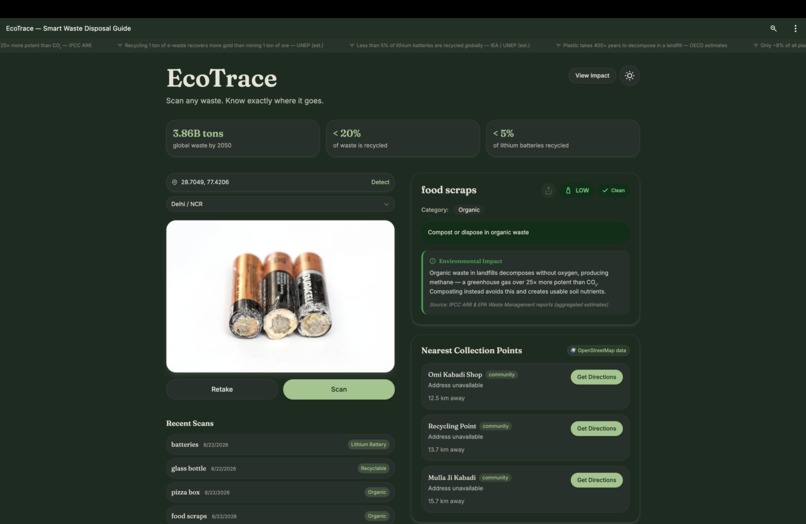
AI waste classifier with live location, scan interface, recent history, and global waste stats in one view.
-
Dark mode: food scraps — Organic, Low Hazard, Clean. Composting guidance shown with OpenStreetMap community collection point fallback.
-
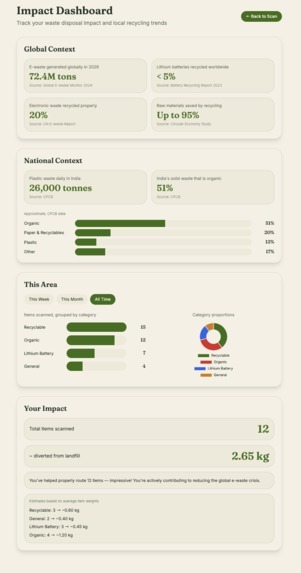
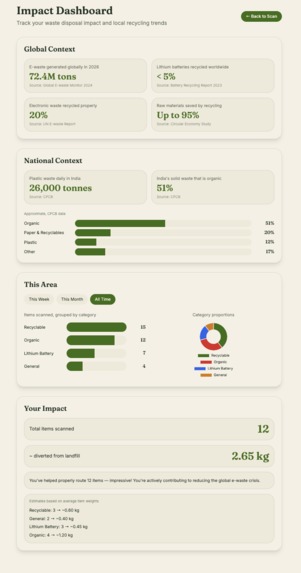
Impact Dashboard Global stats, India CPCB data,area scan breakdown & personal impact 2.65 kg diverted from landfill across 12 items scanned.
Inspiration
Every year, 62 million tonnes of e-waste is generated globally — yet less than 22.3% is formally recycled. In India, the situation is worse: the country generates 160,038 tonnes of solid waste daily, with a formal e-waste recycling rate of just 1% compared to 42.5% in Europe.
The problem isn't that people don't care. The problem is they don't know where to go.
There is no open, accessible registry of certified waste collection points in India. CPCB maintains a list of registered recyclers, but it's buried in compliance portals — not something a regular person can use at the moment they're holding a dead phone battery wondering what to do with it.
We also noticed something most waste apps ignore: contamination. A single greasy pizza box can cause an entire batch of recyclables to be rejected at a facility. People don't know this — and there's no tool that tells them.
EcoTrace was built to solve the last-mile disposal problem — for every category of waste, not just e-waste.
What It Does
EcoTrace is an AI-powered waste classification and disposal routing platform.
The Core Flow
- Snap or upload a photo of any waste item
- Groq Vision (Llama 4 Scout) classifies it and detects contamination status
- Google Gemini enriches the result with disposal guidance, contamination explanations, and sustainability insights
- The app finds the nearest verified collection or recycling point using the user's location
- An interactive Leaflet map displays nearby facilities and directions
- Personal environmental impact is tracked and visualized on the Impact Dashboard
Key Features
- AI-powered waste classification across six waste categories
- Contamination detection — clean / needs rinsing / contaminated
- Context-aware disposal guidance generated using Gemini
- Hybrid location matching — verified Supabase database + OpenStreetMap Overpass fallback
- Interactive Leaflet map with live location pin and collection point markers
- Scan history synced to Supabase with anonymous UUID tracking
- Impact Dashboard with personal and community-level environmental metrics
- PWA installable with camera capture and mobile-first experience
- WhatsApp sharing via Web Share API
- Dark mode with localStorage persistence
Impact on Education
Most people misclassify waste not out of carelessness, but because waste literacy is never formally taught. Recycling rules are inconsistent and unintuitive, and static "what goes where" charts rarely stick. EcoTrace closes this gap by turning every disposal decision into a micro-lesson.
Learning through use. When a user photographs an item, EcoTrace doesn't just output a label — it explains why the item belongs to a material category and how it should be handled. Instant, contextual feedback on real objects is how durable learning happens.
Building independence, not dependence. With repeated use, users start recognizing categories on their own. The goal of any good educational tool is to make itself unnecessary — EcoTrace is designed around that principle.
Civic and infrastructure awareness. The Leaflet.js + OpenStreetMap routing layer shows users the recycling infrastructure that already exists in their neighborhoods — knowledge most residents never acquire.
Classroom-ready. Teachers can use EcoTrace in environmental science lessons: students test real objects and receive instant, explained feedback — far more engaging than memorizing bin charts.
Every scan is a lesson. Every lesson compounds into waste literacy.
Six Waste Categories Supported
| Category | Hazard Level | Real-world Impact |
|---|---|---|
| Lithium Battery | High | Less than 5% recycled globally; toxic metals can contaminate groundwater |
| E-Waste | Medium | Contains valuable recoverable materials including gold and rare metals |
| Hazardous | High | Paints, pesticides, and CFLs can pollute soil and water systems |
| Recyclable | Low | Proper segregation significantly increases recovery rates |
| Organic | Low | Landfilled organic waste produces methane emissions |
| General | Medium | Mixed waste is the hardest category to recover effectively |
A standout feature is contamination detection, which flags whether an item is recyclable as-is, requires cleaning, or is too contaminated for processing. This directly addresses one of the largest real-world causes of recycling batch rejection.
How We Built It
Frontend
Built with SvelteKit + Svelte 5 (Runes Mode) using TypeScript and Tailwind CSS. We designed a custom eco-inspired visual system using forest green, moss, and warm paper color palettes with a fully responsive mobile-first interface. The application is PWA-ready and supports direct camera capture.
AI Classification & Guidance
We implemented a multi-model AI pipeline:
- Groq API (Llama 4 Scout Vision) performs image-based waste identification, hazard assessment, and contamination detection.
- Google Gemini acts as an intelligence layer that transforms classification results into actionable guidance, generating disposal recommendations, contamination explanations, recycling instructions, and environmental impact insights.
The system returns structured outputs including:
- Item name
- Waste category
- Hazard level
- Disposal instructions
- Contamination status
- Contamination notes
- Sustainability guidance
Robust JSON validation and fallback parsing ensure reliability even when model outputs vary.
Database
Supabase (PostgreSQL) powers the backend through two primary tables:
collection_points— verified recycling and disposal organizationsscan_history— anonymous UUID-based scan tracking for impact calculations
Location Matching
A hybrid approach combines:
- Verified collection points stored in Supabase
- OpenStreetMap Overpass API as a fallback source
- Nominatim geocoding for address resolution
- Haversine distance calculations for nearest-point ranking
This ensures nationwide coverage even when curated data is unavailable.
Maps
Built using Leaflet.js and OpenStreetMap tiles.
Features include:
- Live user location
- Collection point markers
- Auto-fit map bounds
- Distance calculations
- Google Maps navigation links
Impact Dashboard
Chart.js visualizations display:
- Personal waste diversion metrics
- Community scan activity
- Global waste statistics
- India-specific CPCB waste data
Impact calculations are estimated using category-specific average weights:
Impact (kg) = Σ(Category Count × Average Category Weight)
This allows users to see a tangible estimate of waste diverted from landfills through responsible disposal.
Deployment
Deployed on Vercel with automatic CI/CD deployment from the main branch.
Challenges We Faced
Lack of Public Recycling Infrastructure Data
India does not provide an easily accessible public API for certified recyclers or collection centers.
To solve this, we manually verified organizations such as Attero Recycling, Saahas Zero Waste, and NDMC facilities before building our own curated database. OpenStreetMap Overpass serves as a dynamic fallback.
Reliable AI Output Formatting
Obtaining consistent structured outputs from vision models required significant prompt engineering and defensive parsing.
Handling malformed JSON, markdown-wrapped responses, and missing fields became an important engineering challenge.
SvelteKit + Leaflet SSR Issues
Leaflet is browser-dependent and conflicts with server-side rendering.
We resolved this through client-only initialization using onMount and conditional rendering strategies.
Location Coverage Across Cities
Many smaller cities lacked verified collection point information.
The hybrid Supabase + OpenStreetMap architecture helped maintain functionality across diverse geographic regions.
What We Learned
- Designing reliable multi-model AI workflows that combine vision and reasoning models
- Building resilient JSON-driven AI pipelines
- Architecting hybrid geospatial systems using curated and open-source datasets
- Managing production-ready SvelteKit applications with Svelte 5 runes
- Understanding India's waste management ecosystem, EPR regulations, and informal recycling networks
- Recognizing contamination as one of the most overlooked barriers to effective recycling
What's Next
- CPCB Registry Integration for live verified recycler data
- Full Hindi and regional language support
- Gemini-powered conversational sustainability assistant
- Kabadiwala pricing and grading tools
- Offline-first support using service workers
- Community-contributed and verified collection points
- Impact-based gamification and sustainability rewards
Statistics referenced from Global E-Waste Monitor, CPCB Annual Reports, UNITAR, IPCC AR6, World Bank, and other publicly available sustainability datasets.
Built With
- chart.js
- groq
- leaflet.js
- llama-4-scout
- nominatim
- openstreetmap
- overpass-api
- postgresql
- supabase
- svelte-5
- sveltekit
- tailwind-css

Log in or sign up for Devpost to join the conversation.