Inspiration
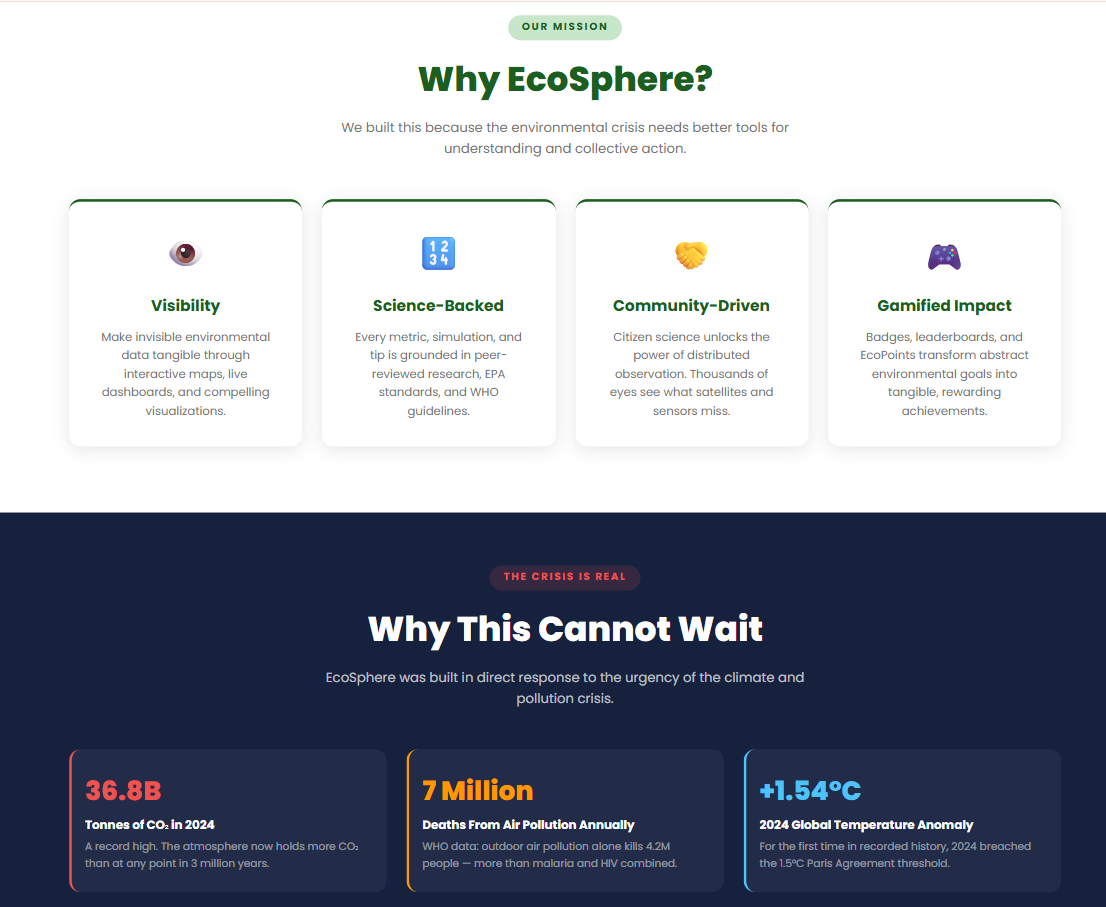
Climate change data is everywhere, but meaningful action is not. While people are constantly exposed to headlines about air pollution, rising temperatures, and environmental degradation, there is often a disconnect between awareness and action. Most platforms present information in a way that feels overwhelming or impersonal, leaving users unsure of what they can actually do.
We were inspired by this gap and set out to build a solution that makes environmental data more accessible, personal, and actionable. Our goal was to create a platform that not only informs users, but also empowers them to make measurable, everyday decisions that contribute to sustainability.
What It Does
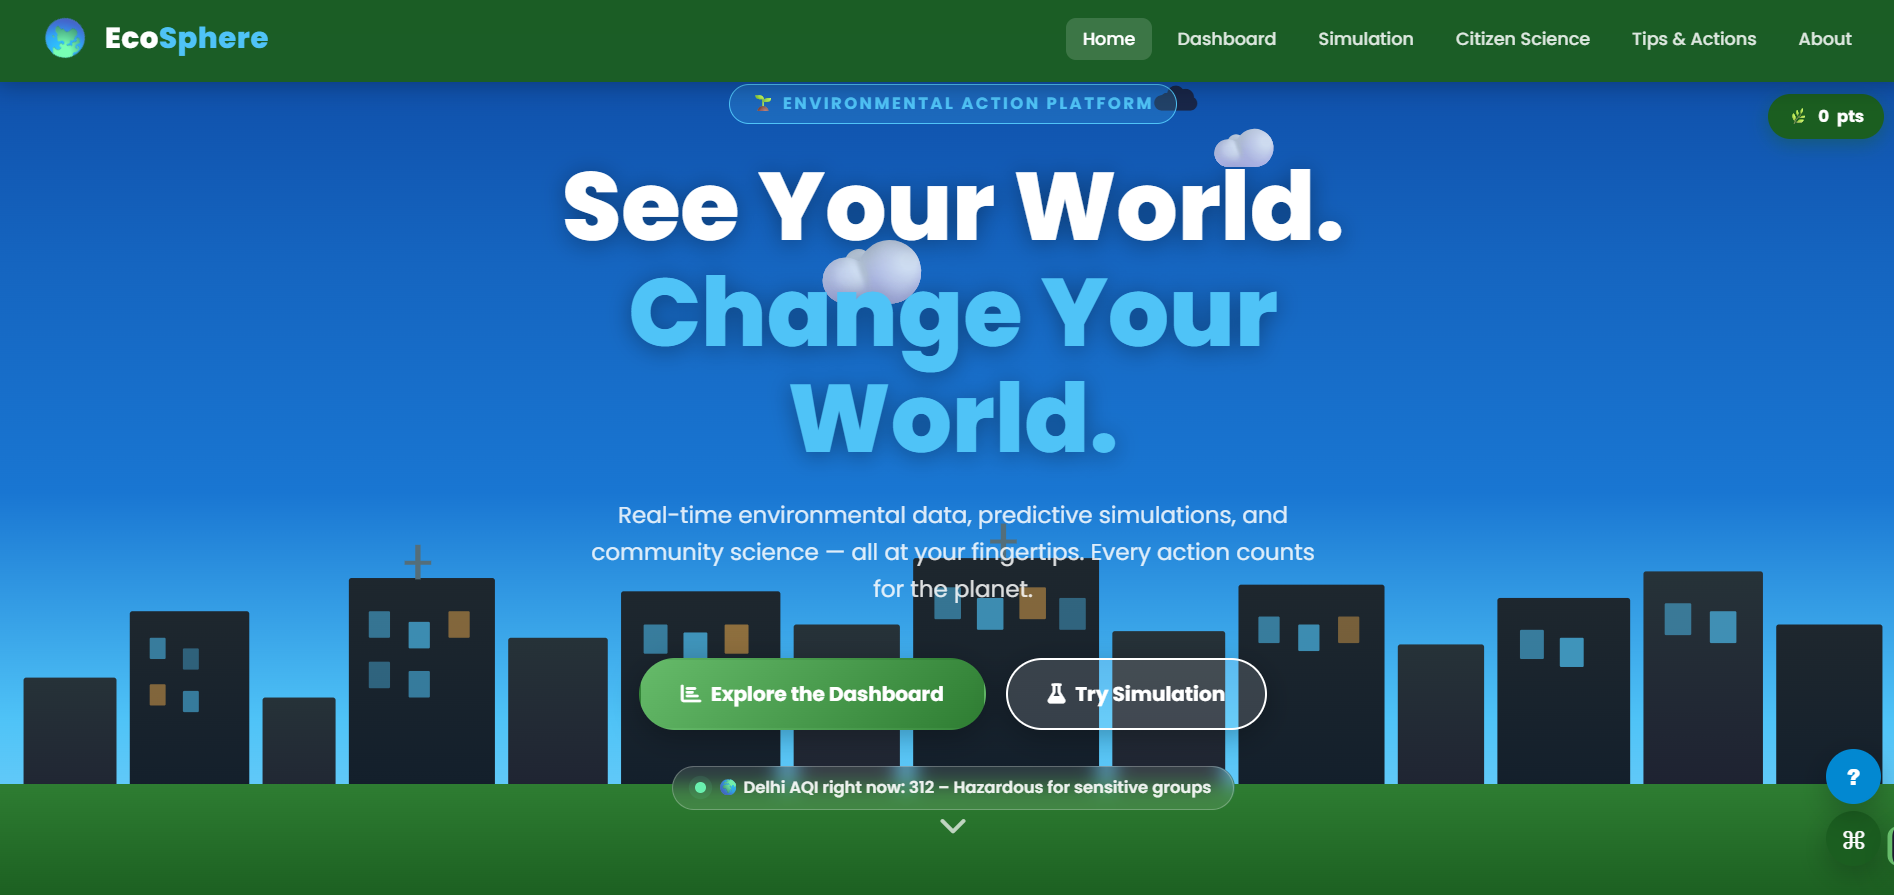
EcoSphere is an interactive environmental intelligence platform designed to help users understand, improve, and actively engage with the environment. Instead of presenting static data, the platform transforms complex environmental information into intuitive, interactive experiences.
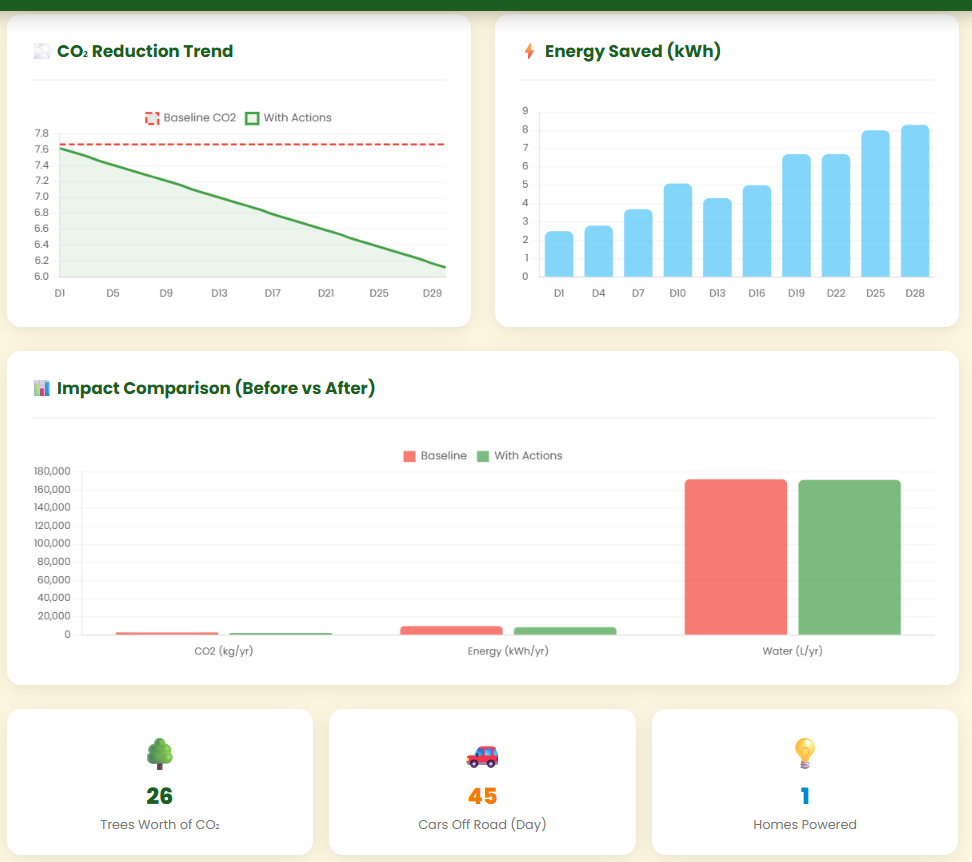
Users can explore live-style dashboards covering air quality, water conditions, energy usage, and carbon emissions, allowing them to better understand environmental trends. A personalized simulation engine enables users to test “what-if” scenarios, helping them see how individual actions—such as reducing energy consumption or transportation emissions—can impact their overall footprint.
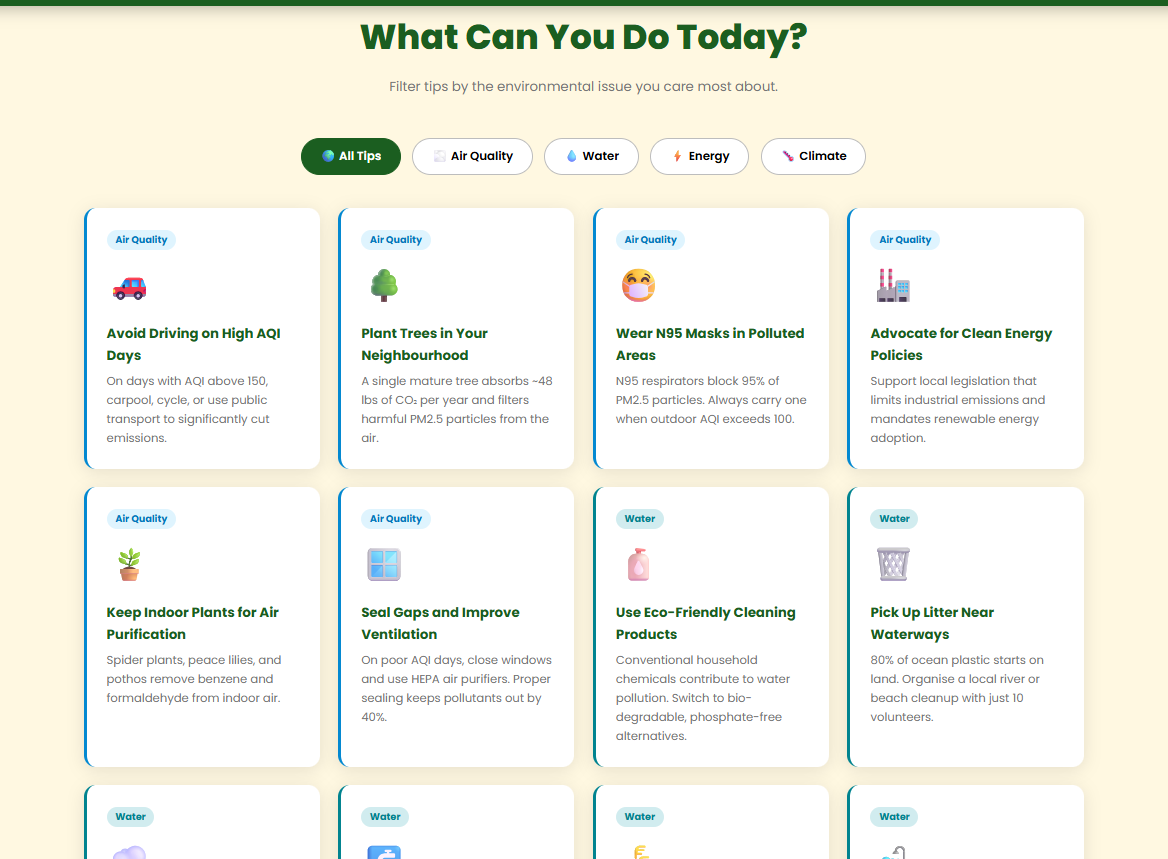
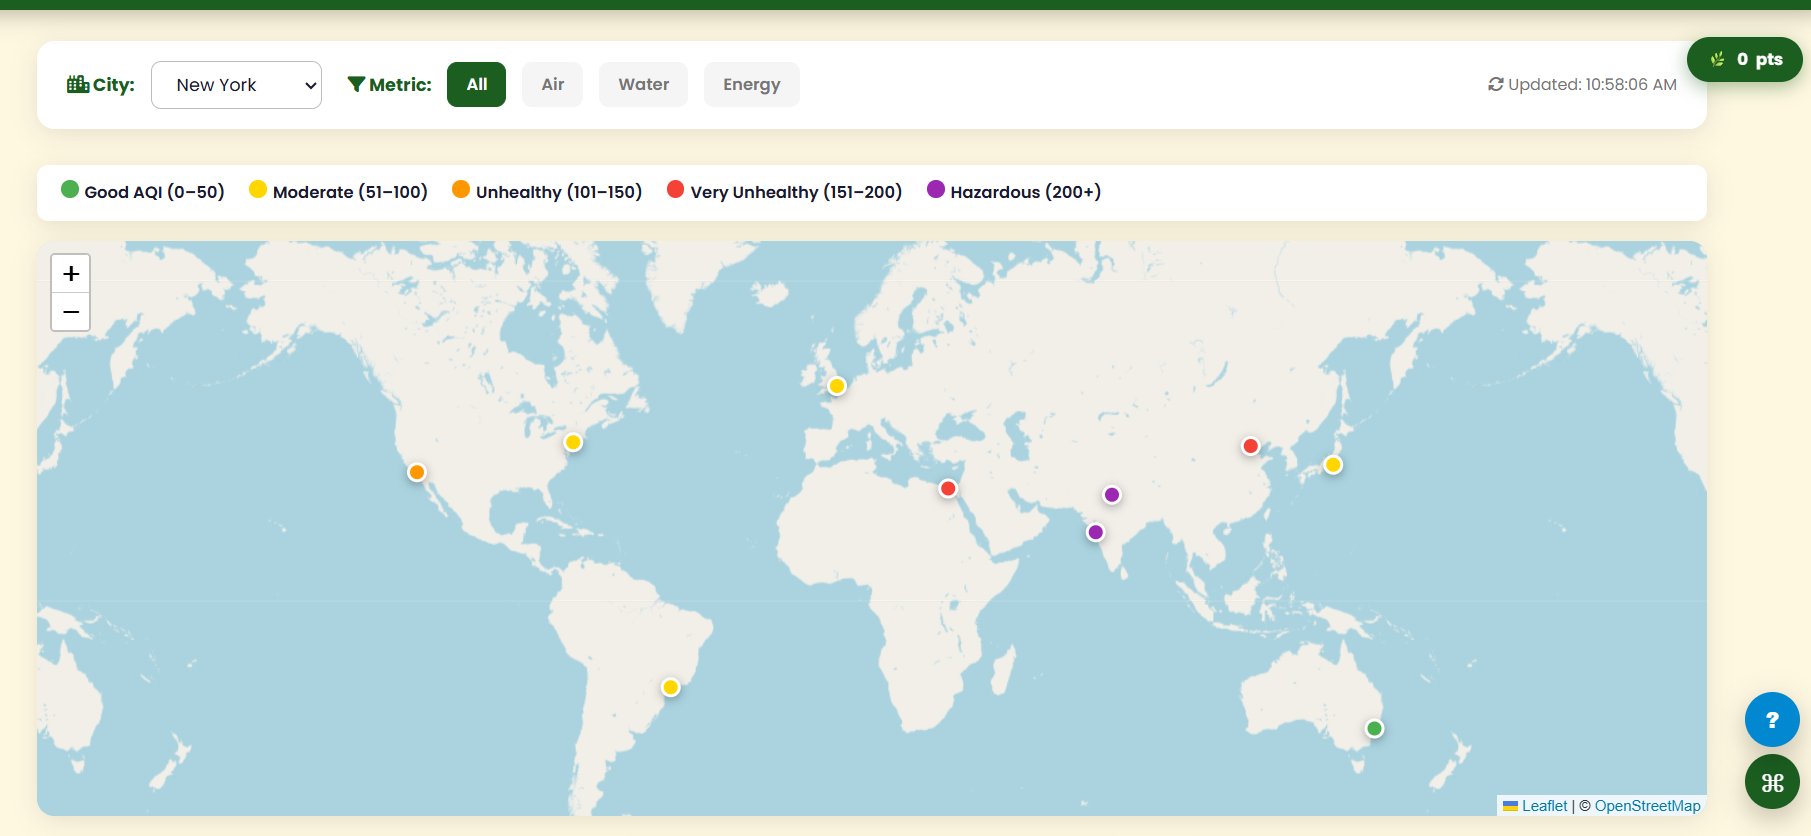
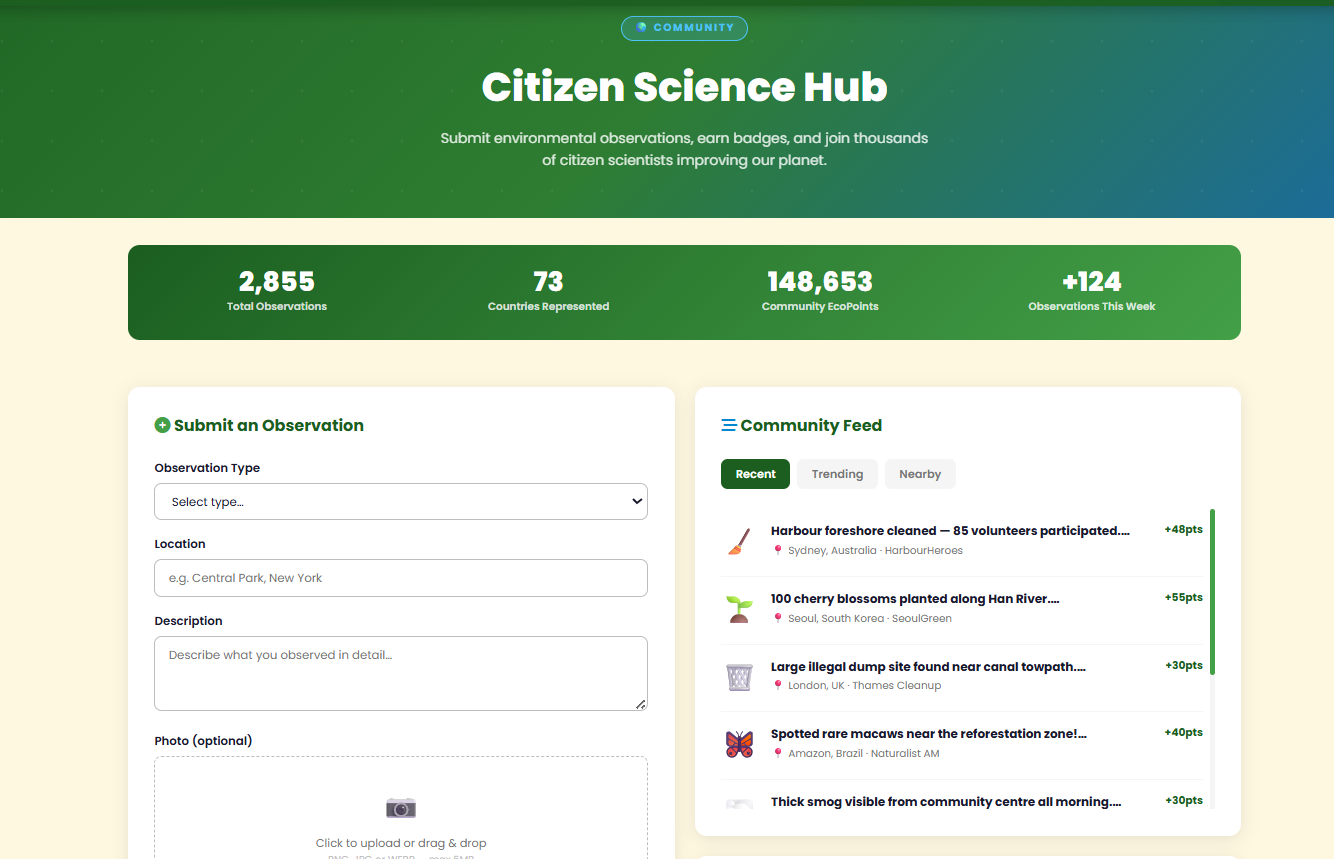
In addition, EcoSphere includes a citizen science component where users can contribute environmental observations through a map-based interface, fostering community engagement. The platform also incorporates daily challenges, practical sustainability tips, and quiz-based learning to reinforce behavior change. Gamification elements, such as EcoPoints and achievement badges, further motivate users by rewarding consistent participation and progress.
How We Built It
We developed EcoSphere as a modular, multi-page web application with a focus on performance, scalability, and user experience. The architecture follows a frontend-first approach, enabling fast load times and straightforward deployment.
To ensure consistency across the platform, we implemented a shared design system using reusable styling components and design tokens for color, spacing, and transitions. Each major feature—such as dashboards, simulations, citizen science reporting, and educational content—was built as a separate module while maintaining a unified interface.
On the technical side, we implemented dynamic data visualizations using line, bar, and doughnut charts to represent environmental metrics in a clear and engaging way. We also integrated interactive mapping features to display global and community-driven environmental data. A personalized carbon baseline calculator allows users to estimate their impact, while advisory logic translates technical metrics like AQI into practical, human-readable guidance.
To enhance usability, we added features such as keyboard-friendly navigation, command palette interactions, onboarding flows, and contextual help overlays. We also implemented local storage to persist user data, including EcoPoints, badges, and daily challenge progress. Network status indicators were included to provide transparency and reliability in both online and offline scenarios.
Challenges We Faced
One of the main challenges was balancing the depth of environmental data with usability. We needed to present meaningful and accurate information without overwhelming users or making the interface too complex. Achieving this required careful prioritization of what data to show and how to present it clearly.
Another challenge was designing the simulation system in a way that felt both realistic and understandable. Translating user actions into measurable environmental outcomes required thoughtful modeling and clear visual feedback.
Maintaining consistency across multiple modules was also a significant challenge. With many features and interaction patterns, it was important to ensure that all elements—such as buttons, layouts, and feedback systems—felt cohesive. Additionally, we had to avoid feature bloat by focusing on clarity and usability, especially for first-time users.
Finally, building trust with users required us to clearly distinguish between sample/demo data and real-world insights, ensuring transparency in how information is presented.
What We Learned
Through this project, we learned that effective climate technology is not just about providing data, but about making that data understandable and actionable. Clear design, intuitive interactions, and meaningful feedback play a crucial role in helping users engage with complex topics.
We also discovered that small design decisions—such as feedback messages, empty states, and labeling—can significantly impact user confidence and overall experience. Accessibility features, including keyboard navigation and clear visual hierarchy, proved to be essential components rather than optional enhancements.
Additionally, we learned that combining community participation with motivational systems, such as points and achievements, can significantly increase user engagement and long-term impact.
Impact Vision
EcoSphere is designed to make environmentally responsible behavior easier to understand and sustain over time. The platform emphasizes that even small individual actions can contribute to a larger collective impact.
This idea can be represented as:
$$ \Delta E_{total} = \sum_{i=1}^{n} \Delta e_i $$
where each ( \Delta e_i ) represents an individual’s measurable environmental improvement. By scaling these small actions across many users, the total impact becomes meaningful and significant.
Accomplishments We’re Proud Of
We are proud of building a comprehensive platform that transforms complex environmental data into an engaging and actionable experience. Rather than focusing on a single feature, we successfully integrated multiple systems—data visualization, simulation, community interaction, and gamification—into one cohesive product.
We are especially proud of the platform’s balance between functionality and usability, as well as completing the full development process from concept to a polished, working application.
What’s Next
Moving forward, we plan to enhance EcoSphere with more advanced and real-world capabilities. This includes integrating live environmental data APIs to provide up-to-date and location-specific insights.
We also aim to introduce geolocation-based reporting and improved moderation systems for community contributions. Additional features will include long-term personal impact tracking, allowing users to visualize their progress over time, as well as expanded localization and accessibility to reach a broader global audience.
Built With
- browser-localstorage
- chart.js
- css3
- firebase-hosting
- font-awesome
- git
- github
- google-fonts
- html5
- javascript
- leaflet.js
- openstreetmap


Log in or sign up for Devpost to join the conversation.