Inspiration
We wanted to use the data provided through Dallas OpenData to encourage citizens to take charge to change their communities for the better.
What it does
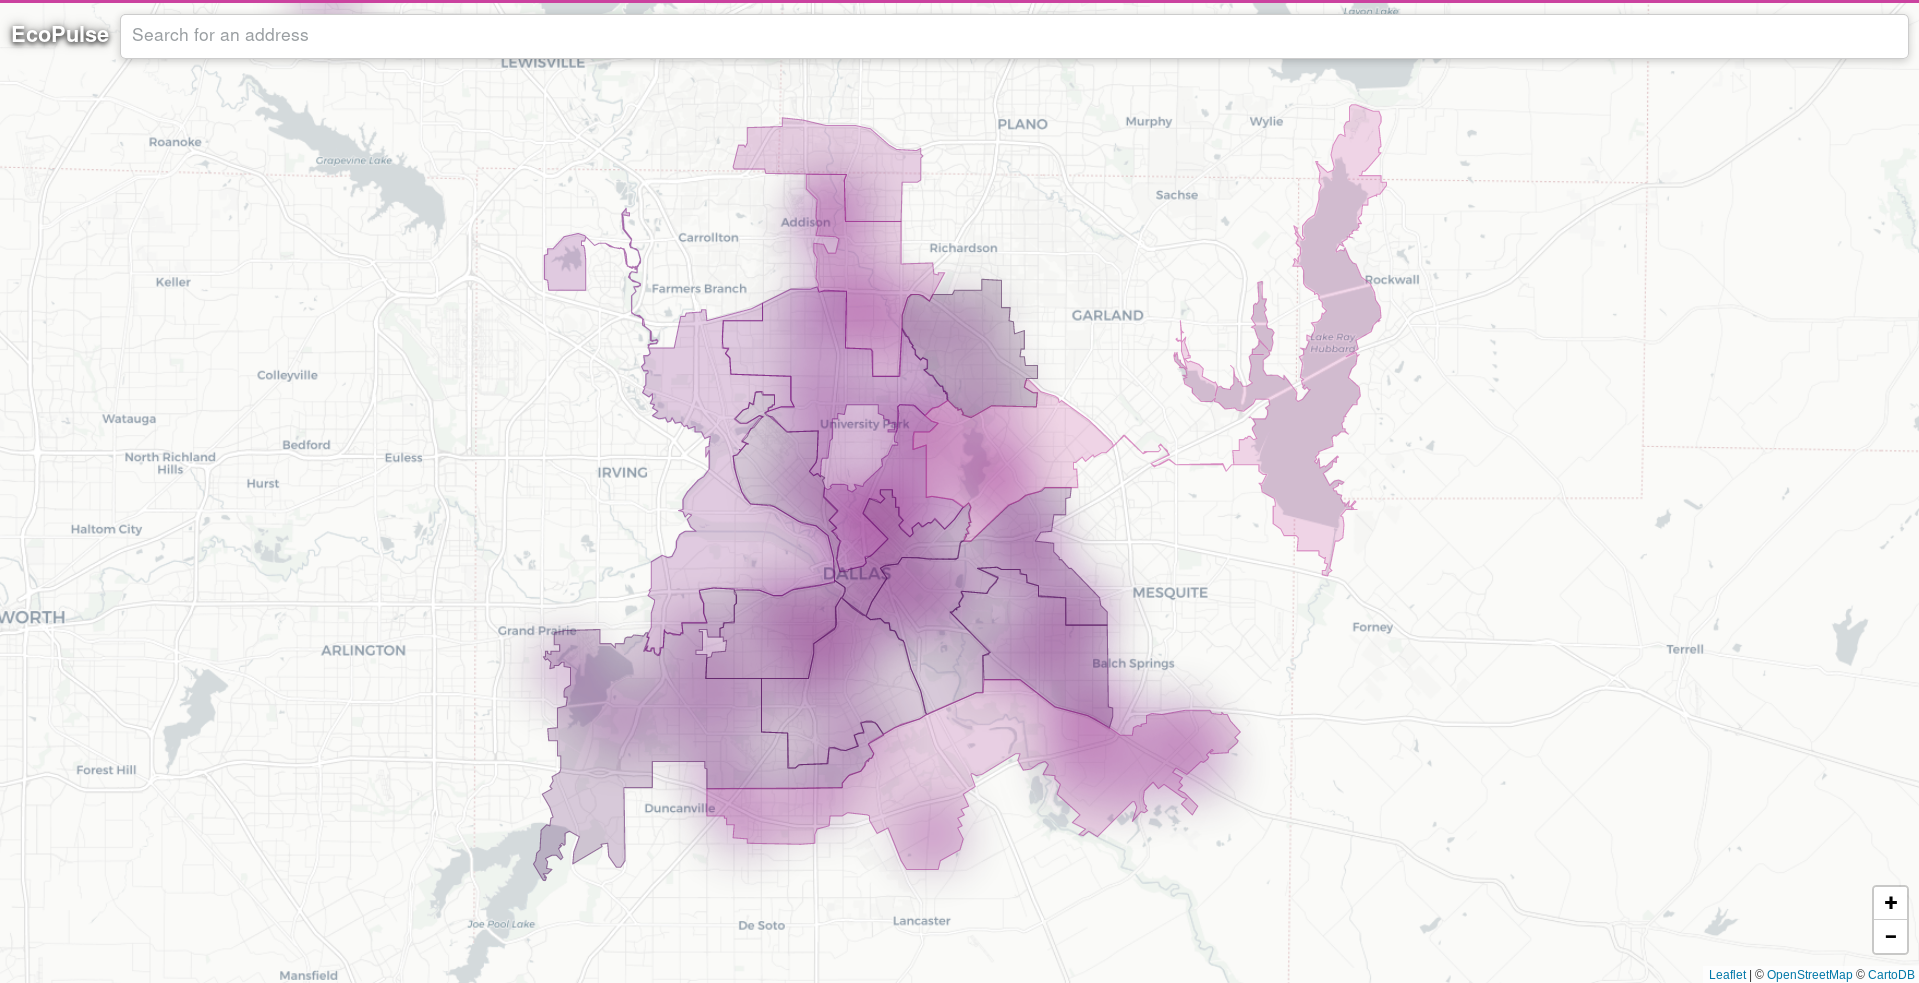
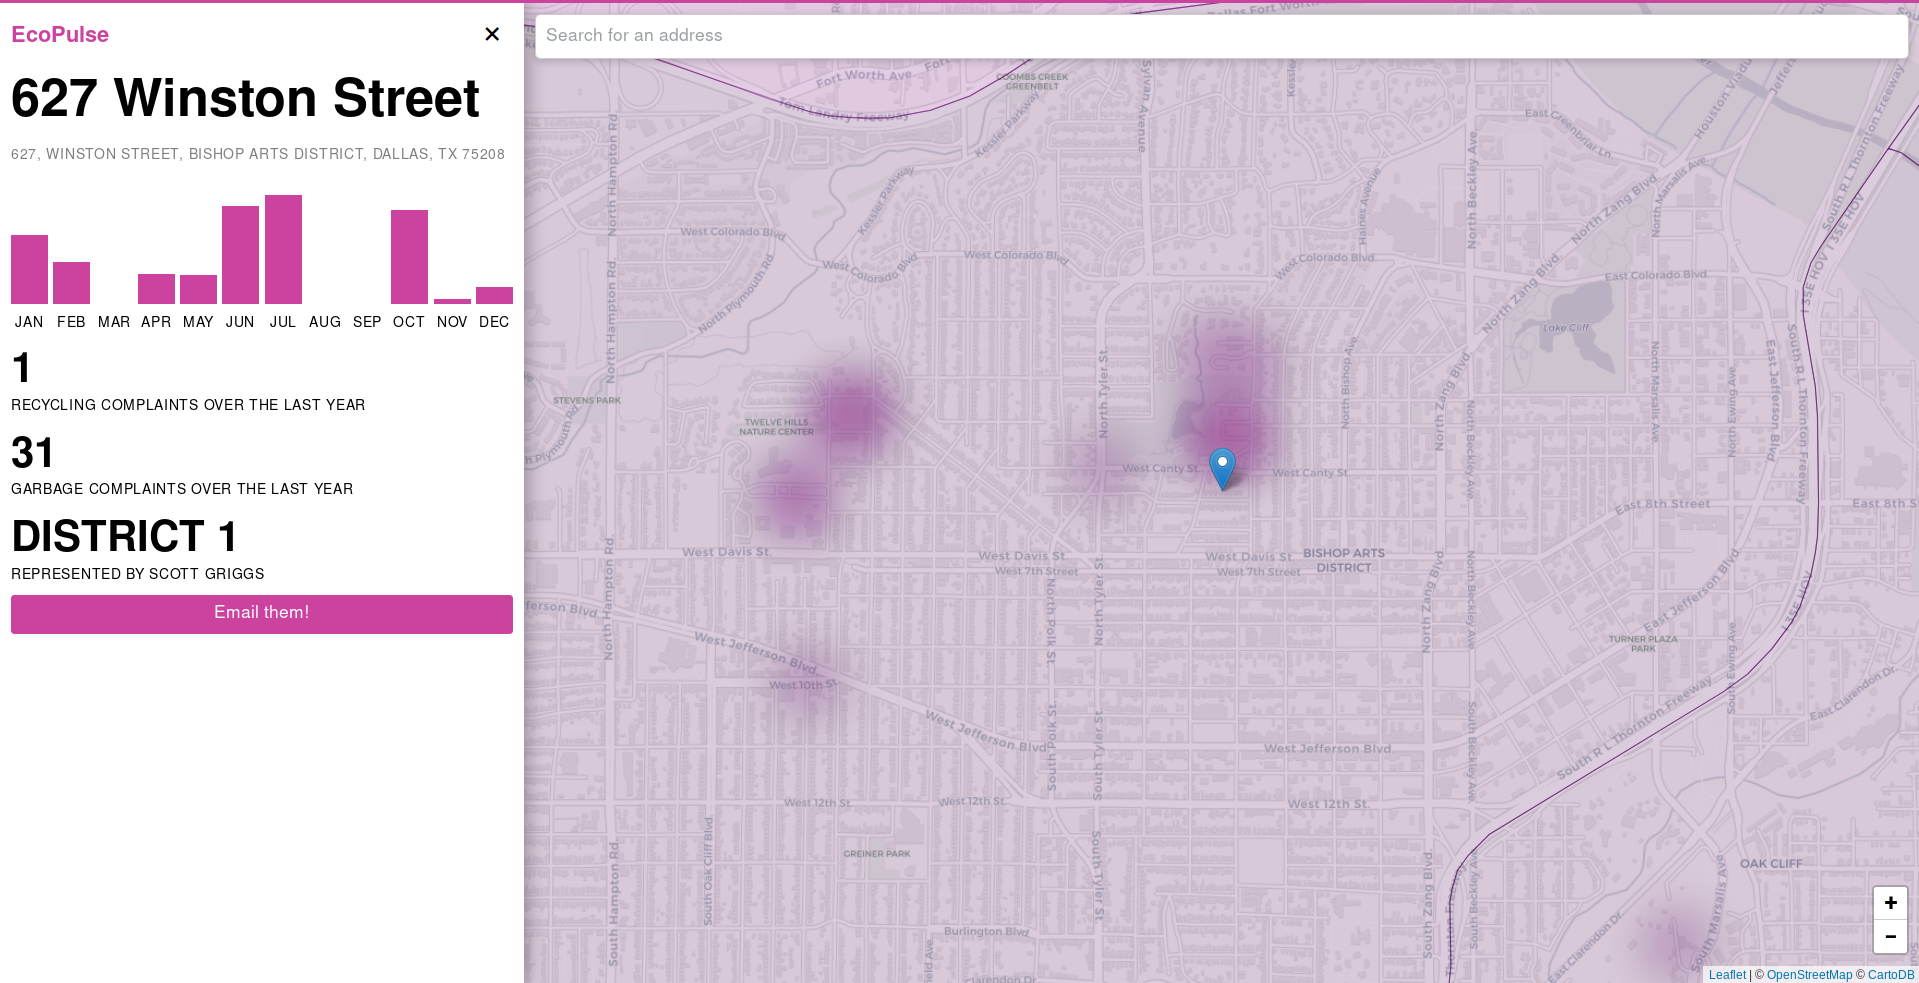
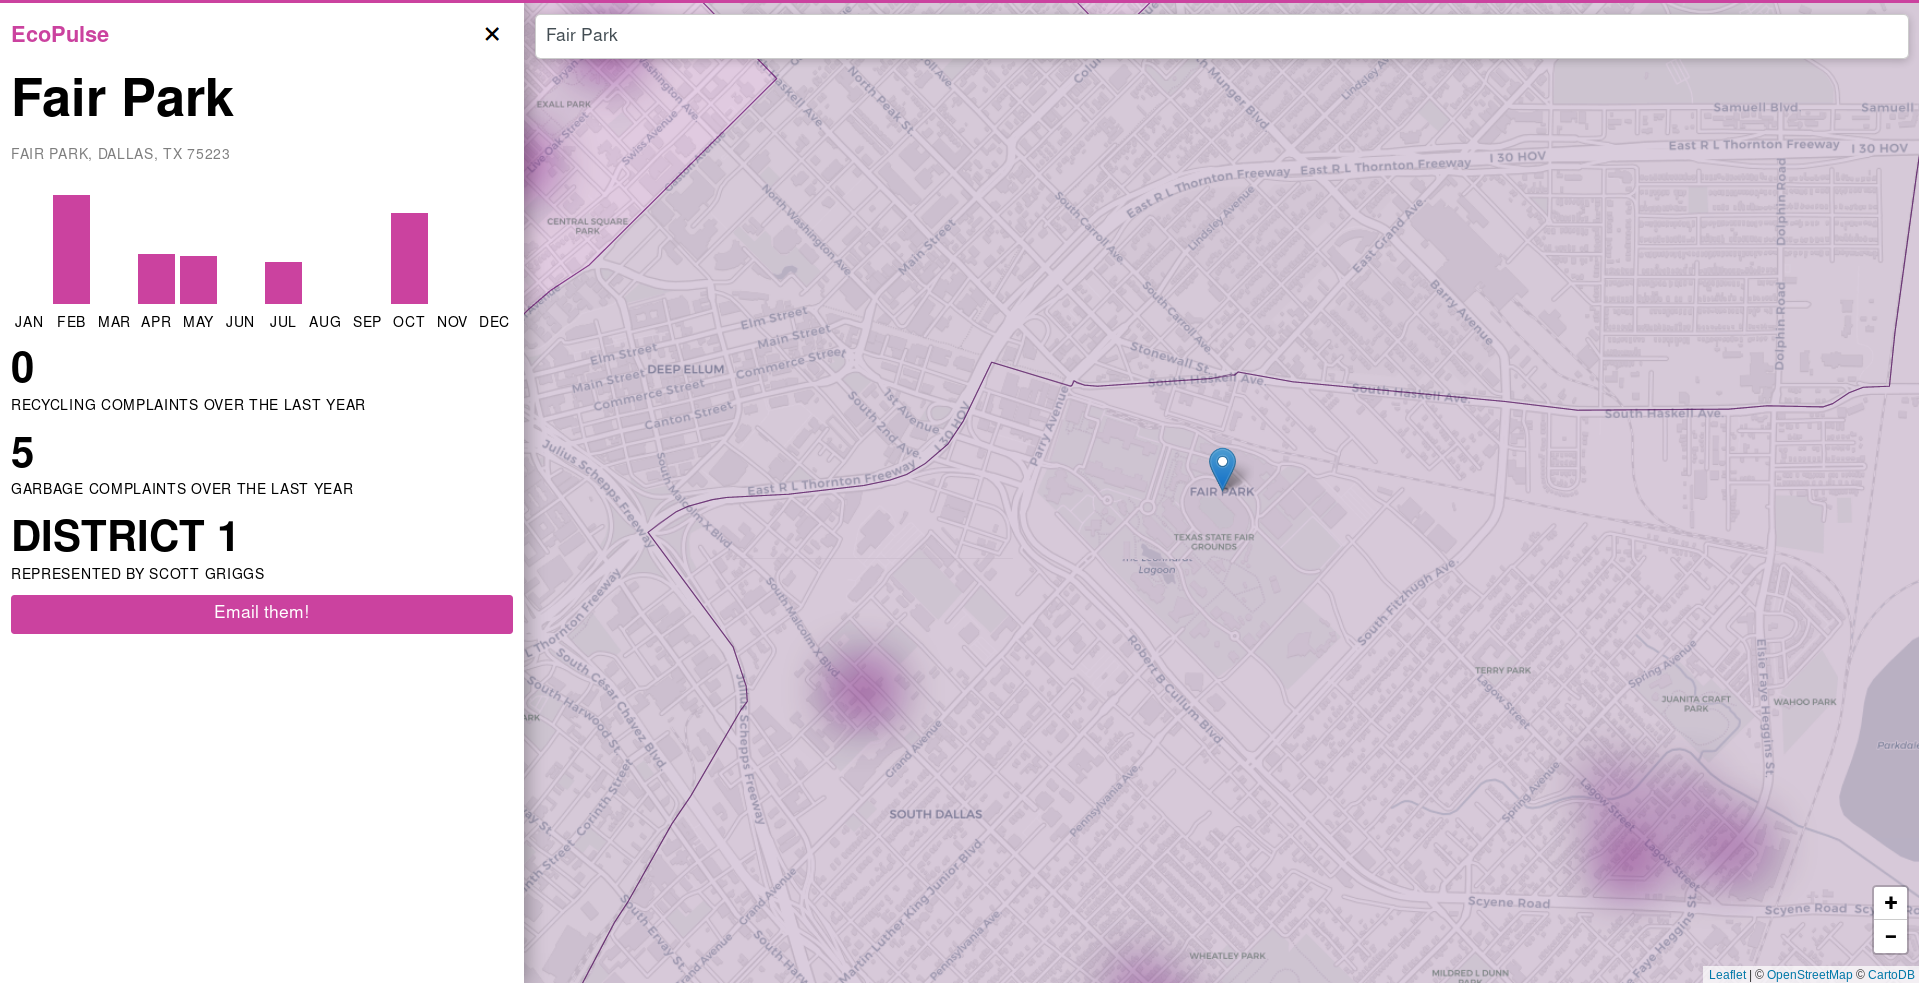
By analyzing information about waste and recycling at house-level accuracy we are able to provide aggregate information in a summarized fashion that is easier to digest without extensive technical knowledge.
How we built it
We used Python for data acquisition and processing and leaflet.js to render the data in the browser.
Challenges we ran into
Non-uniform data formats, missing field values, difficulty acquiring data in a usable format, rate limits.
Accomplishments that we're proud of
The animations! Efficient scraping, mastery of big data. Preservation of our friendship (somewhat).
What we learned
Django is hard ⁿᵒᵈᵉʲˢ ᶦˢ ᵇᵉᵗᵗᵉʳ Leaflet is pretty nice.
What's next for EcoPulse
Using EPA data. Incorporating more sources.
Built With
- big-data
- django
- es7
- javascript
- leaflet.js
- less
- opendallas
- openstreetmap
- python
- statistics


Log in or sign up for Devpost to join the conversation.