-
-
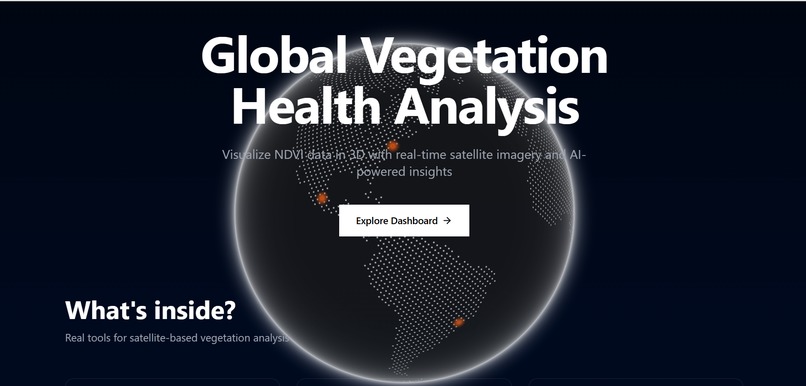
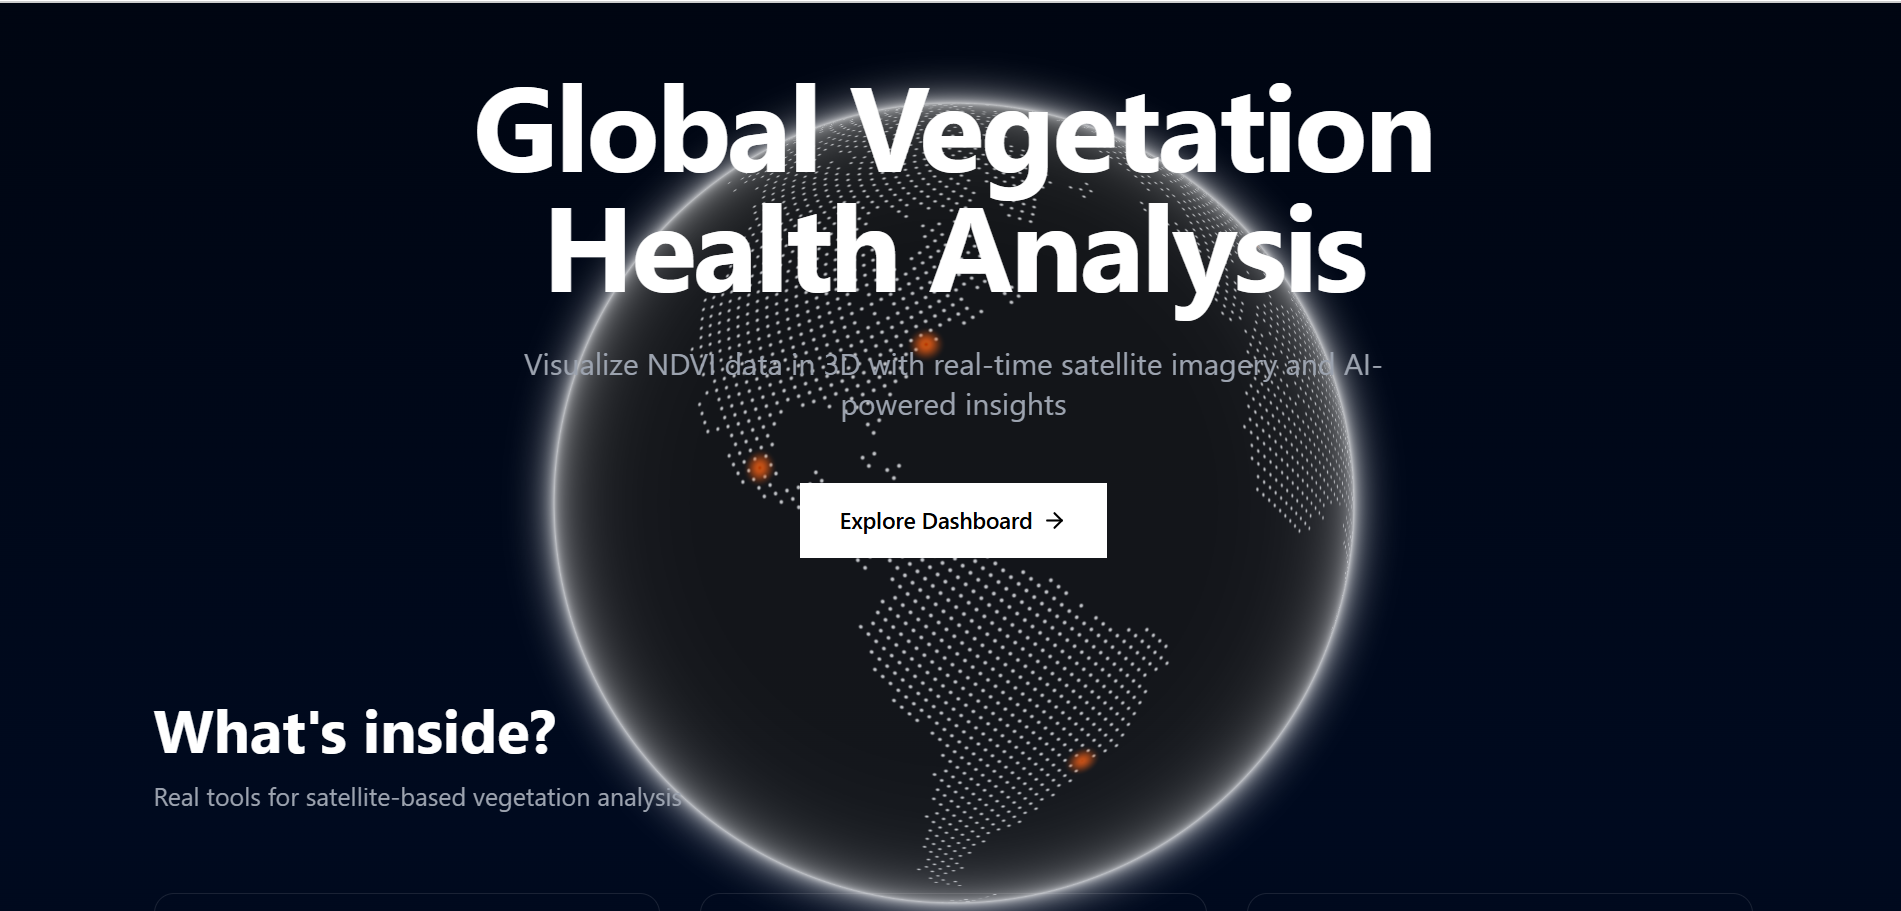
Home landing page
-

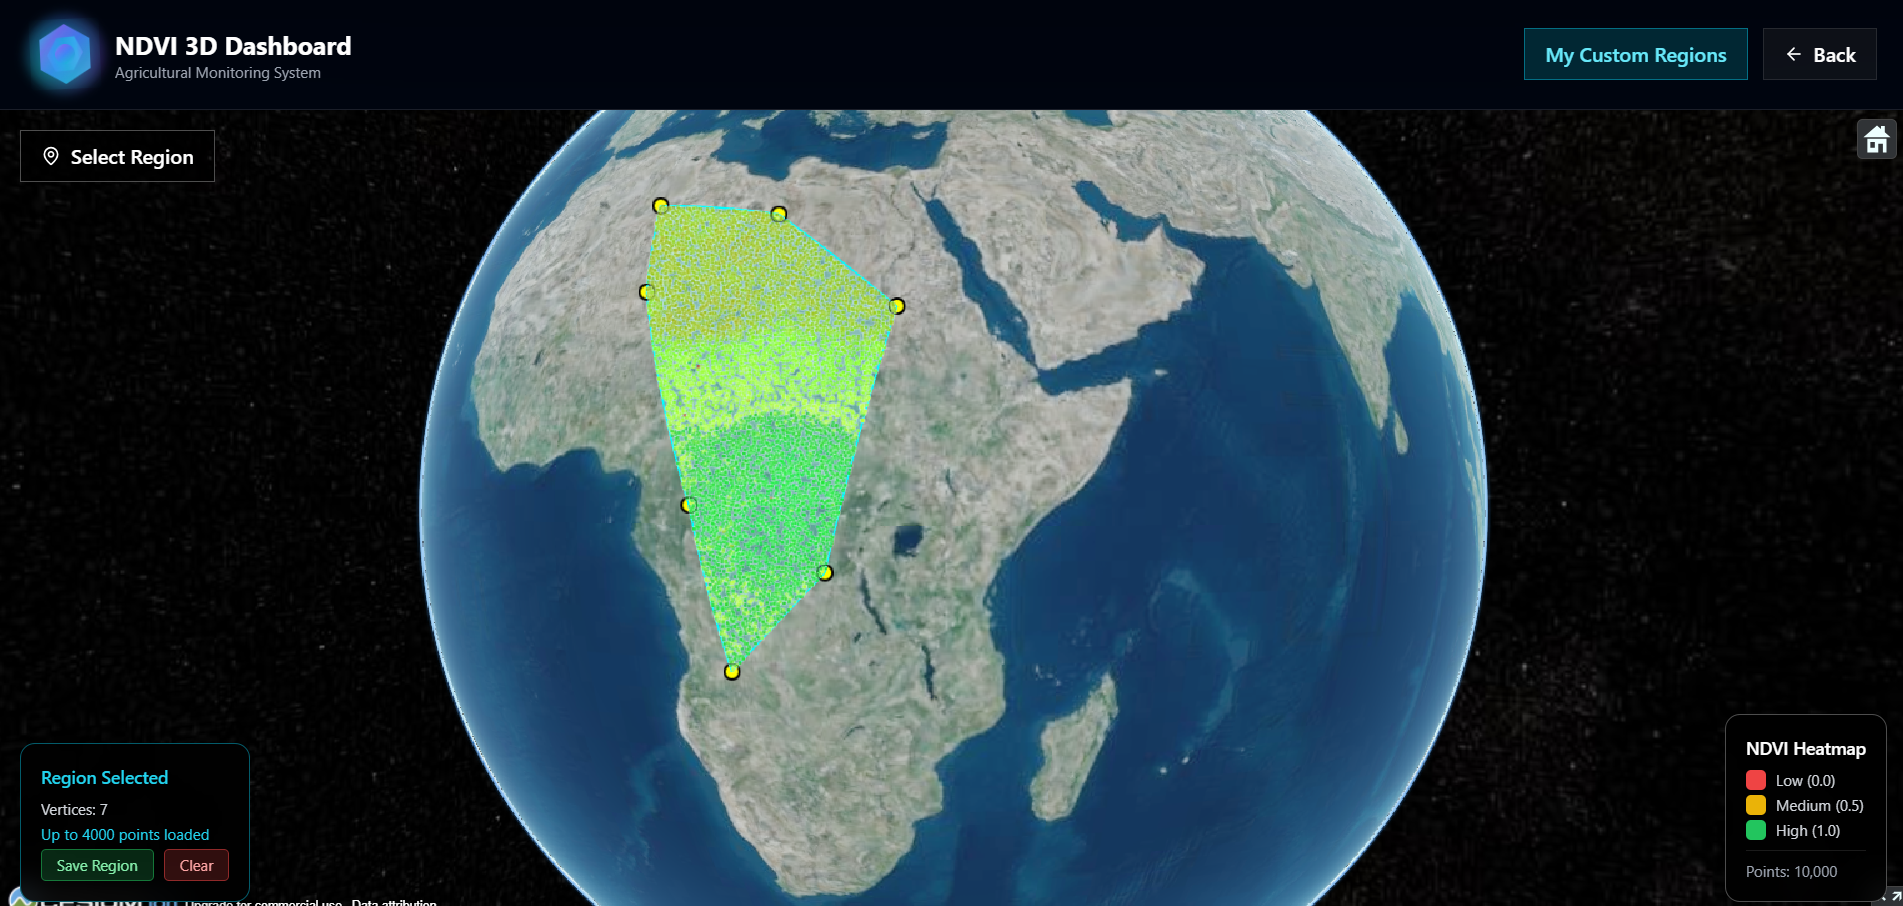
Region creation + heat map visualization
-
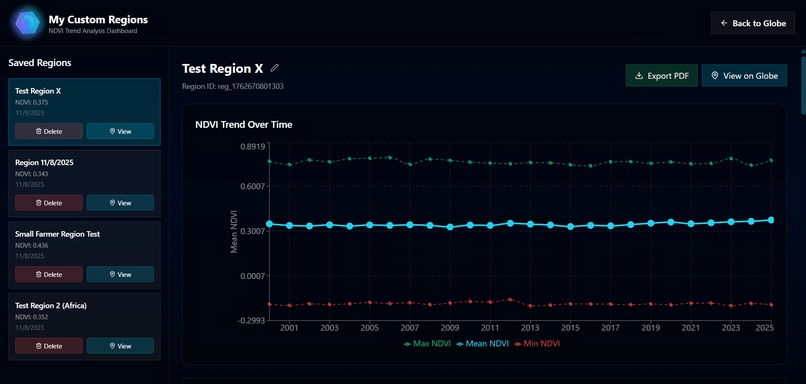
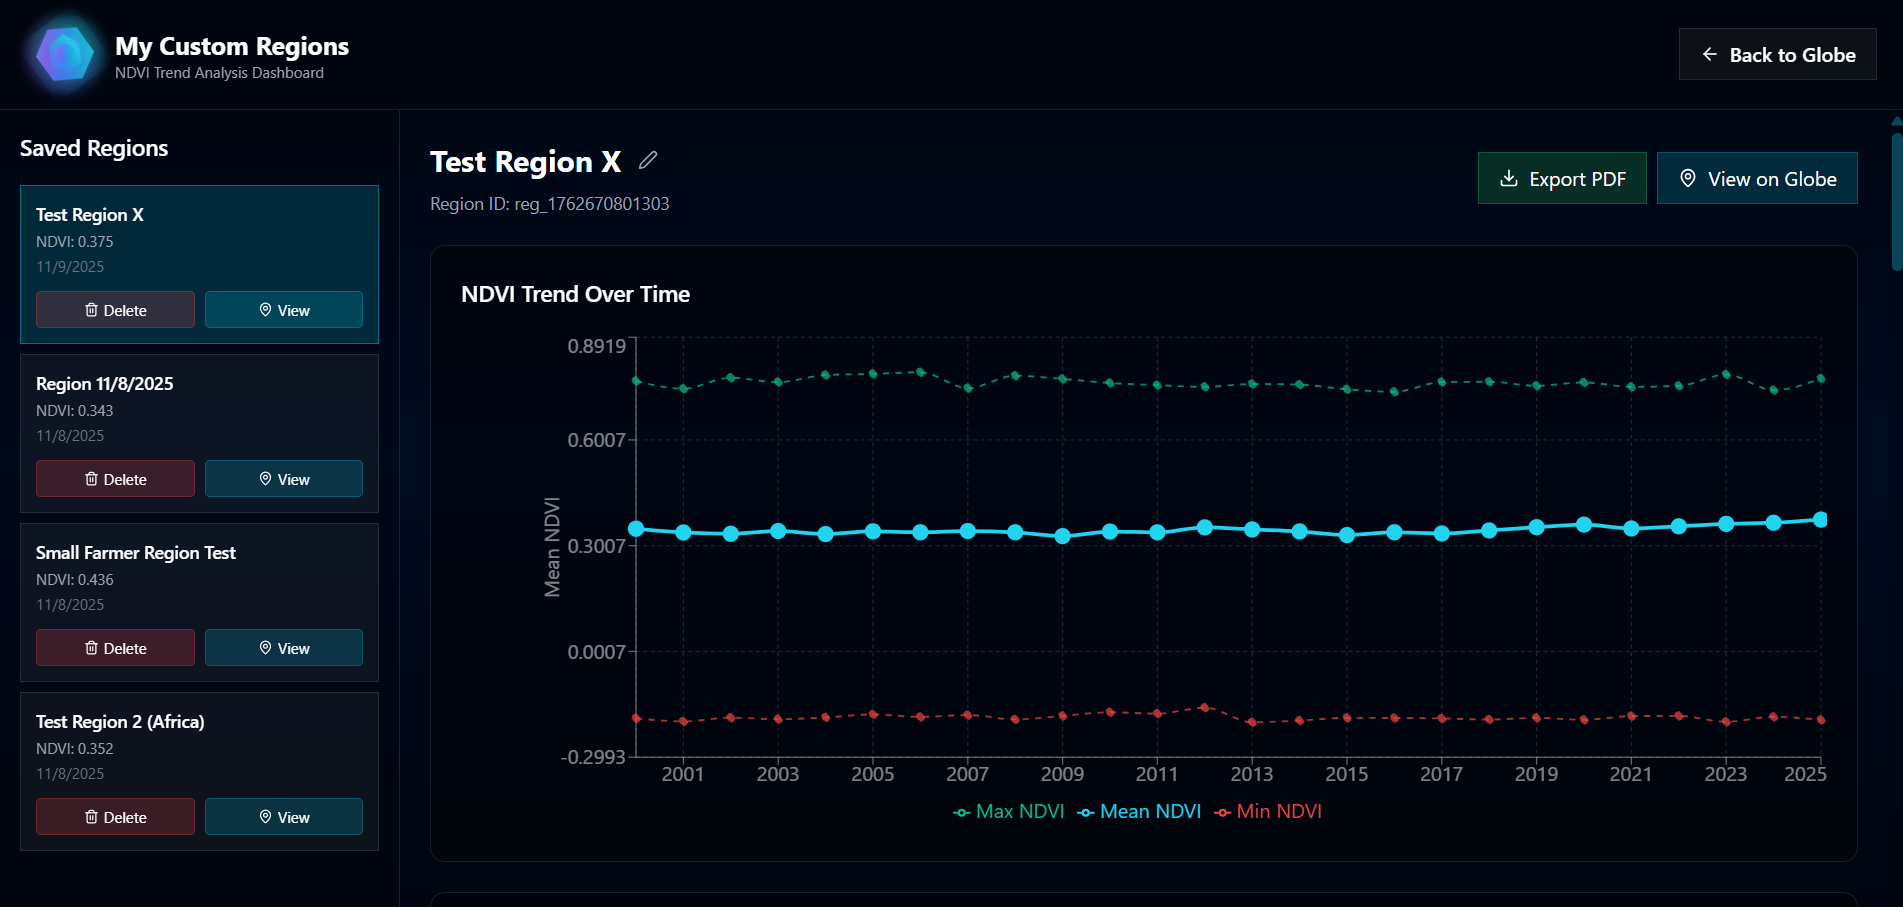
Region Trends
-

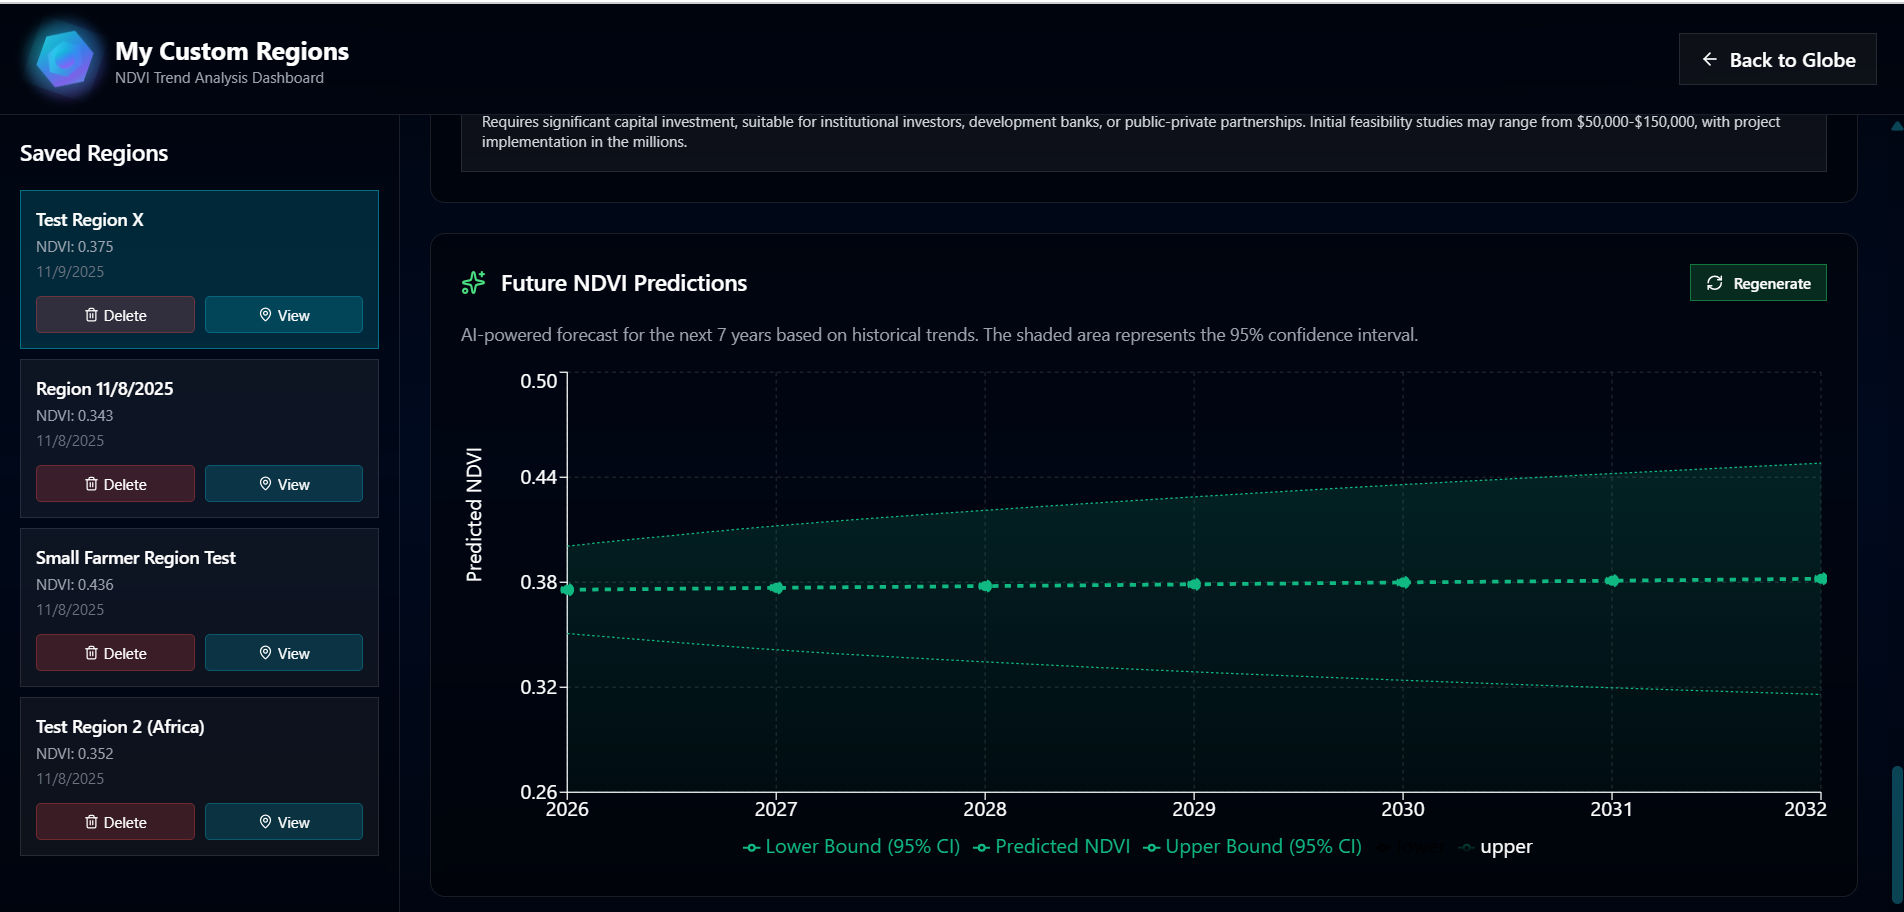
Future Predictions
Inspiration
Every day, NASA's satellites capture massive amounts of data, including data that keep track of the health of our vegetation. This is data that could help a farmer in optimize their harvest, or a conservationist track reforestation, or a policymaker allocate resources to regions with poor vegetation. However the data is complex and and not interpretable for these individuals, and it doesn't provide them any actionable insights. TerraSense was inspired by the idea of creating a platform that can transform this complex data into impact.
What it does
TerraSense is a geospatial intelligence platform that makes satellite-based vegetation analysis accessible to anyone. Users can click on a 3D globe to draw custom regions anywhere on Earth, and upon doing so, it captures over thousands of satellite data points from NASA’s MODIS imagery to calculate NDVI (Normalized Difference Vegetation Index) metrics, quantifiers of the health and density of vegetation in a given area. TerraSense provides 25 years of historical vegetation trends (2000-present), and uses Google’s Gemini AI to identify trends and make predictions on how the vegetation of a region might be affected in the future.
How we built it
Our project can be split into four main principal components, the frontend, backend, database, and prediction engines/APIs. For the frontend we used react.js combined with the CesiumJS globe visualization library. This allowed for us to create an interactive 3D globe from which a user can plot points and draw regions on. For the backend, we used FastAPI, creating API endpoints for data retrieval and predictions, as well as to process geospatial data obtained from the Google Earth Engine (GEE). We built and managed our data models using MongoDB Atlas where we stored historical NDVI data, cached Google Earth Engine queries for faster loading, and stored region definitions and predictions. To create our predictions we used the Google Gemini API to analyze historical NDVI trends, generate regional agriculture insights, and predict future vegetation health and farming viability.
Challenges we ran into
Our biggest challenge was related to managing the complexity of fetching tons of satellite data in real-time. Google Earth Engine API call latency and loading speed issues forced us to implement intelligent batching strategies and interpolation methods to gather up to thousands of data points per region in an efficient manner without hitting API constraints. Additionally, getting the AI analysis to provide meaningful, evidence backed trends and predictions required an extensive amount of prompt engineering, which provided much difficulty.
Accomplishments that we're proud of
We are incredibly proud of ourselves for being able to create a platform that makes NASA satellite data easily accessible to anyone with a web browser– no coding skills or complex software required. Connecting massive amounts of data points in a quick manner was something we were especially proud of. Additionally, we were proud of ourselves for creating a low friction user interface to cleanly display all of our insights.
What we learned
We learned quite a bit about the type of data and predictions one can make simply based off of satellite data. We also learned about how much of an issue access to this data is, with it being stored in complex formats that prevent those who need it from being able to easily interpret it. This project taught us a lot about managing complex data and queries and translating that into a simplified UI that anyone can use.
What's next for TerraSense
In the future, we plan to include more real-time systems into TerraSense that notify users when vegetation regions are dropping below critical thresholds. This would allow for regulators and farmers to make even faster proactive decisions before crop failure or ecosystem damage occurs. We also plan to integrate even more data sources such as rainfall, temperature, and soil moisture data to provide even more comprehensive analysis.


Log in or sign up for Devpost to join the conversation.