Inspiration
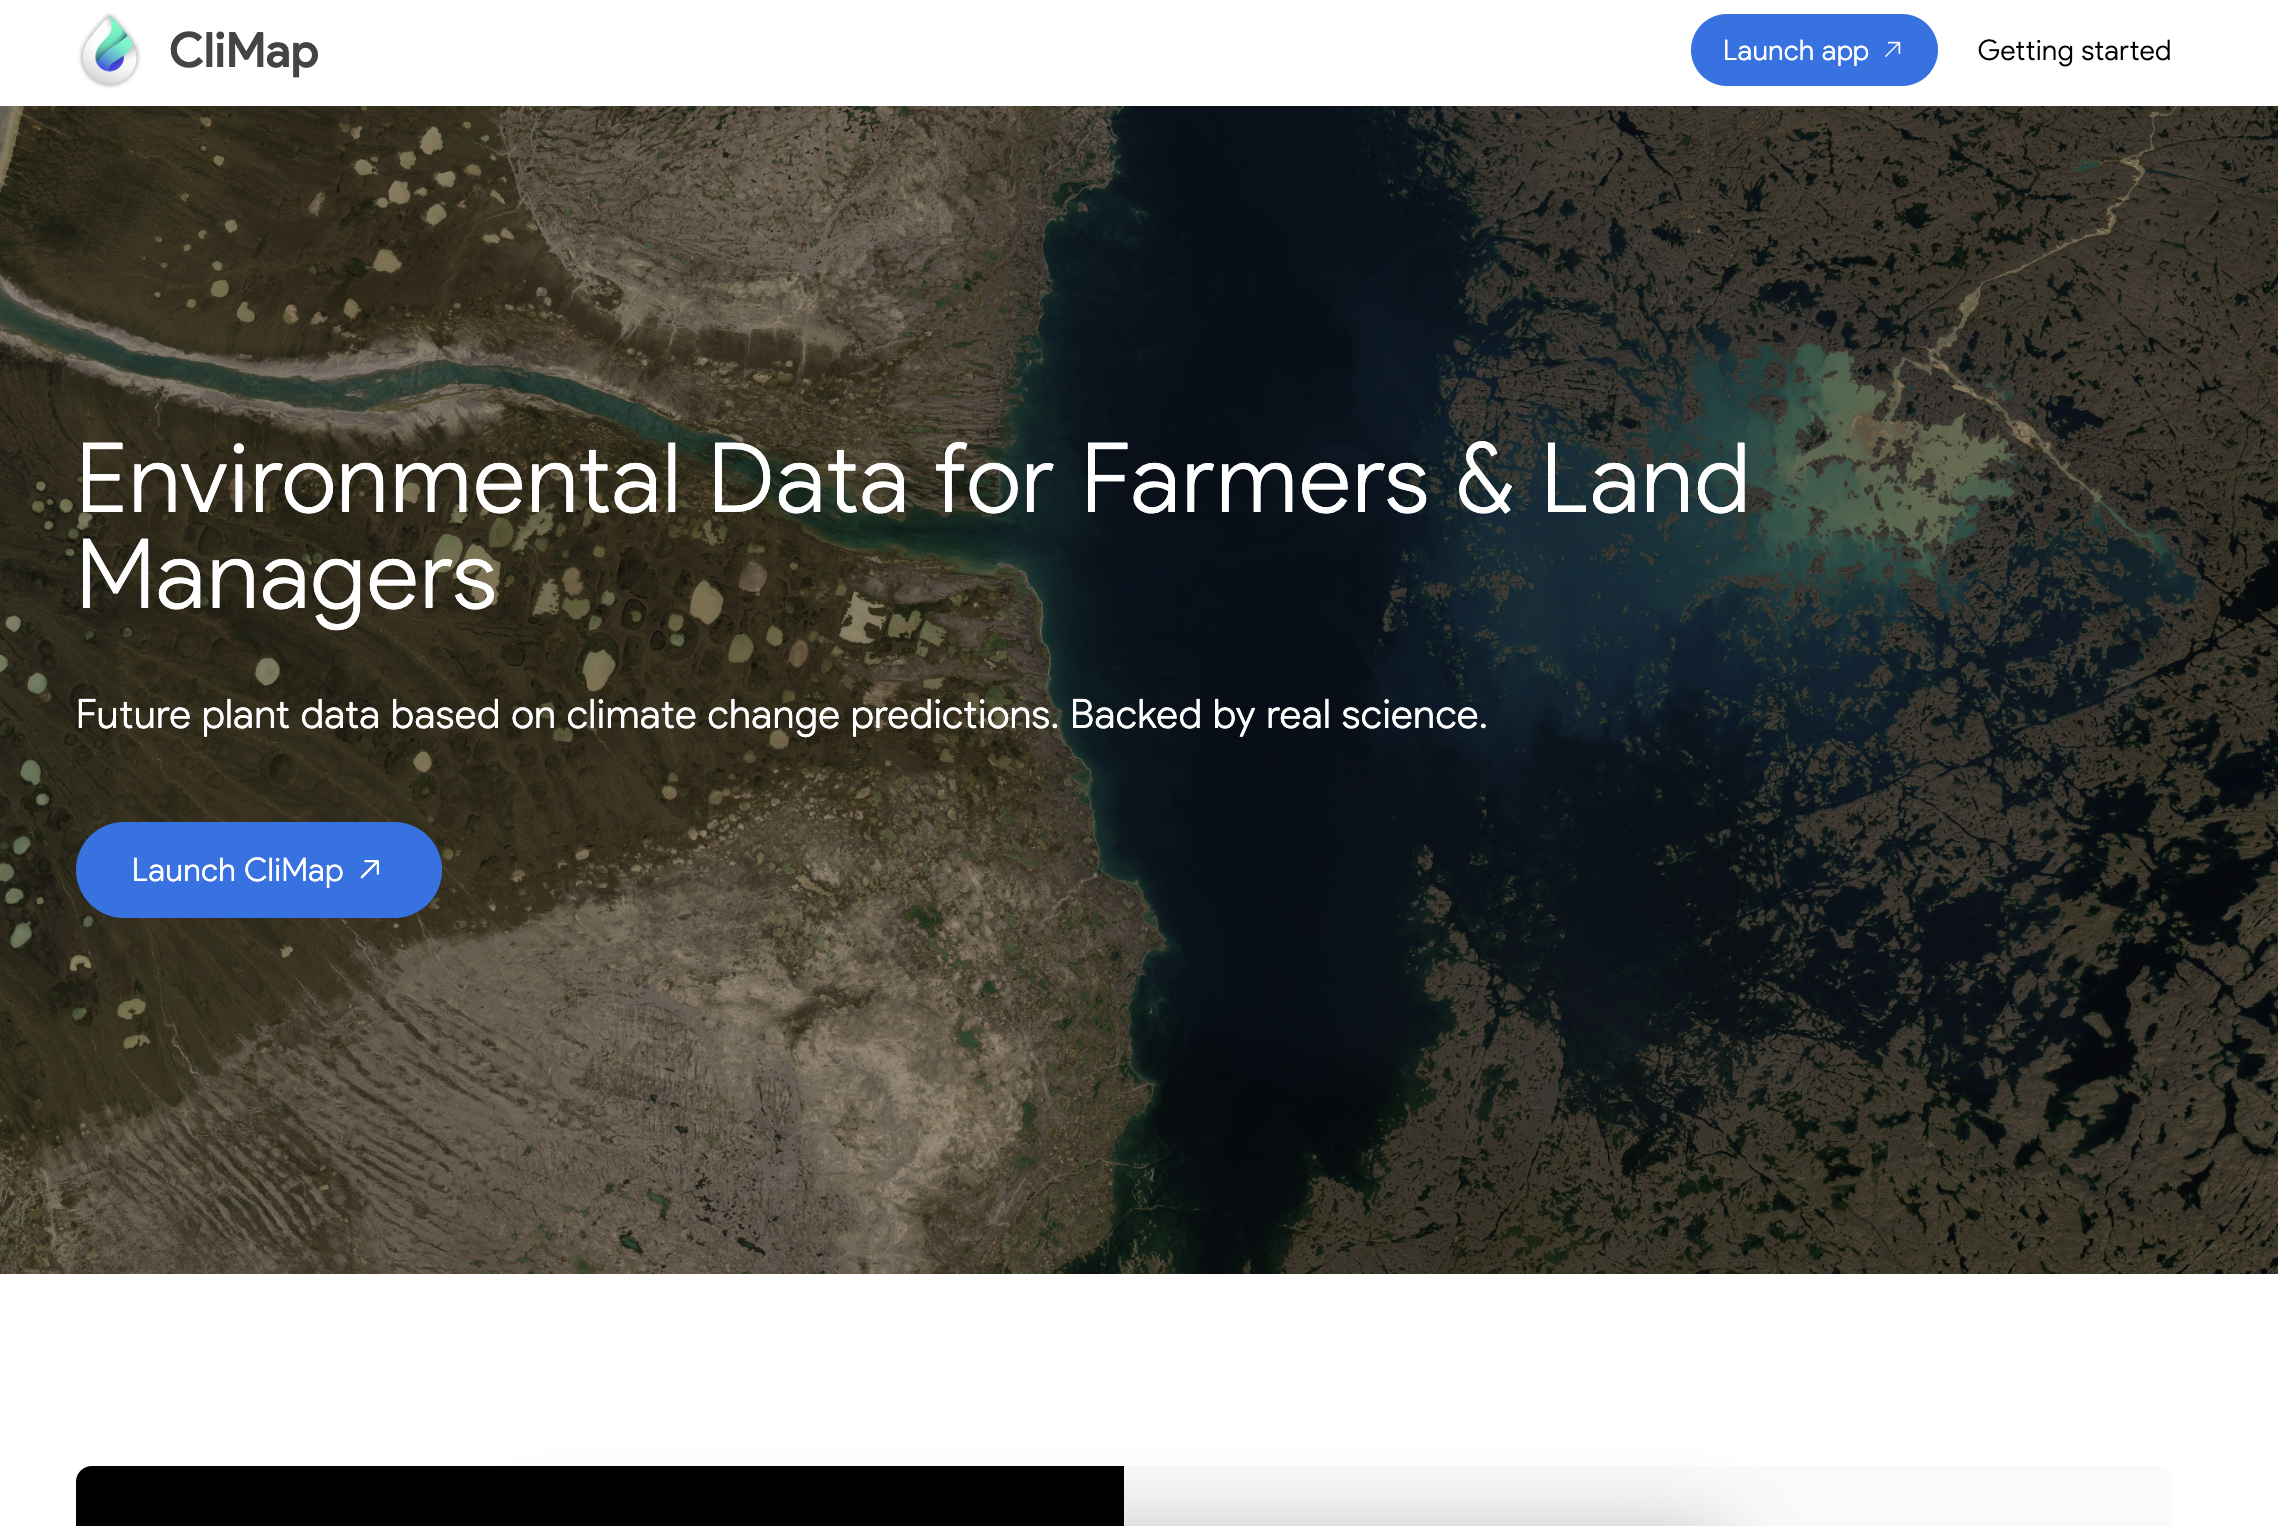
The idea for CliMap came from a publicly available dataset with simulated effects of climate change on plants in dryland ecosystems. The dataset contains thousands of data points, but I realized that the data would be useless if it wasn't easy to interpret or apply to real-world practices. The people who witness climate change firsthand, like farmers and land managers, have the potential to make changes on the ground but they need the right tools and data to help guide their decisions.
Development Process
I started by building the core of the app itself, focusing on the interactive map and the parameters for filtering data. The main component uses Google Earth Engine’s JavaScript API to pull in load the datasets and visualize them on the map. Once the map and data functionality were in place, I worked on building a React site to provide a user-friendly interface with explanations and instructions the app. This makes it easier for the target to interact with the app and understand what they are looking at.
Features
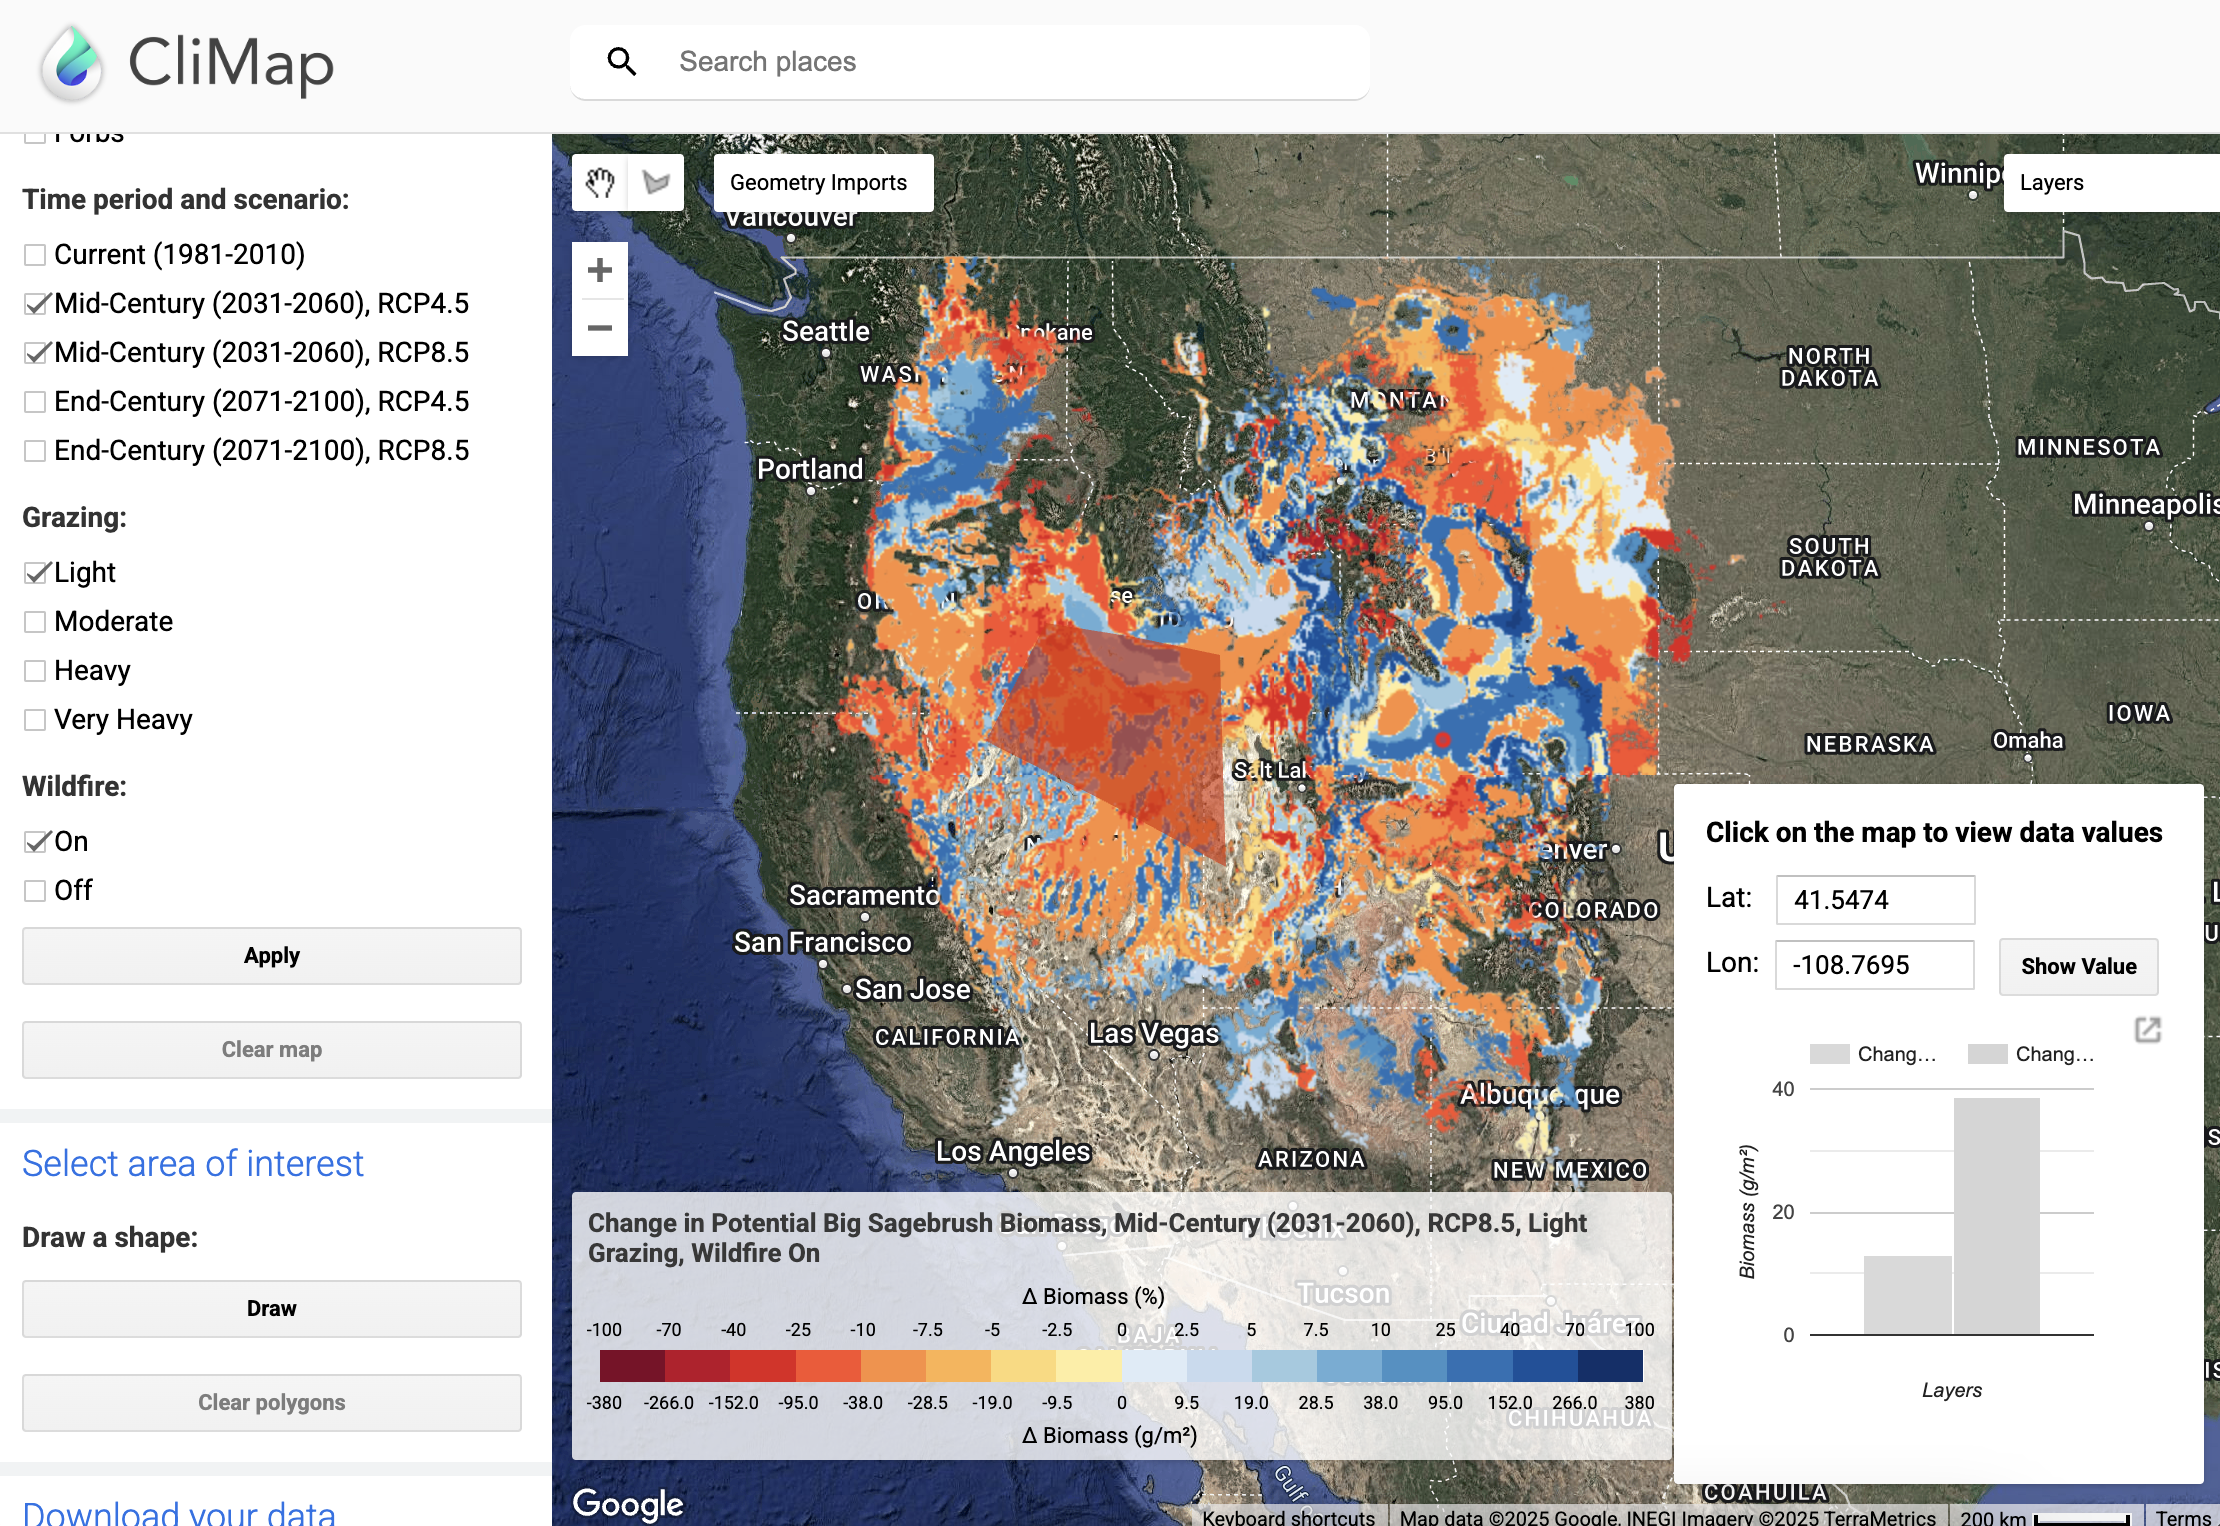
- Interactive map to visualize climate data
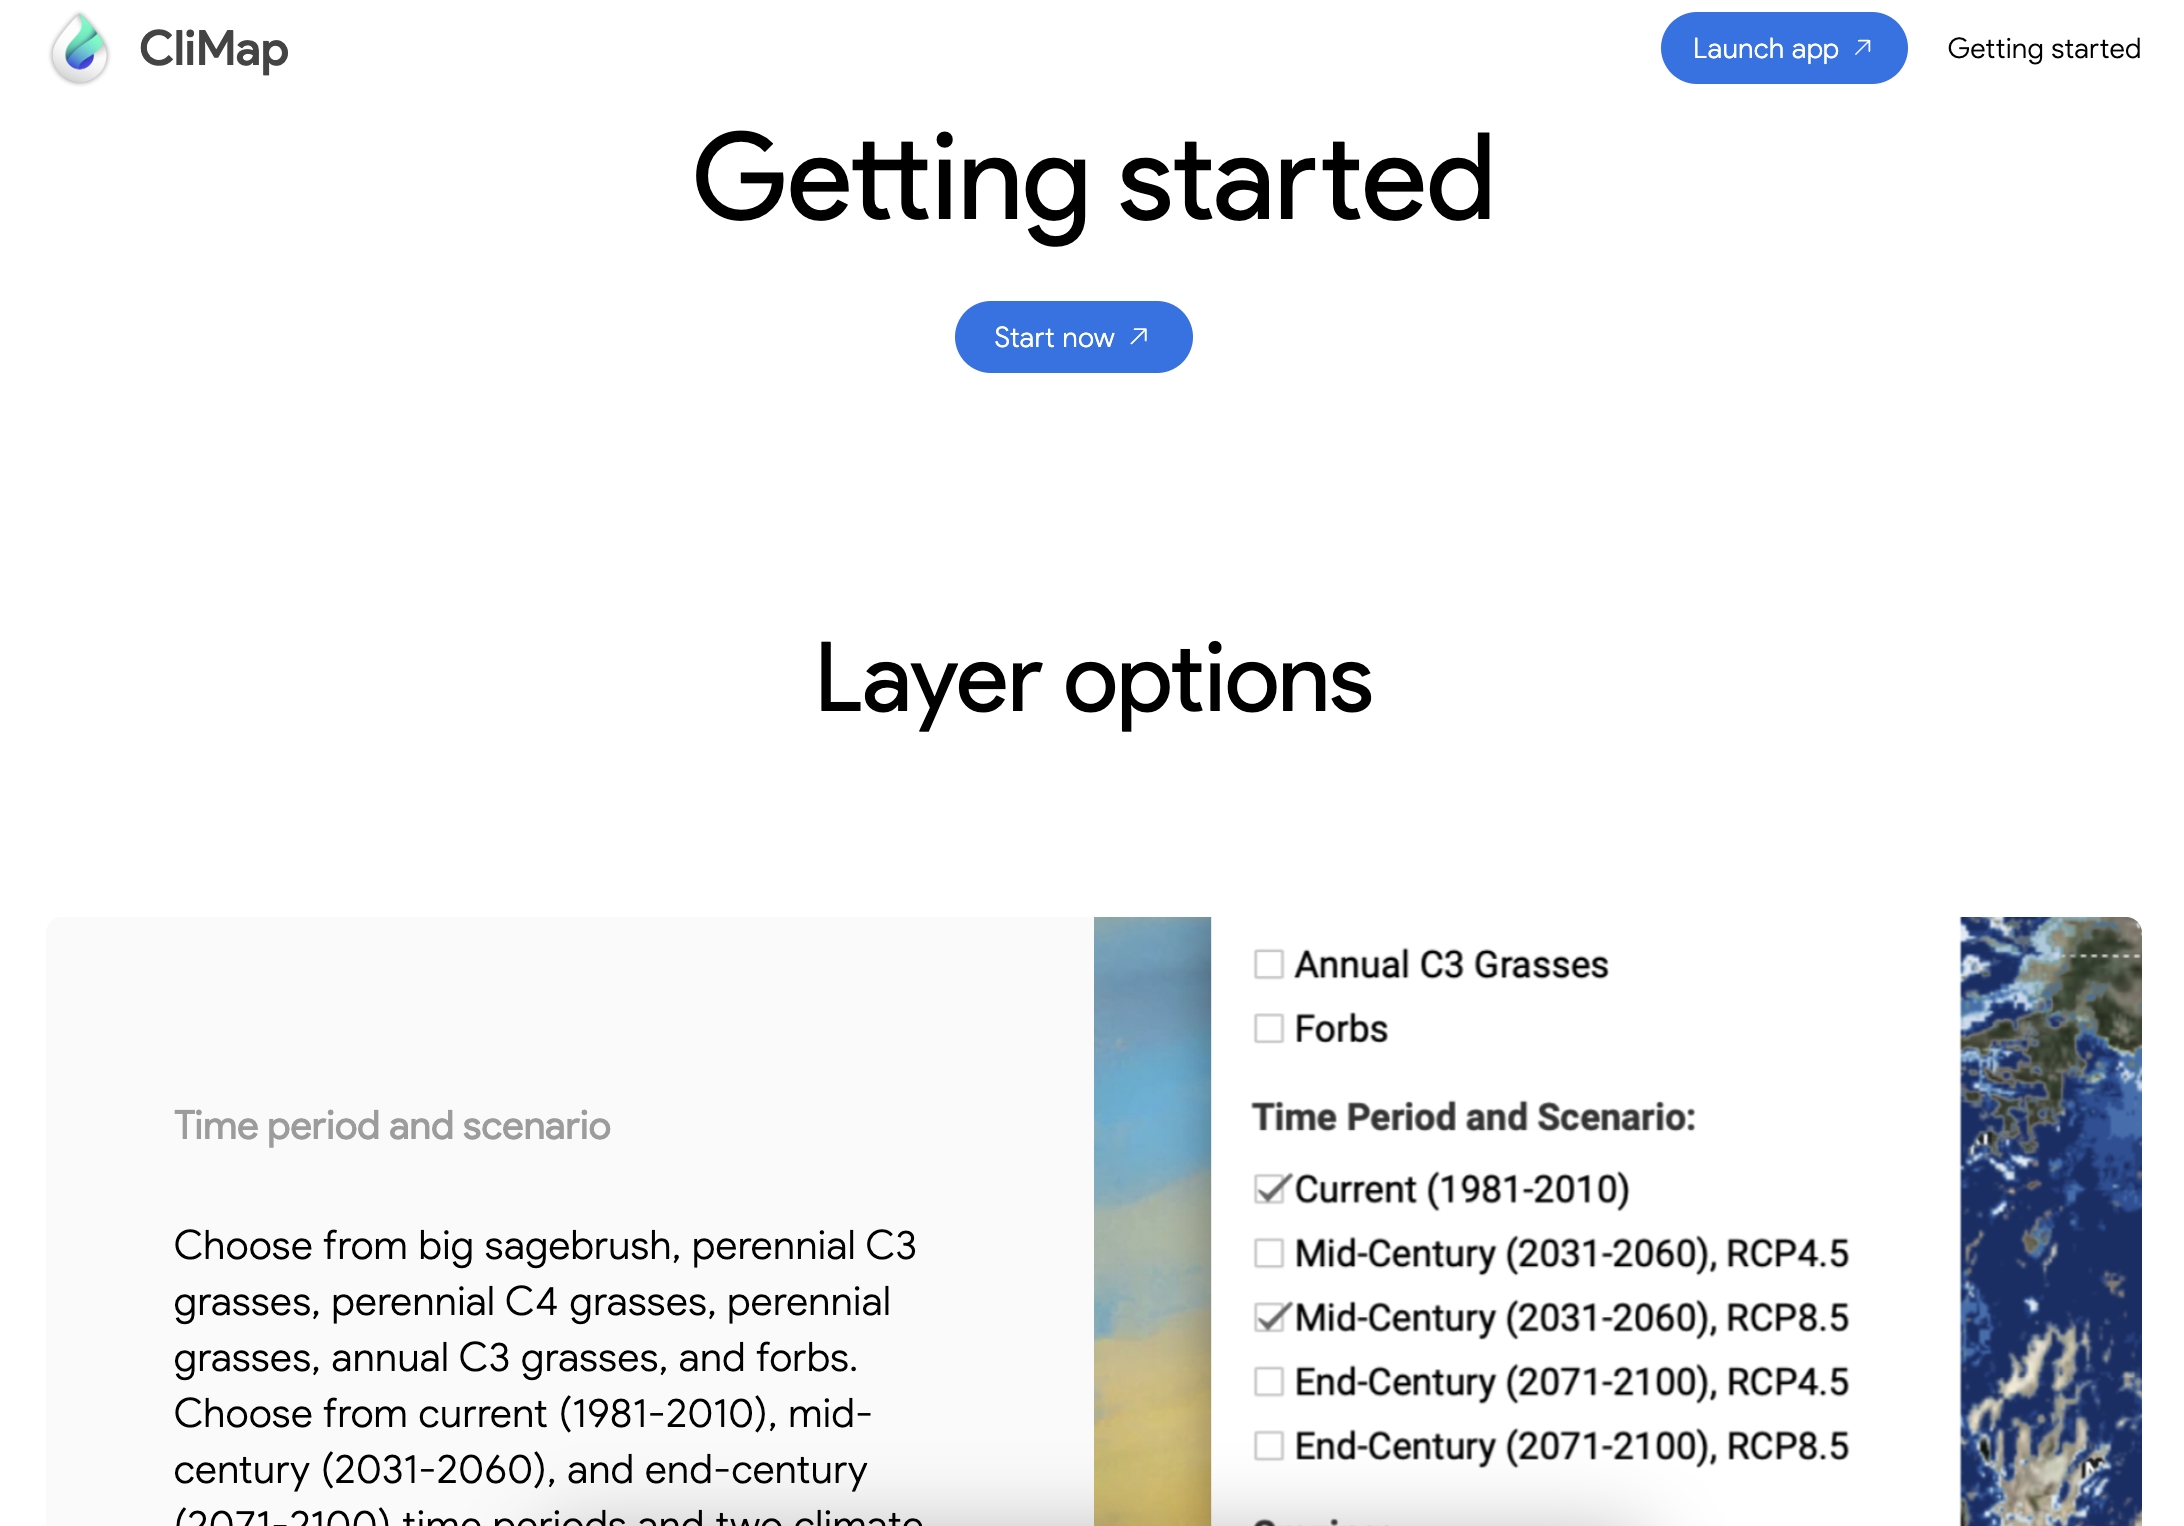
- Parameter filters (e.g. plant category, time period, climate scenario)
- Downloadable region-specific data for further research
- Charts and graphs to visualize point-specific data
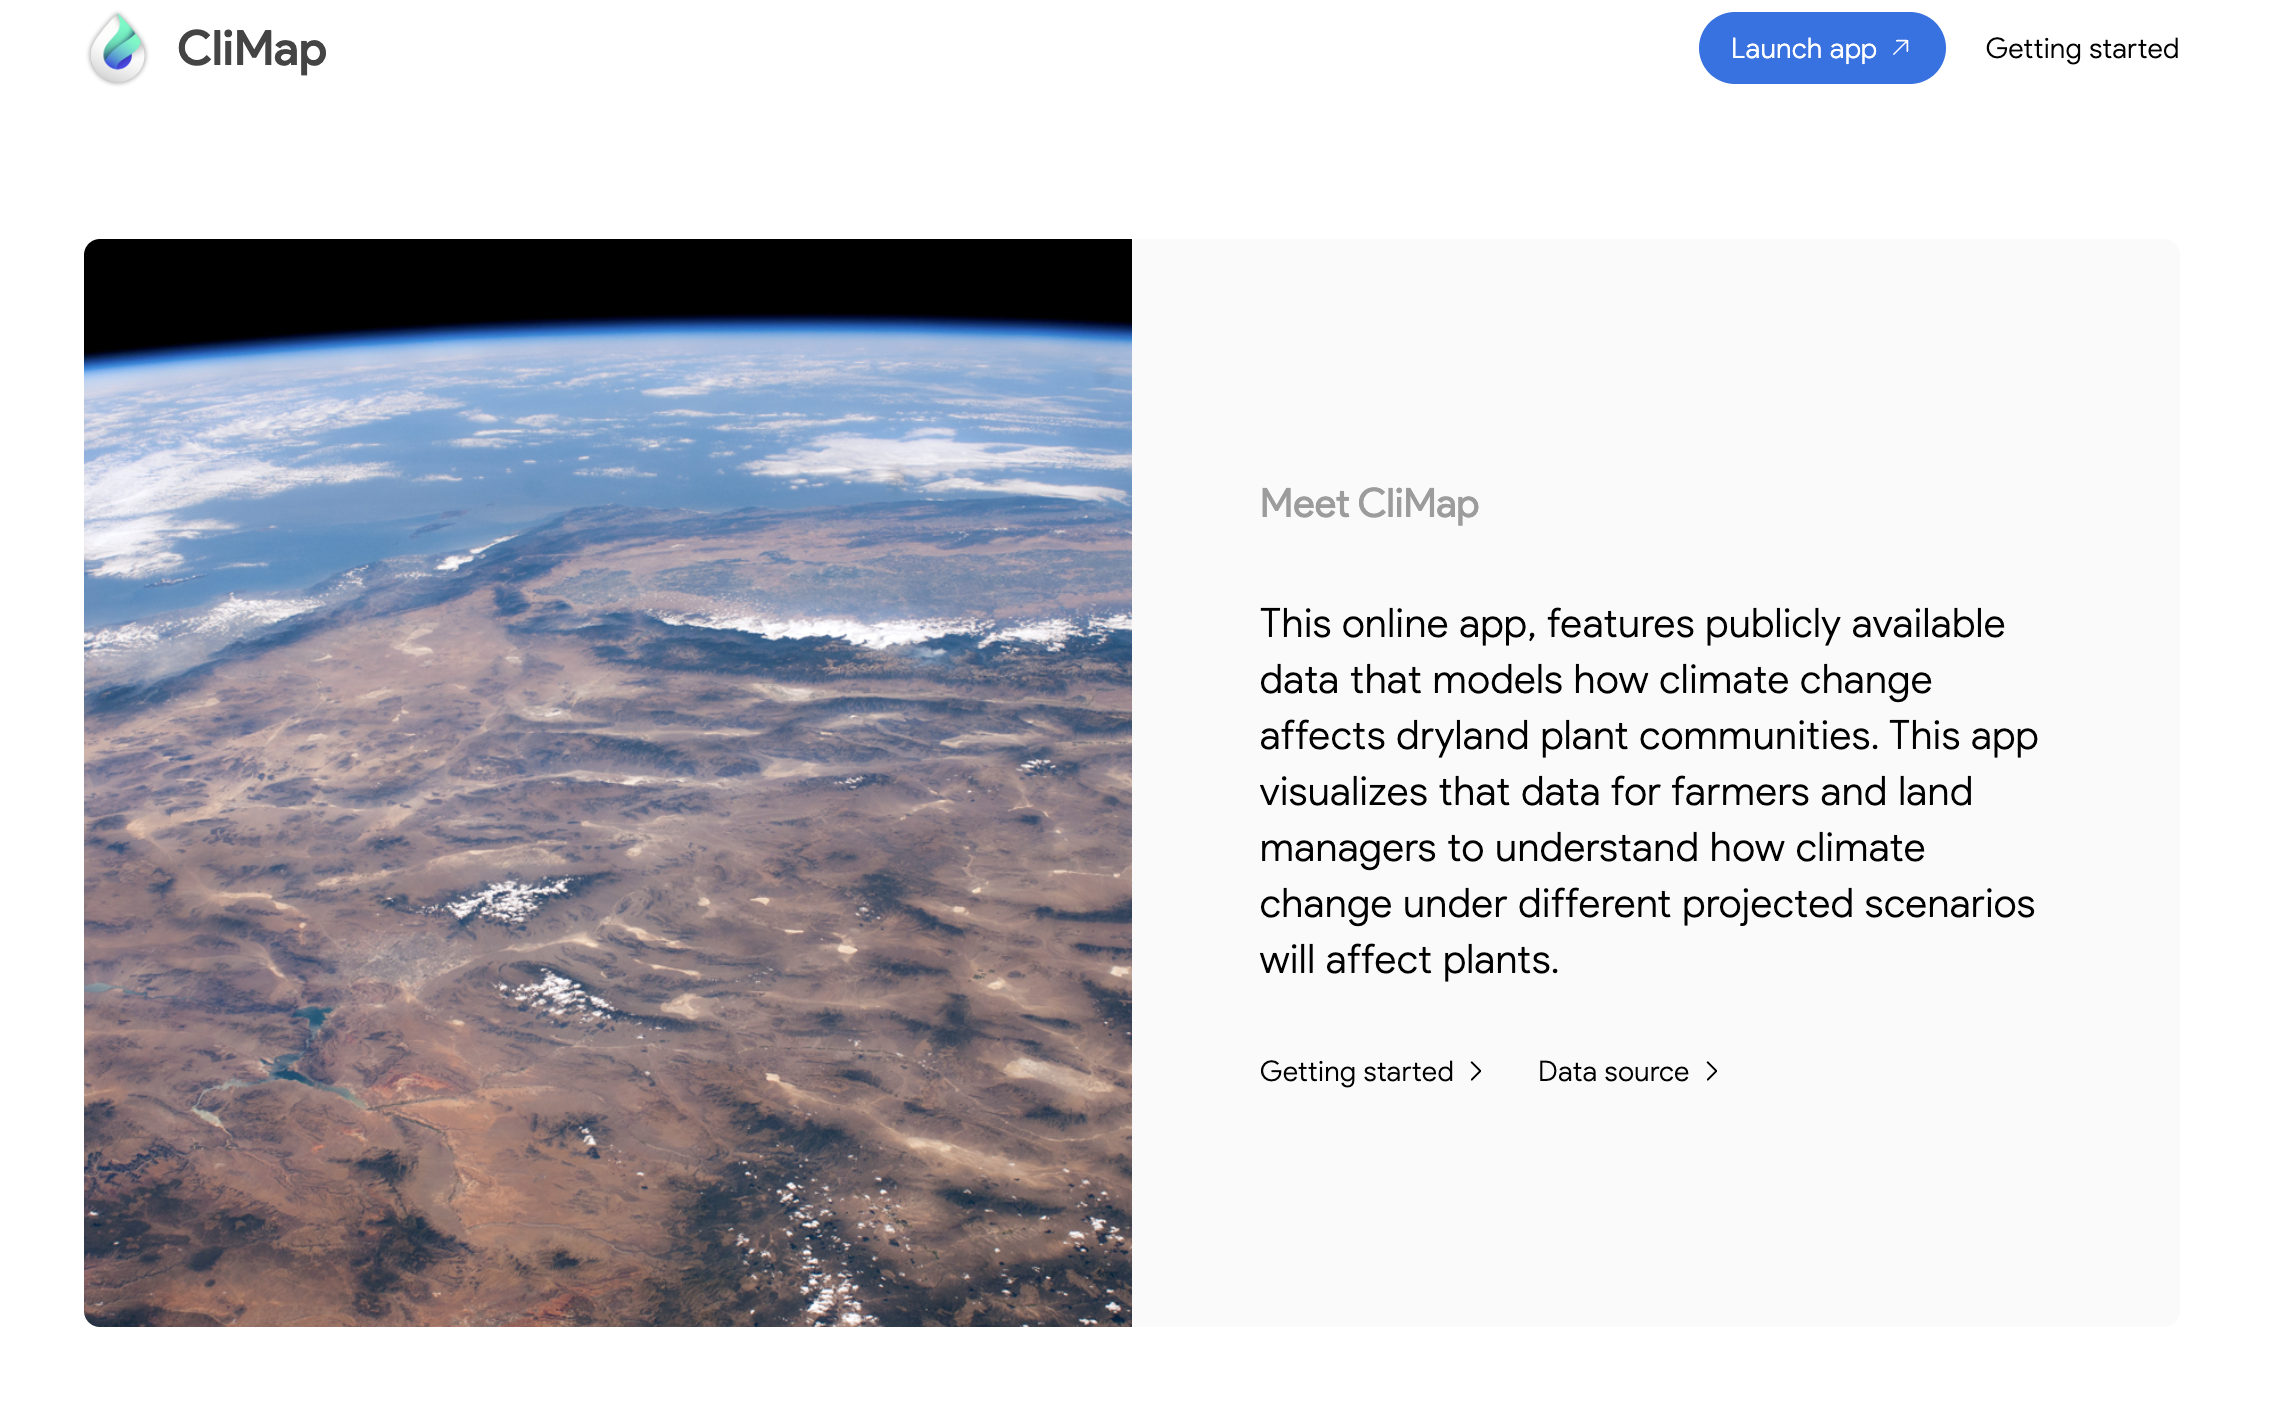
- Easy-to-use UI/UX and contextualizing website with instructions/guidance
Challenge
The biggest challenge I faced was the lack of documentation on how to use Google Earth Engine API, especially compared to technologies I've worked with in the past. Since it is a bit more of a niche tool, there was less support compared to more mainstream tools. I had to get really creative with research and developing solutions.
What I learned
This was my first hackathon, and I learned that with patience and a lot of tinkering, there can always be a solution to a problem. If you can think it up, you can definitely code it. This was a super fun experience

Log in or sign up for Devpost to join the conversation.