Inspiration
Smallholder farmers lose nearly 40% of their crops simply because they lack timely access to experts. We realized that farmers don't need another search engine; they need a Forensic Scientist in their pocket. We were inspired to build an app that doesn't just "guess" a disease but investigates it—tracking symptoms over time like a medical case file and mapping infection vectors with the precision of a lab technician.
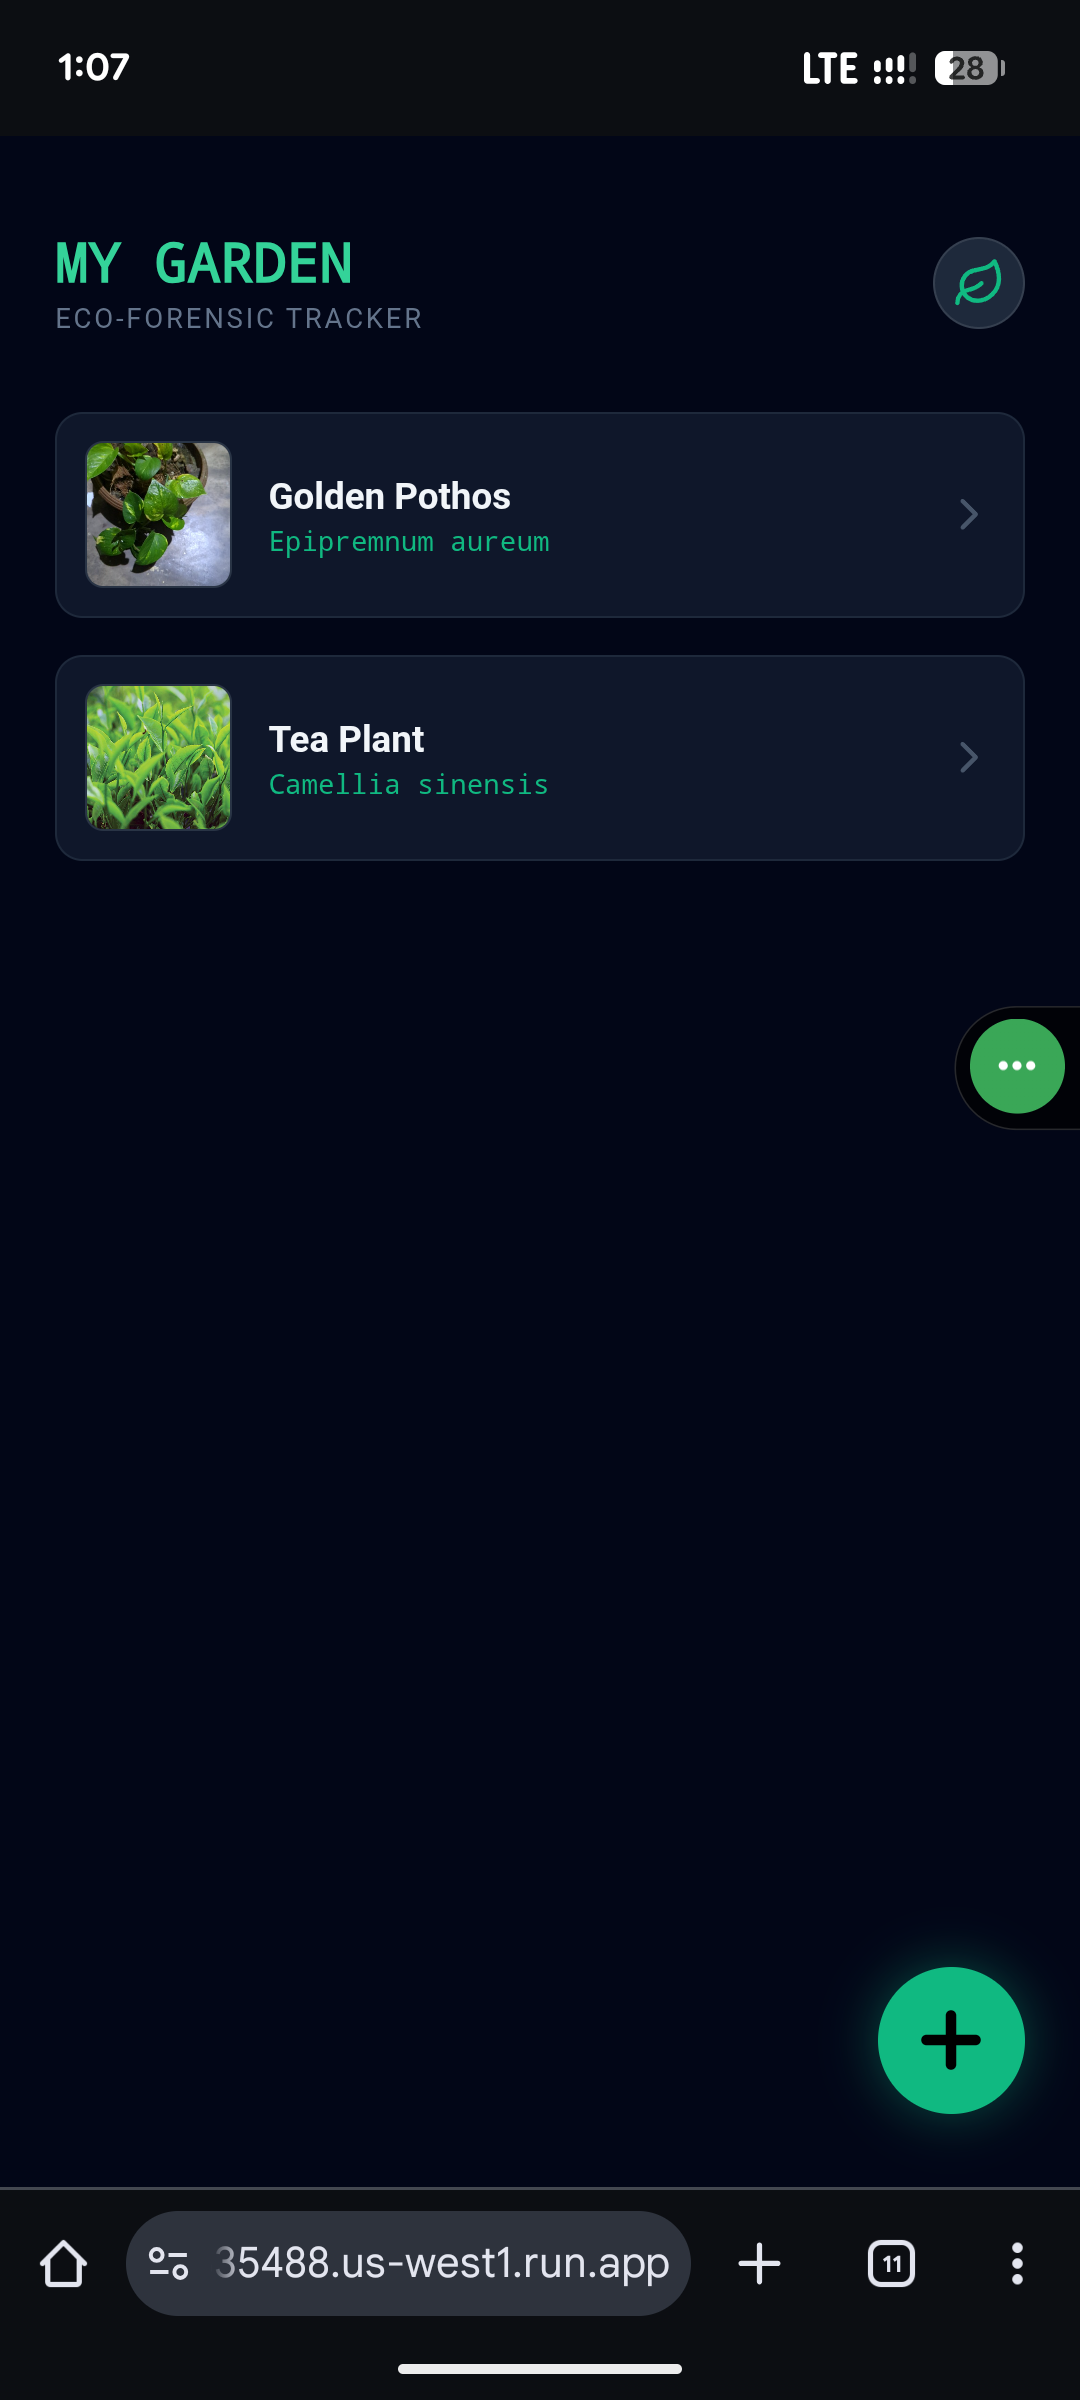
What it does
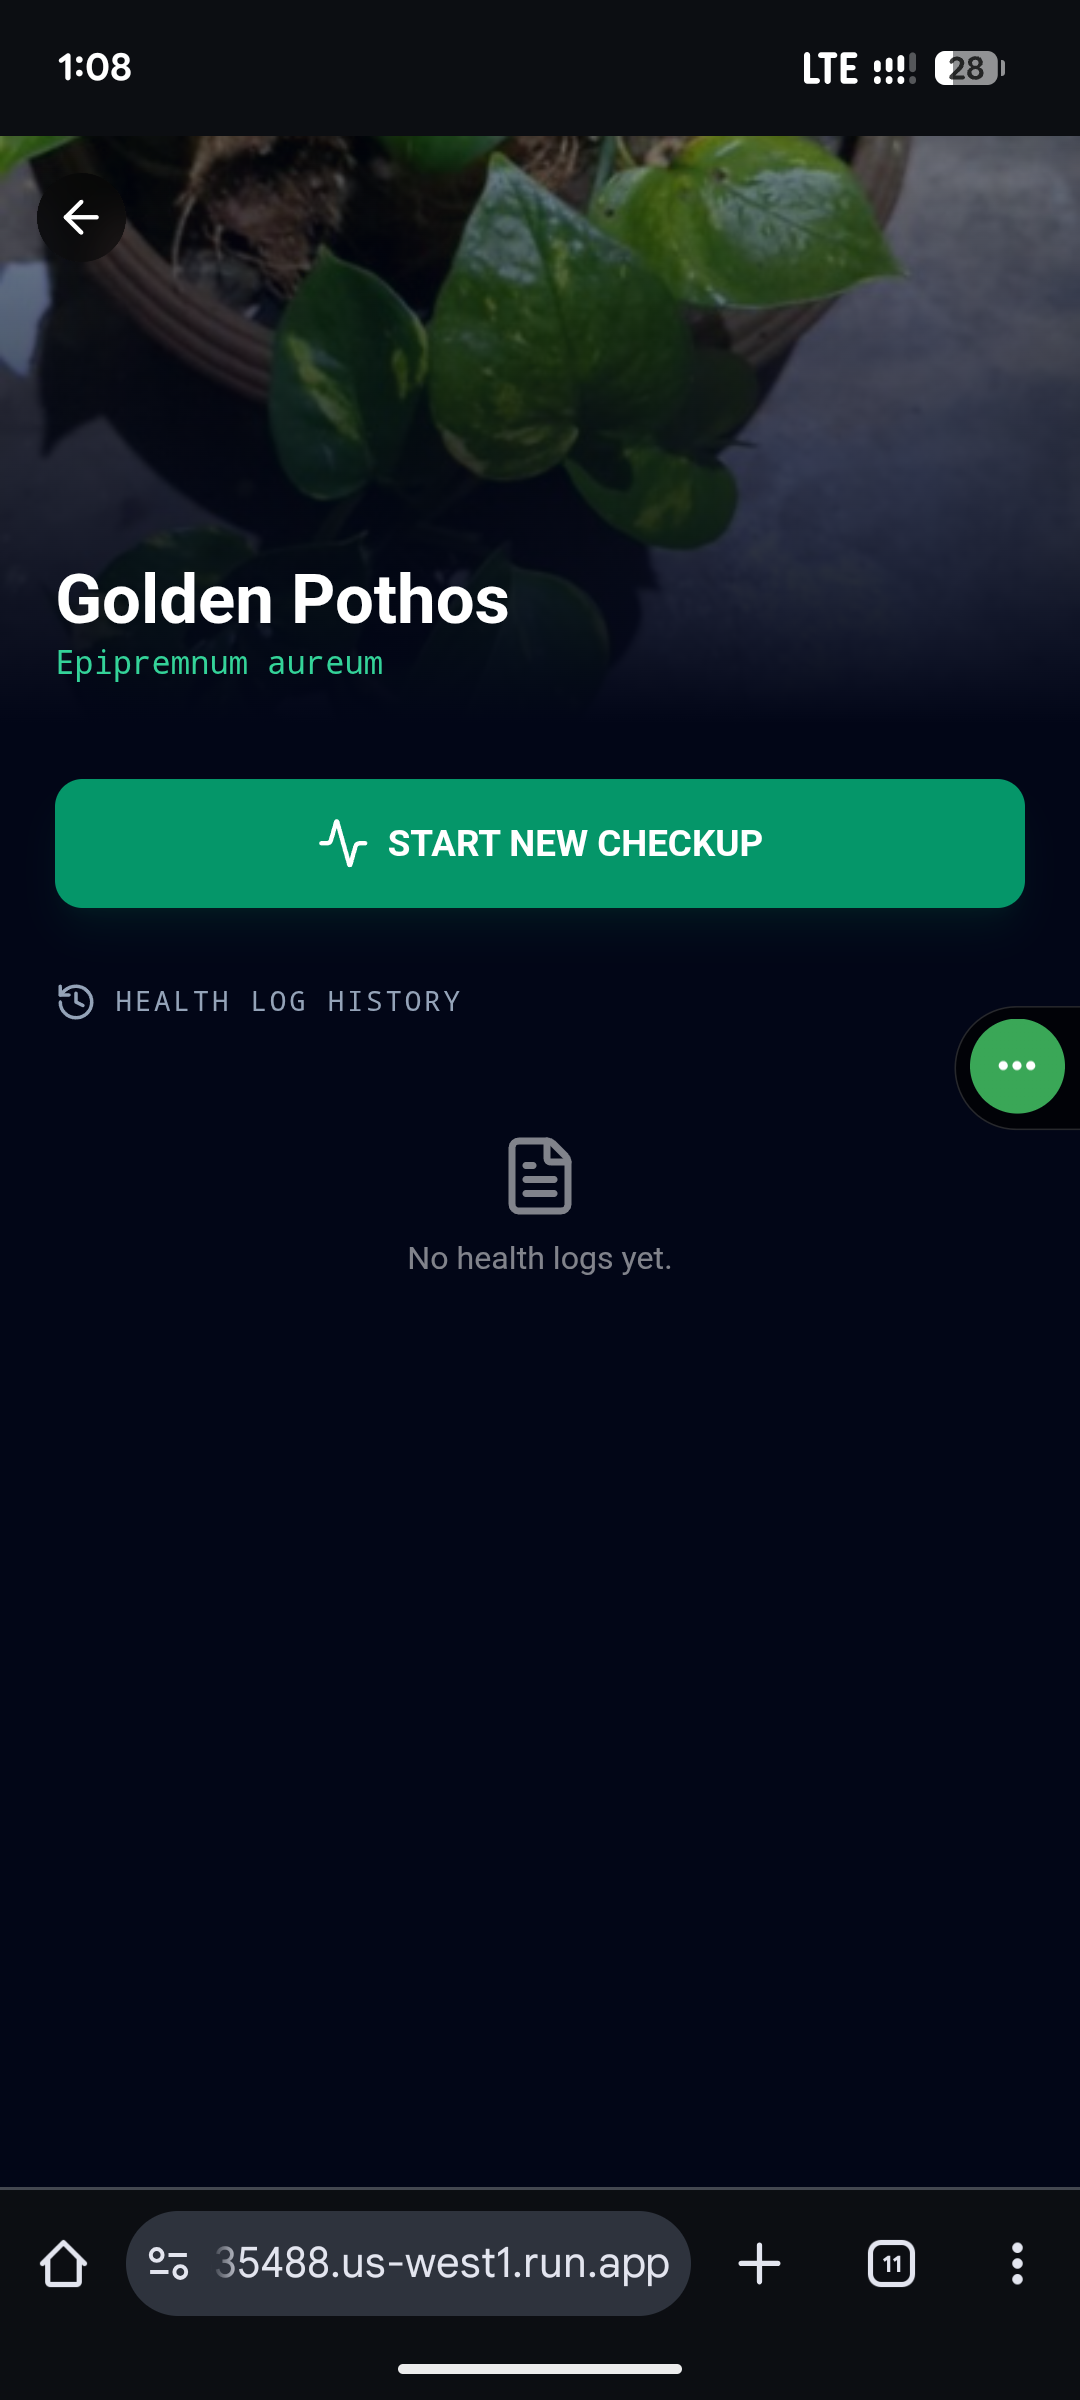
Eco-Forensic Tracker evolves plant identification into a longitudinal health monitor.
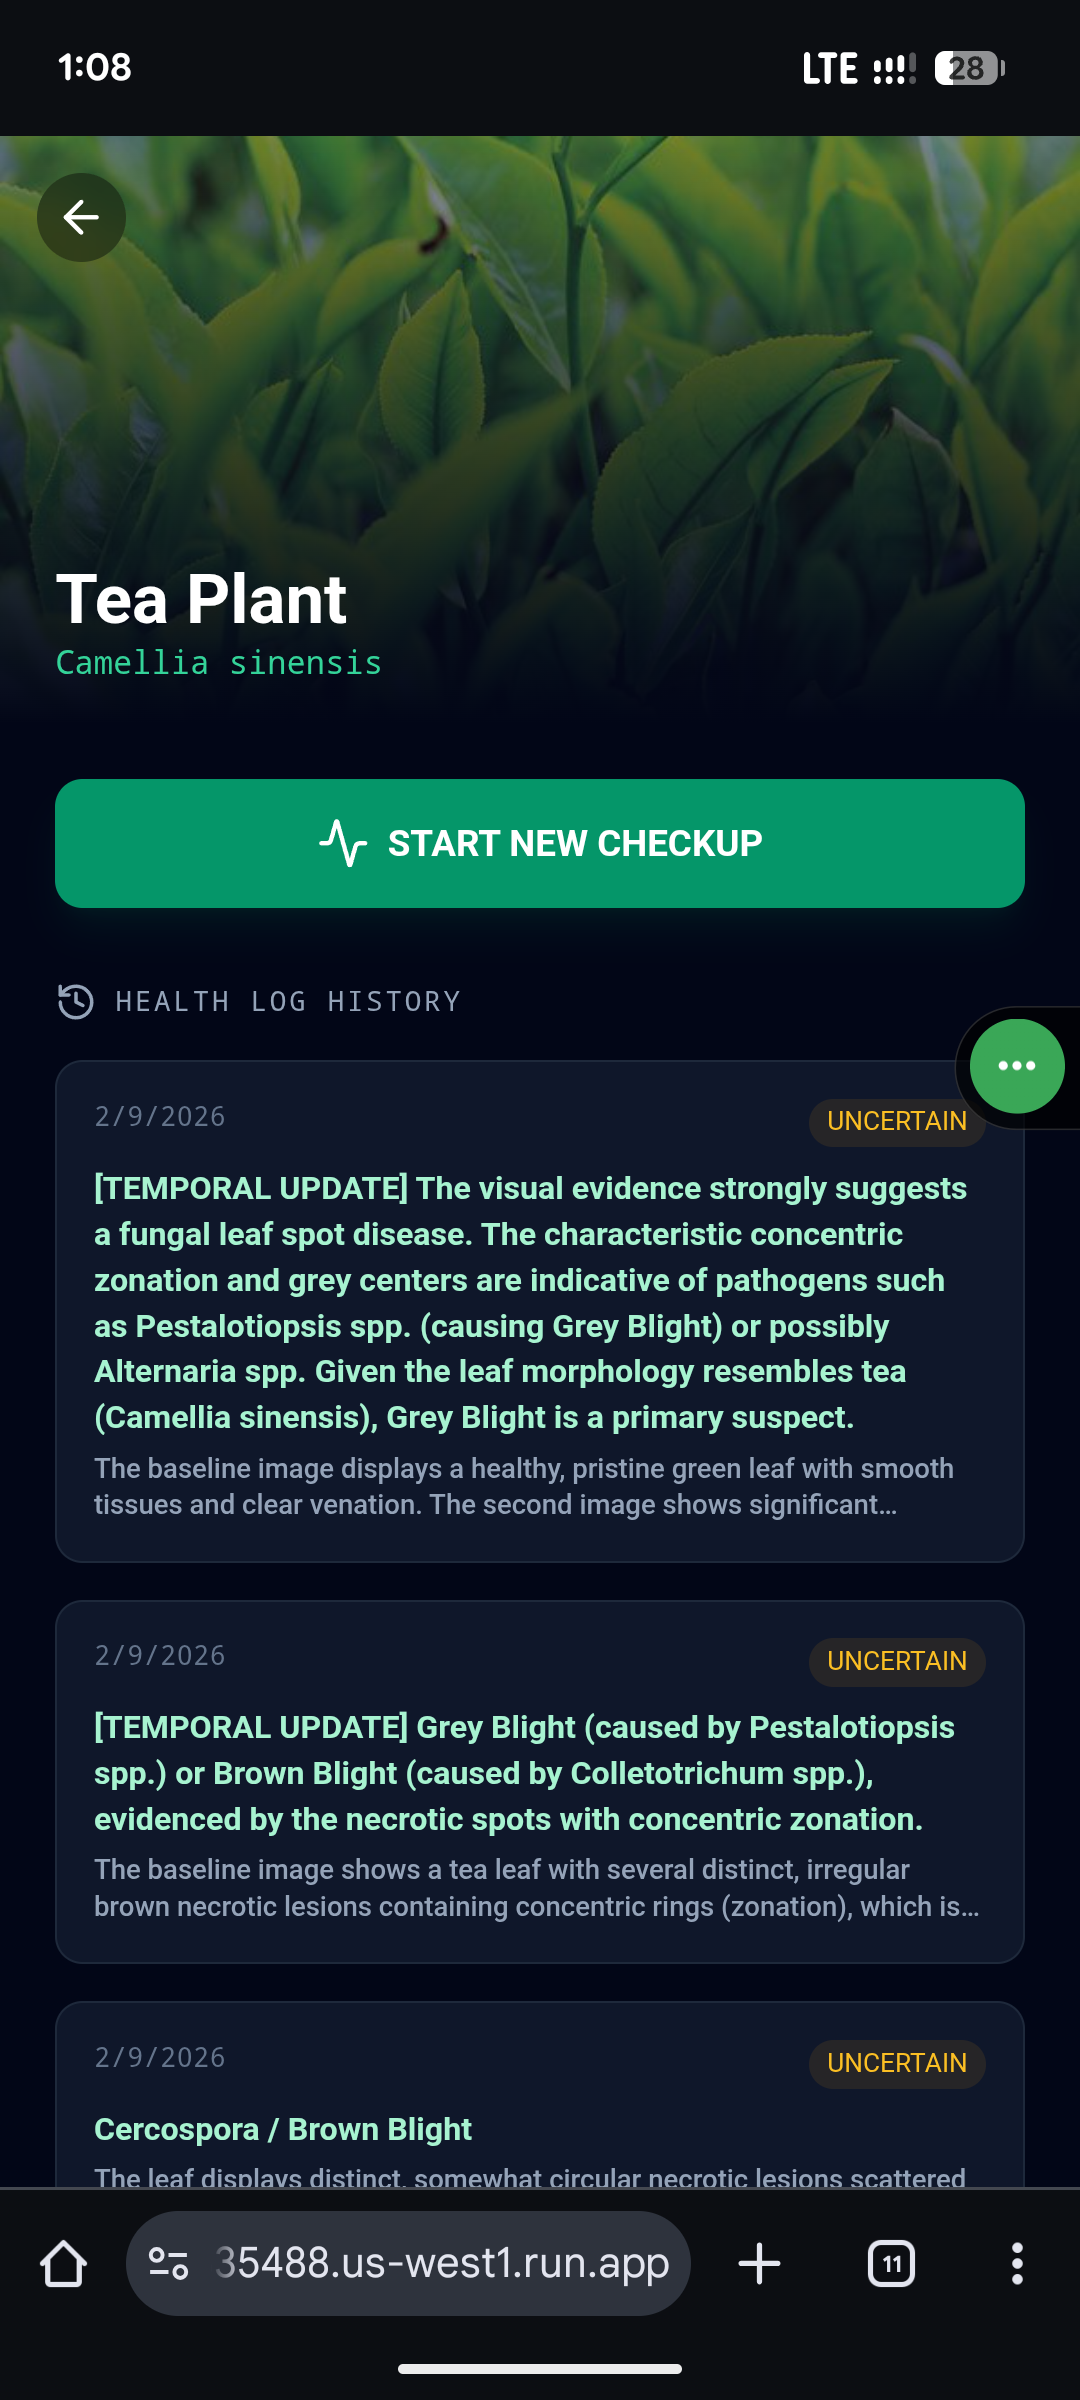
- Temporal Comparative Analysis: It remembers. By comparing today's scan with previous records and weather data, it reasons whether an infection is "Active/Spreading" or "Stable/Recovering."
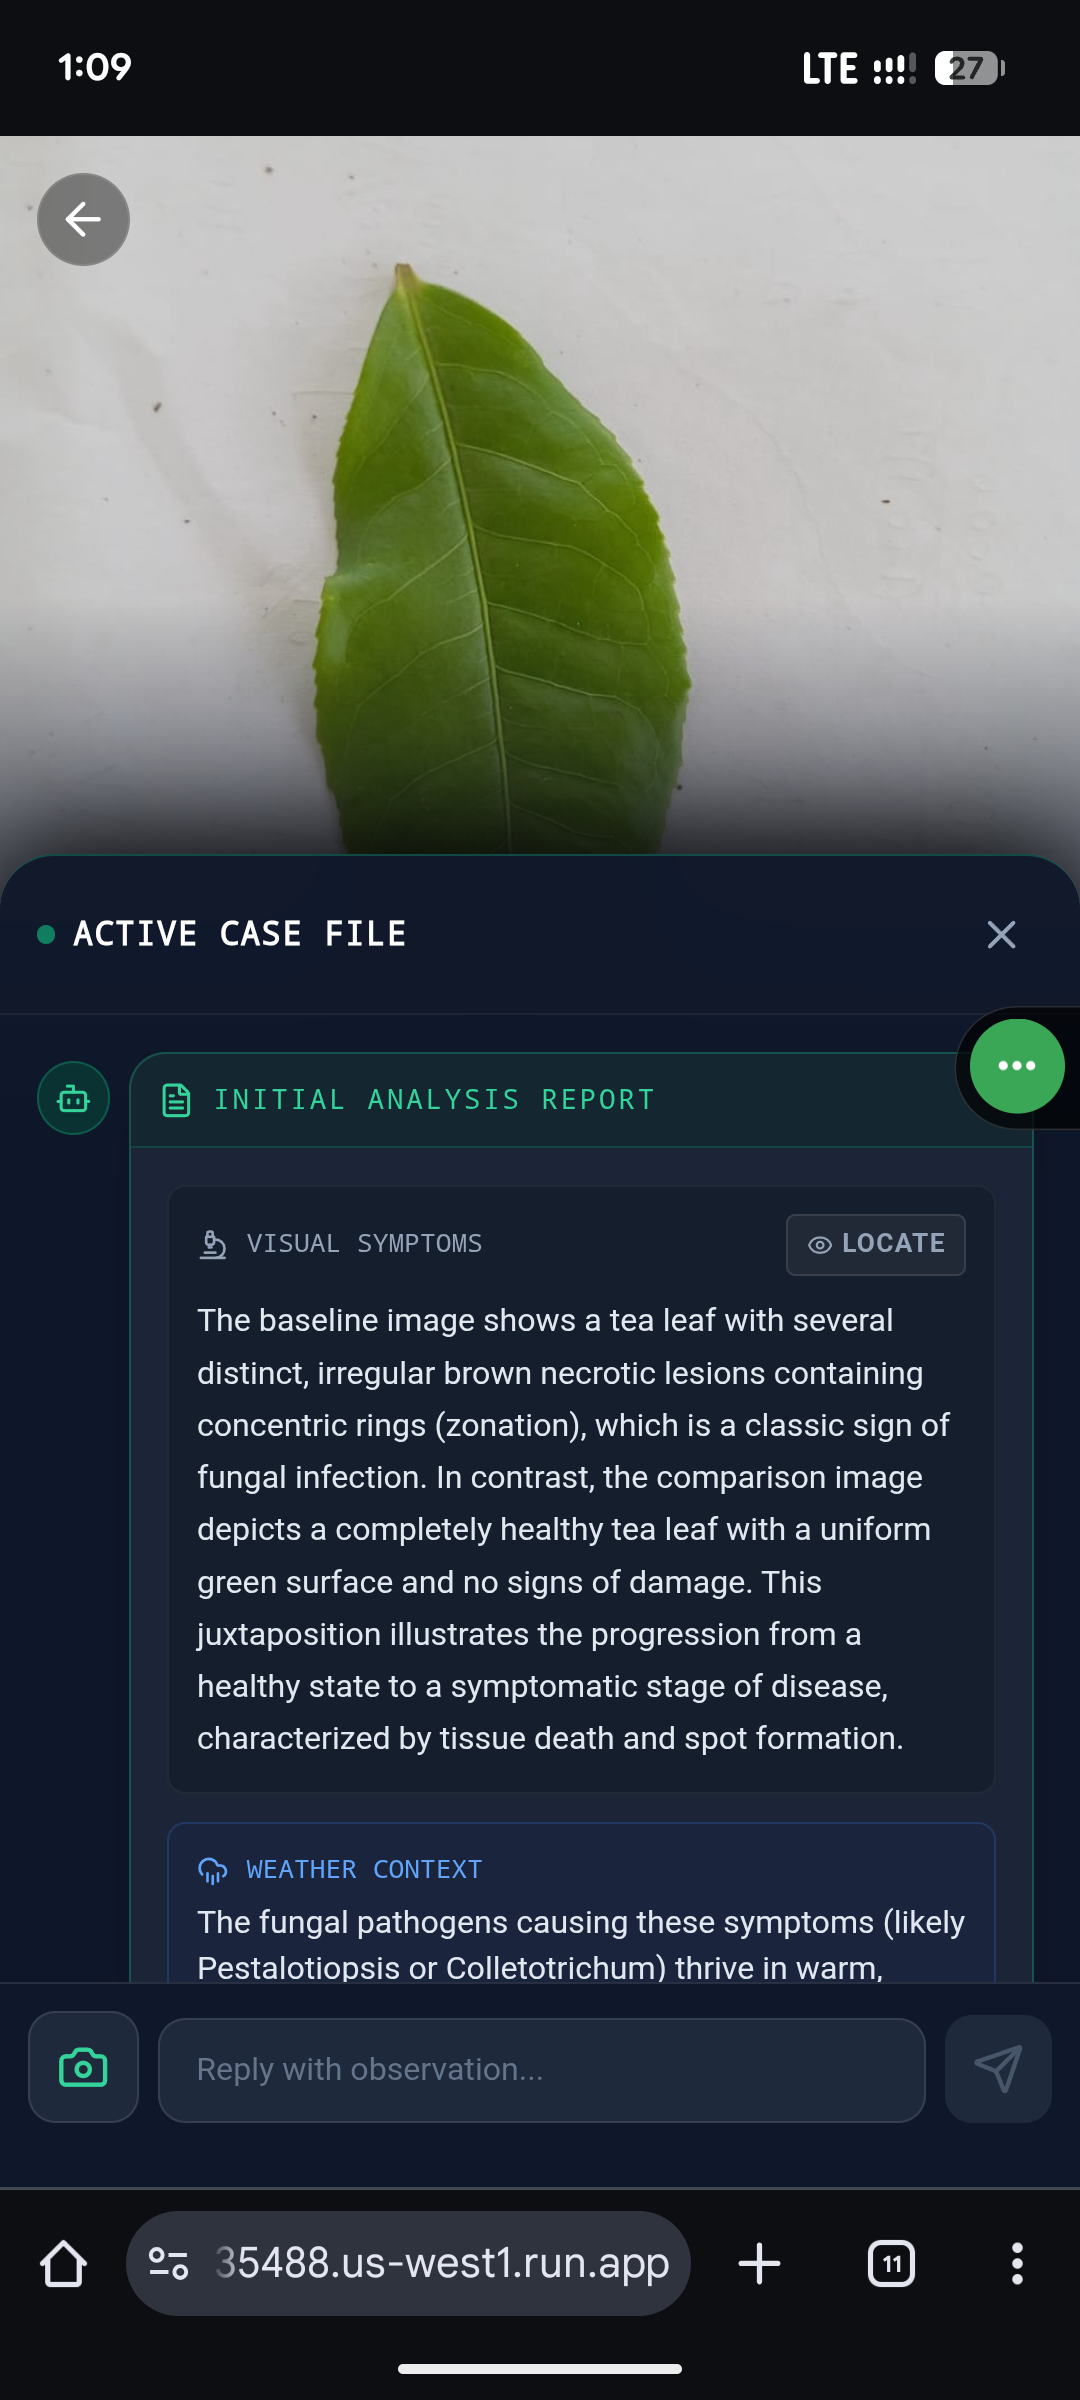
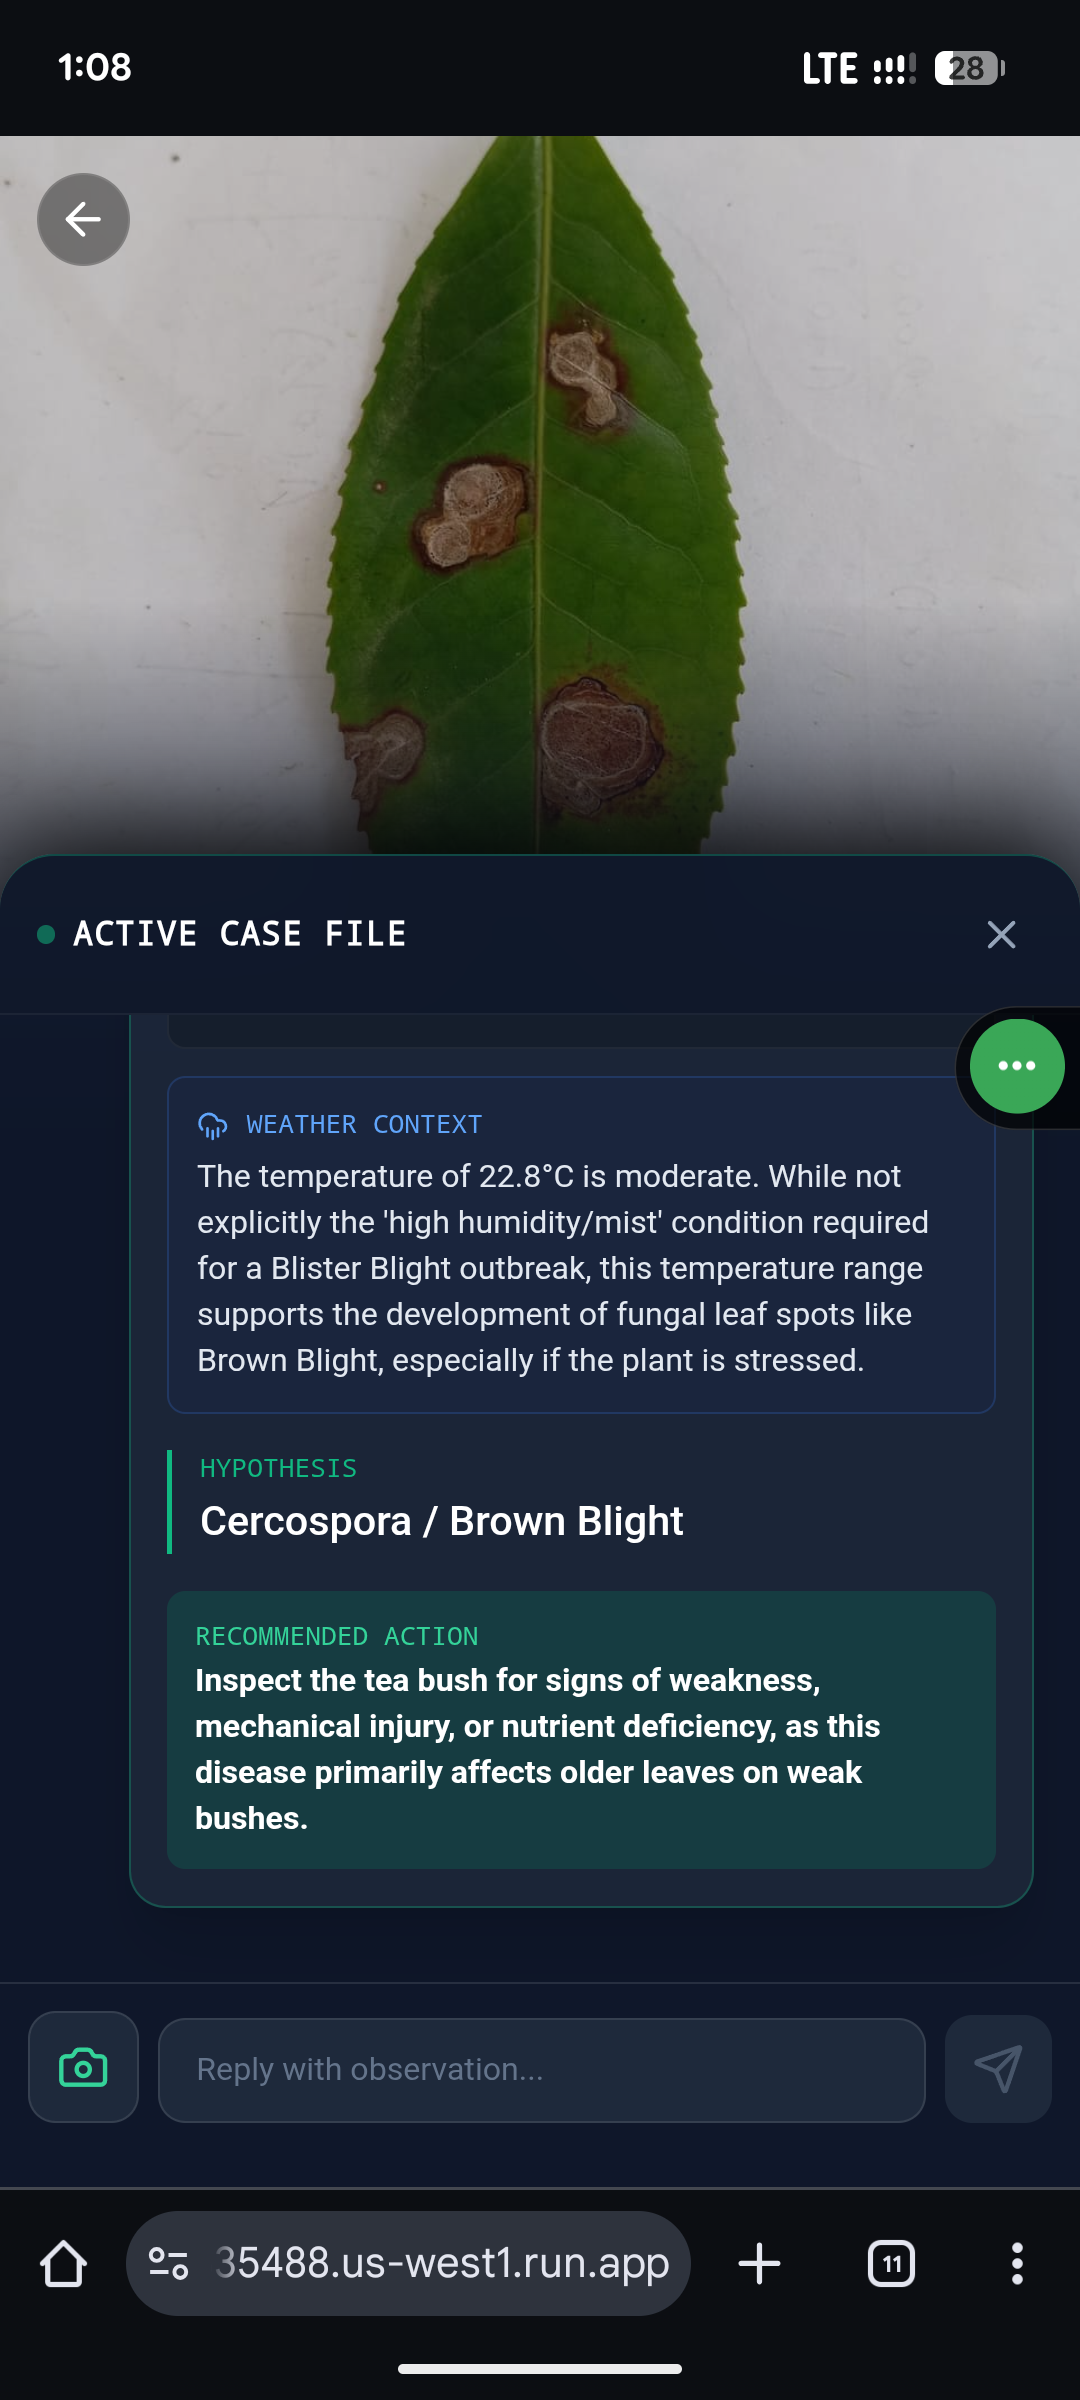
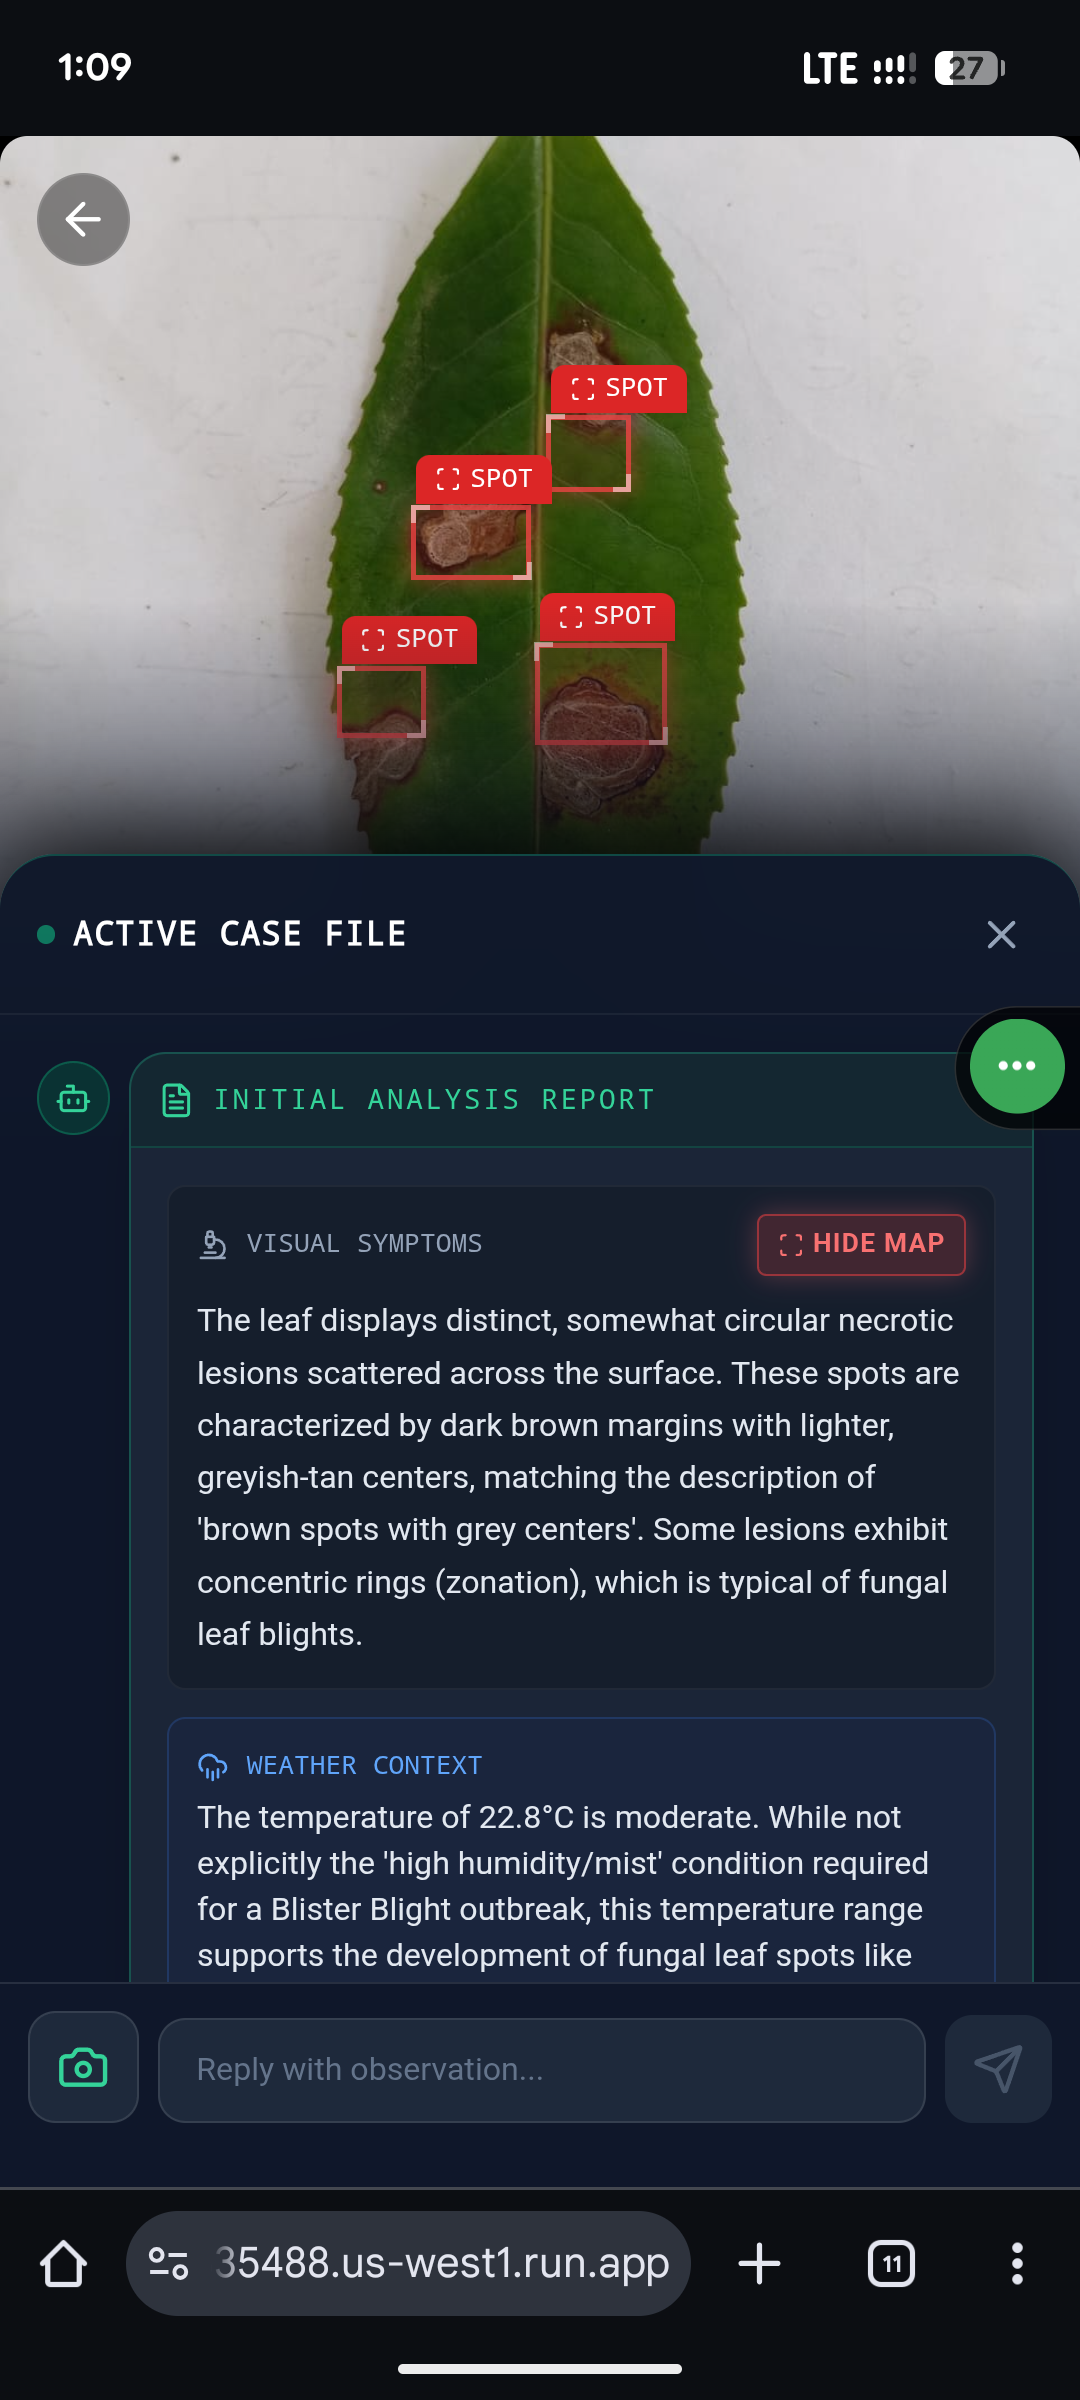
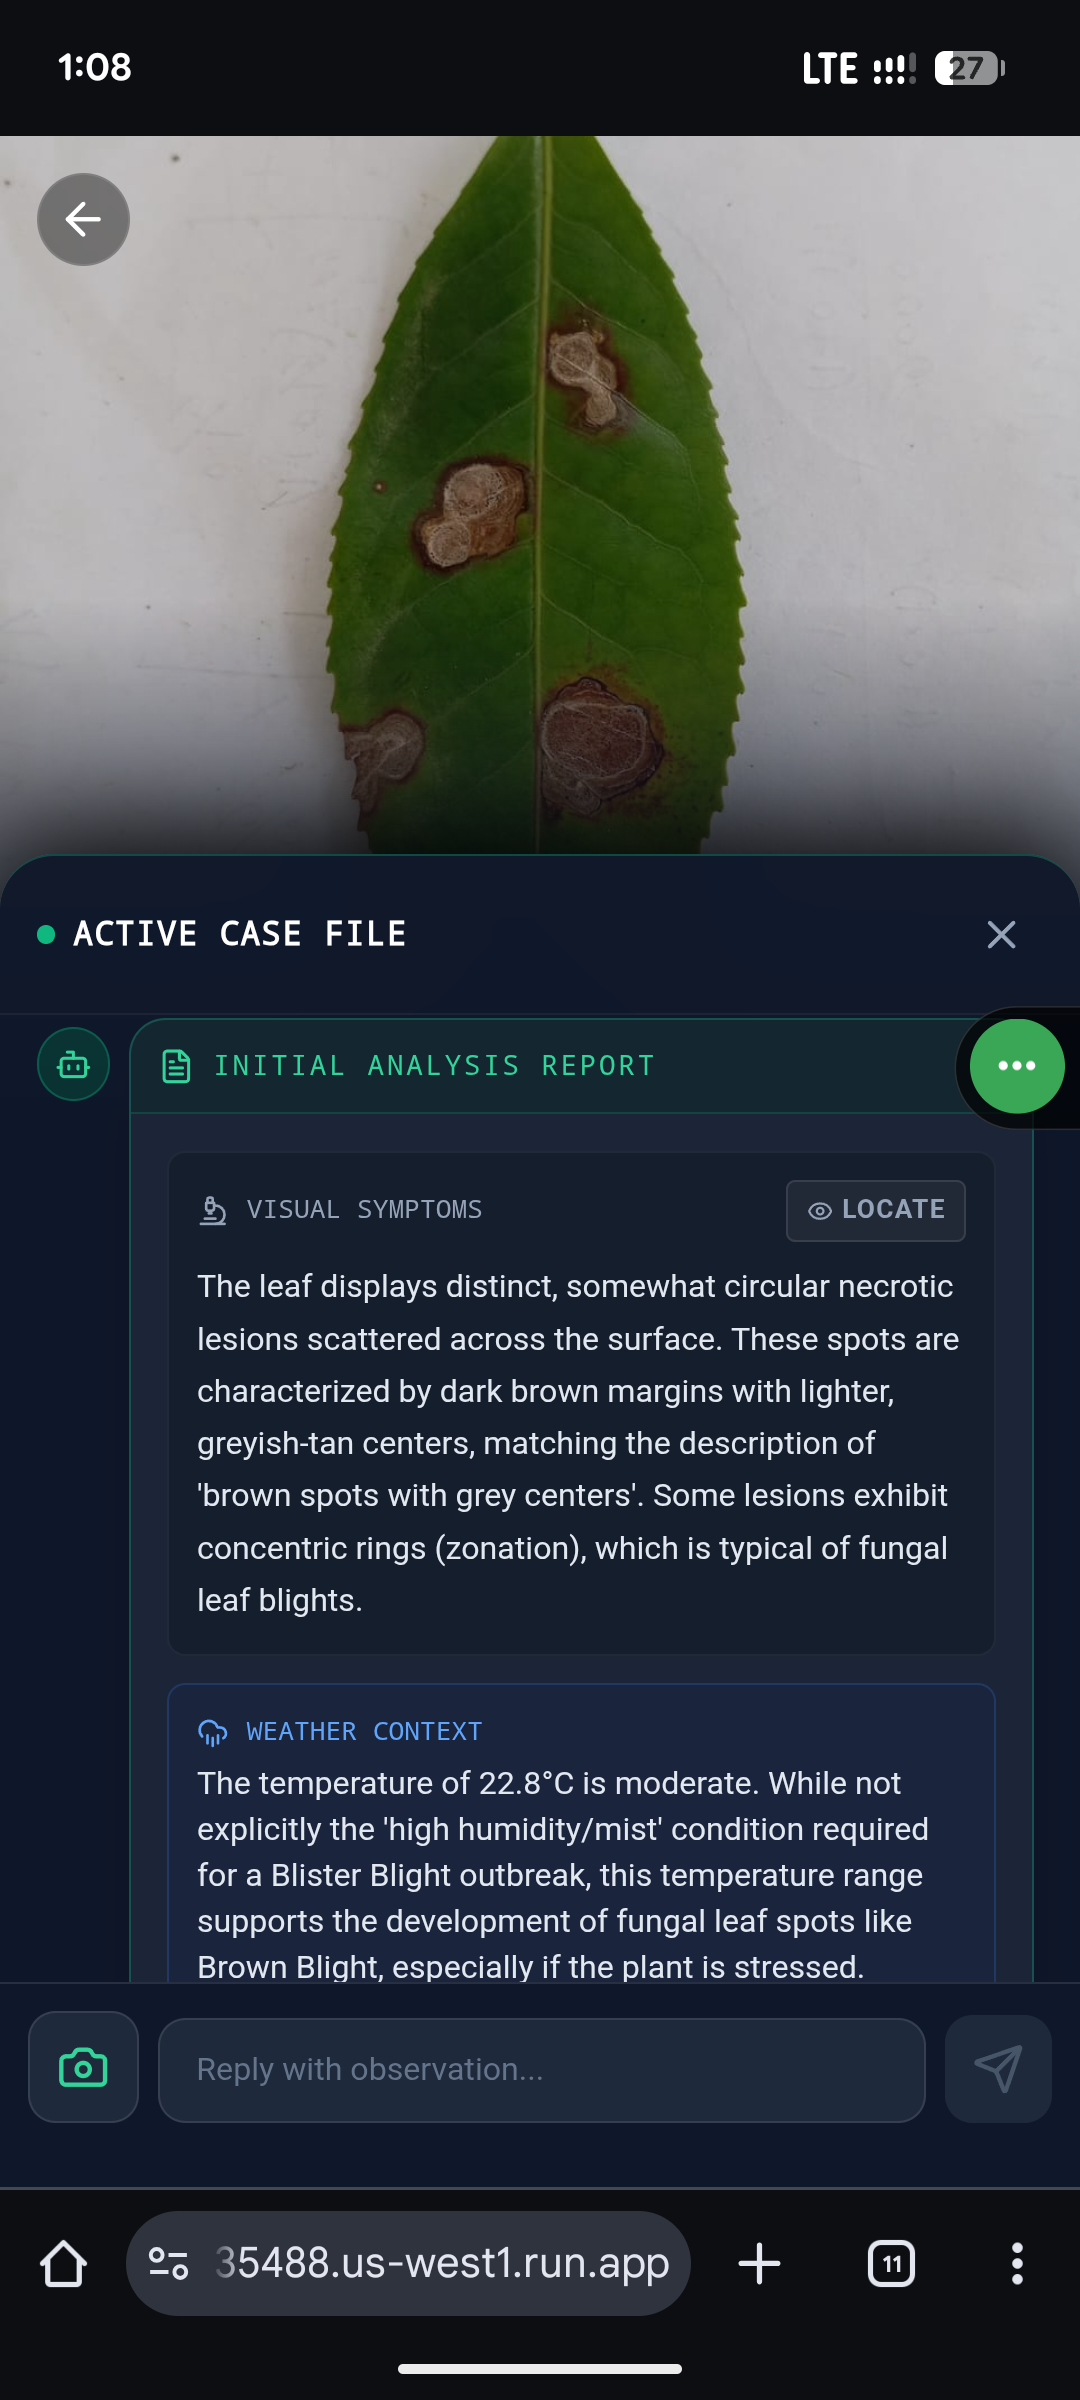
- Symptom Cartographer: Using Gemini 3 Pro, it maps disease vectors directly on the leaf, overlaying bounding boxes to show exactly where the infection is.
- Agentic Chat: Powered by Gemini 3 Flash, it offers a low-latency "Pathologist Chat" that synthesizes historical context into instant, actionable advice.
How we built it
We built a responsive PWA using React and Vite, styled with Tailwind CSS. The core intelligence relies on a Dual-Model Architecture via the Google GenAI SDK:
- Gemini 3 Pro Preview: Handles complex visual reasoning, identifying obscure pathogens and generating precise spatial coordinates (0-1000 normalized space) for the Symptom Map.
- Gemini 3 Flash Preview: Drives the interactive Chat and Prescription generation for instant responses.
- Local Persistence: We used Dexie.js (IndexedDB) to store encrypted case files locally, ensuring fast performance even in remote fields.
Challenges we ran into
- Coordinate Hallucination: Getting an LLM to output precise
[ymin, xmin, ymax, xmax]coordinates for the "Symptom Map" was difficult. We solved this by enforcing a strict JSON schema and using "Chain of Thought" prompting. - Model Stability: Experimental models occasionally returned non-standard JSON. We built a robust "Crash-Proof Extraction" helper to parse text regardless of the API's response structure.
Accomplishments that we're proud of
- The "Symptom Cartographer": Successfully visualizing exact infection zones on a static image, transforming the AI from a "black box" into a tool that shows its work.
- The "Time Machine": Implementing the logic to compare two images from different dates, allowing the AI to reason about disease progression rather than just static identification.
What we learned
We learned that multimodality is not just about "seeing," but "reasoning." A model can identify a "leaf spot," but it takes a specialized prompt to understand if that spot has grown since yesterday. We also discovered the power of a Hybrid Model Strategy—using Gemini 3 Pro for deep analysis and Gemini 3 Flash for speed creates the optimal user experience.
Built With
- dexie.js
- framer-motion
- gemini-3-flash
- gemini-3-pro
- google-gemini-api
- gps
- indexeddb
- react
- tailwind-css
- typescript
- vite

Log in or sign up for Devpost to join the conversation.