💡 Inspiration
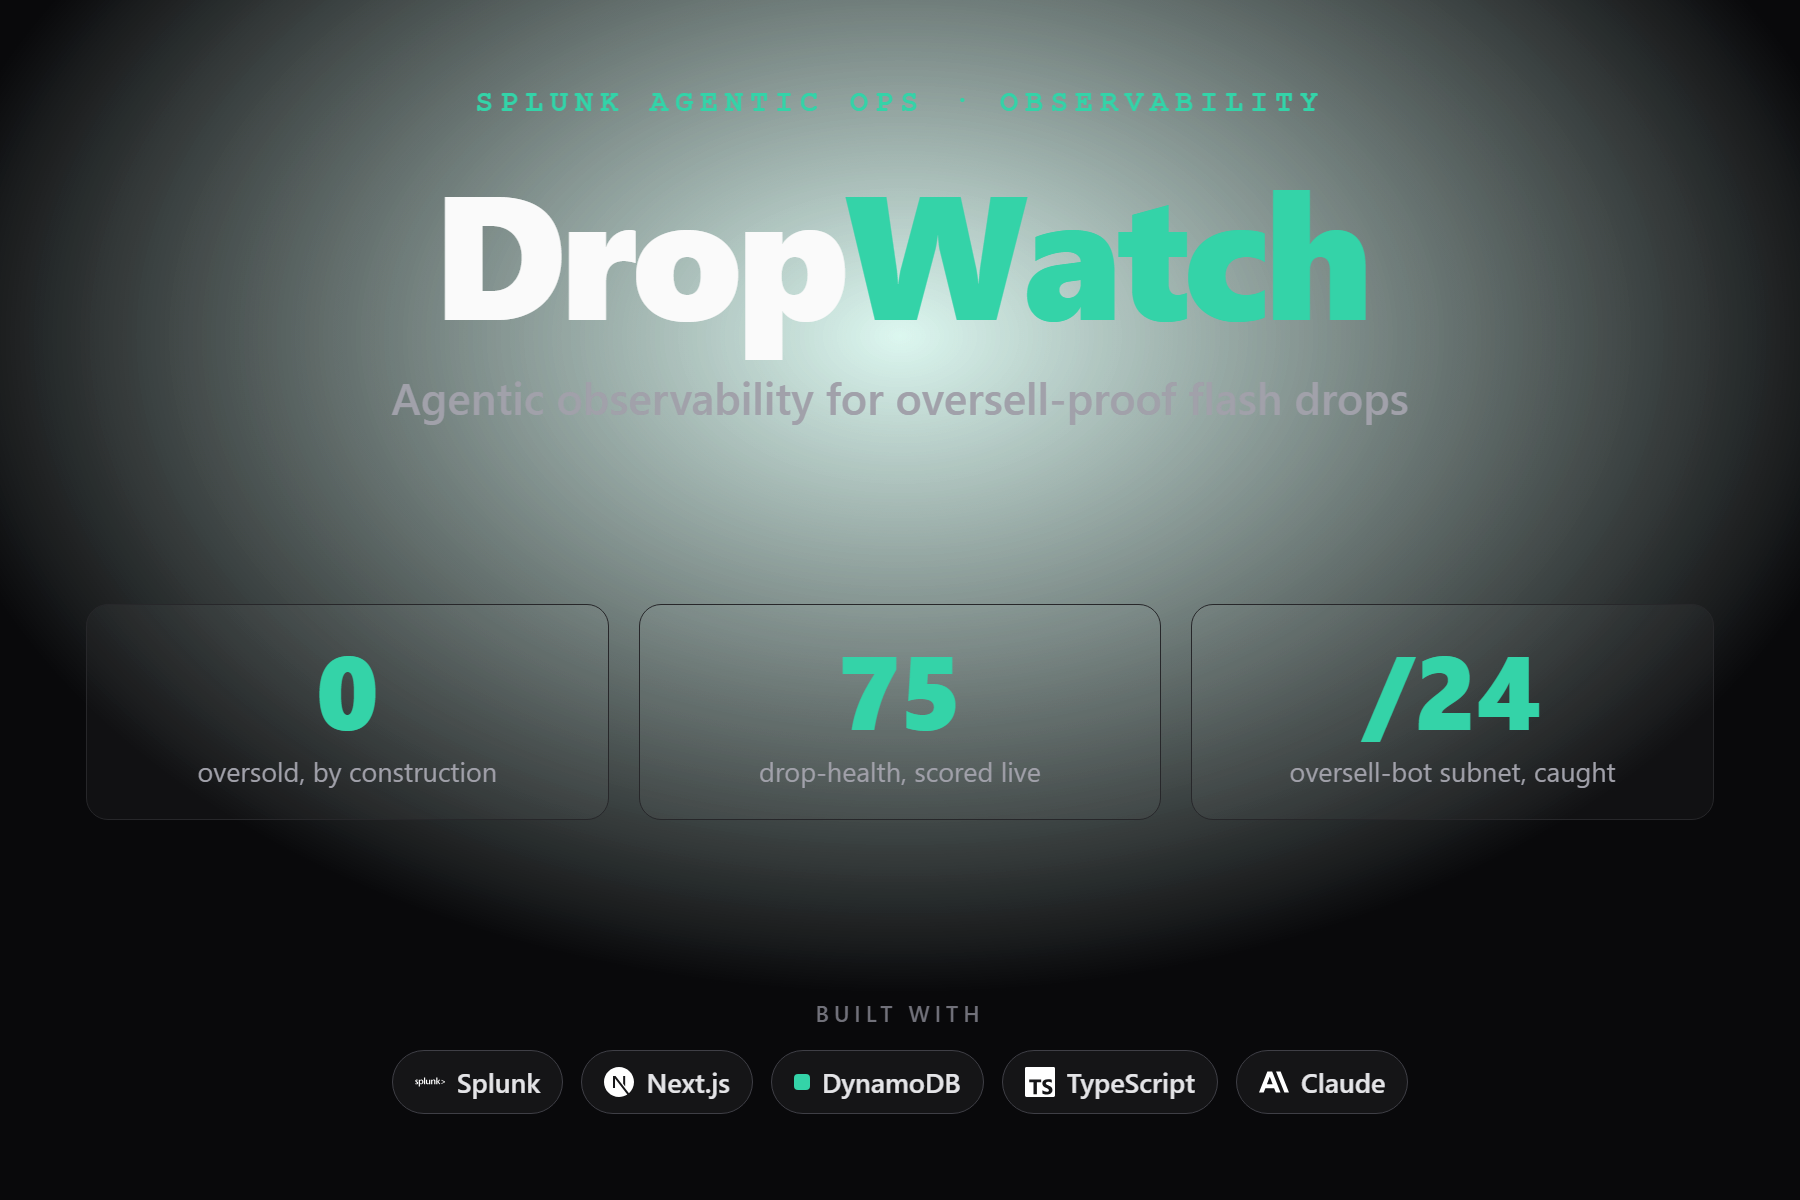
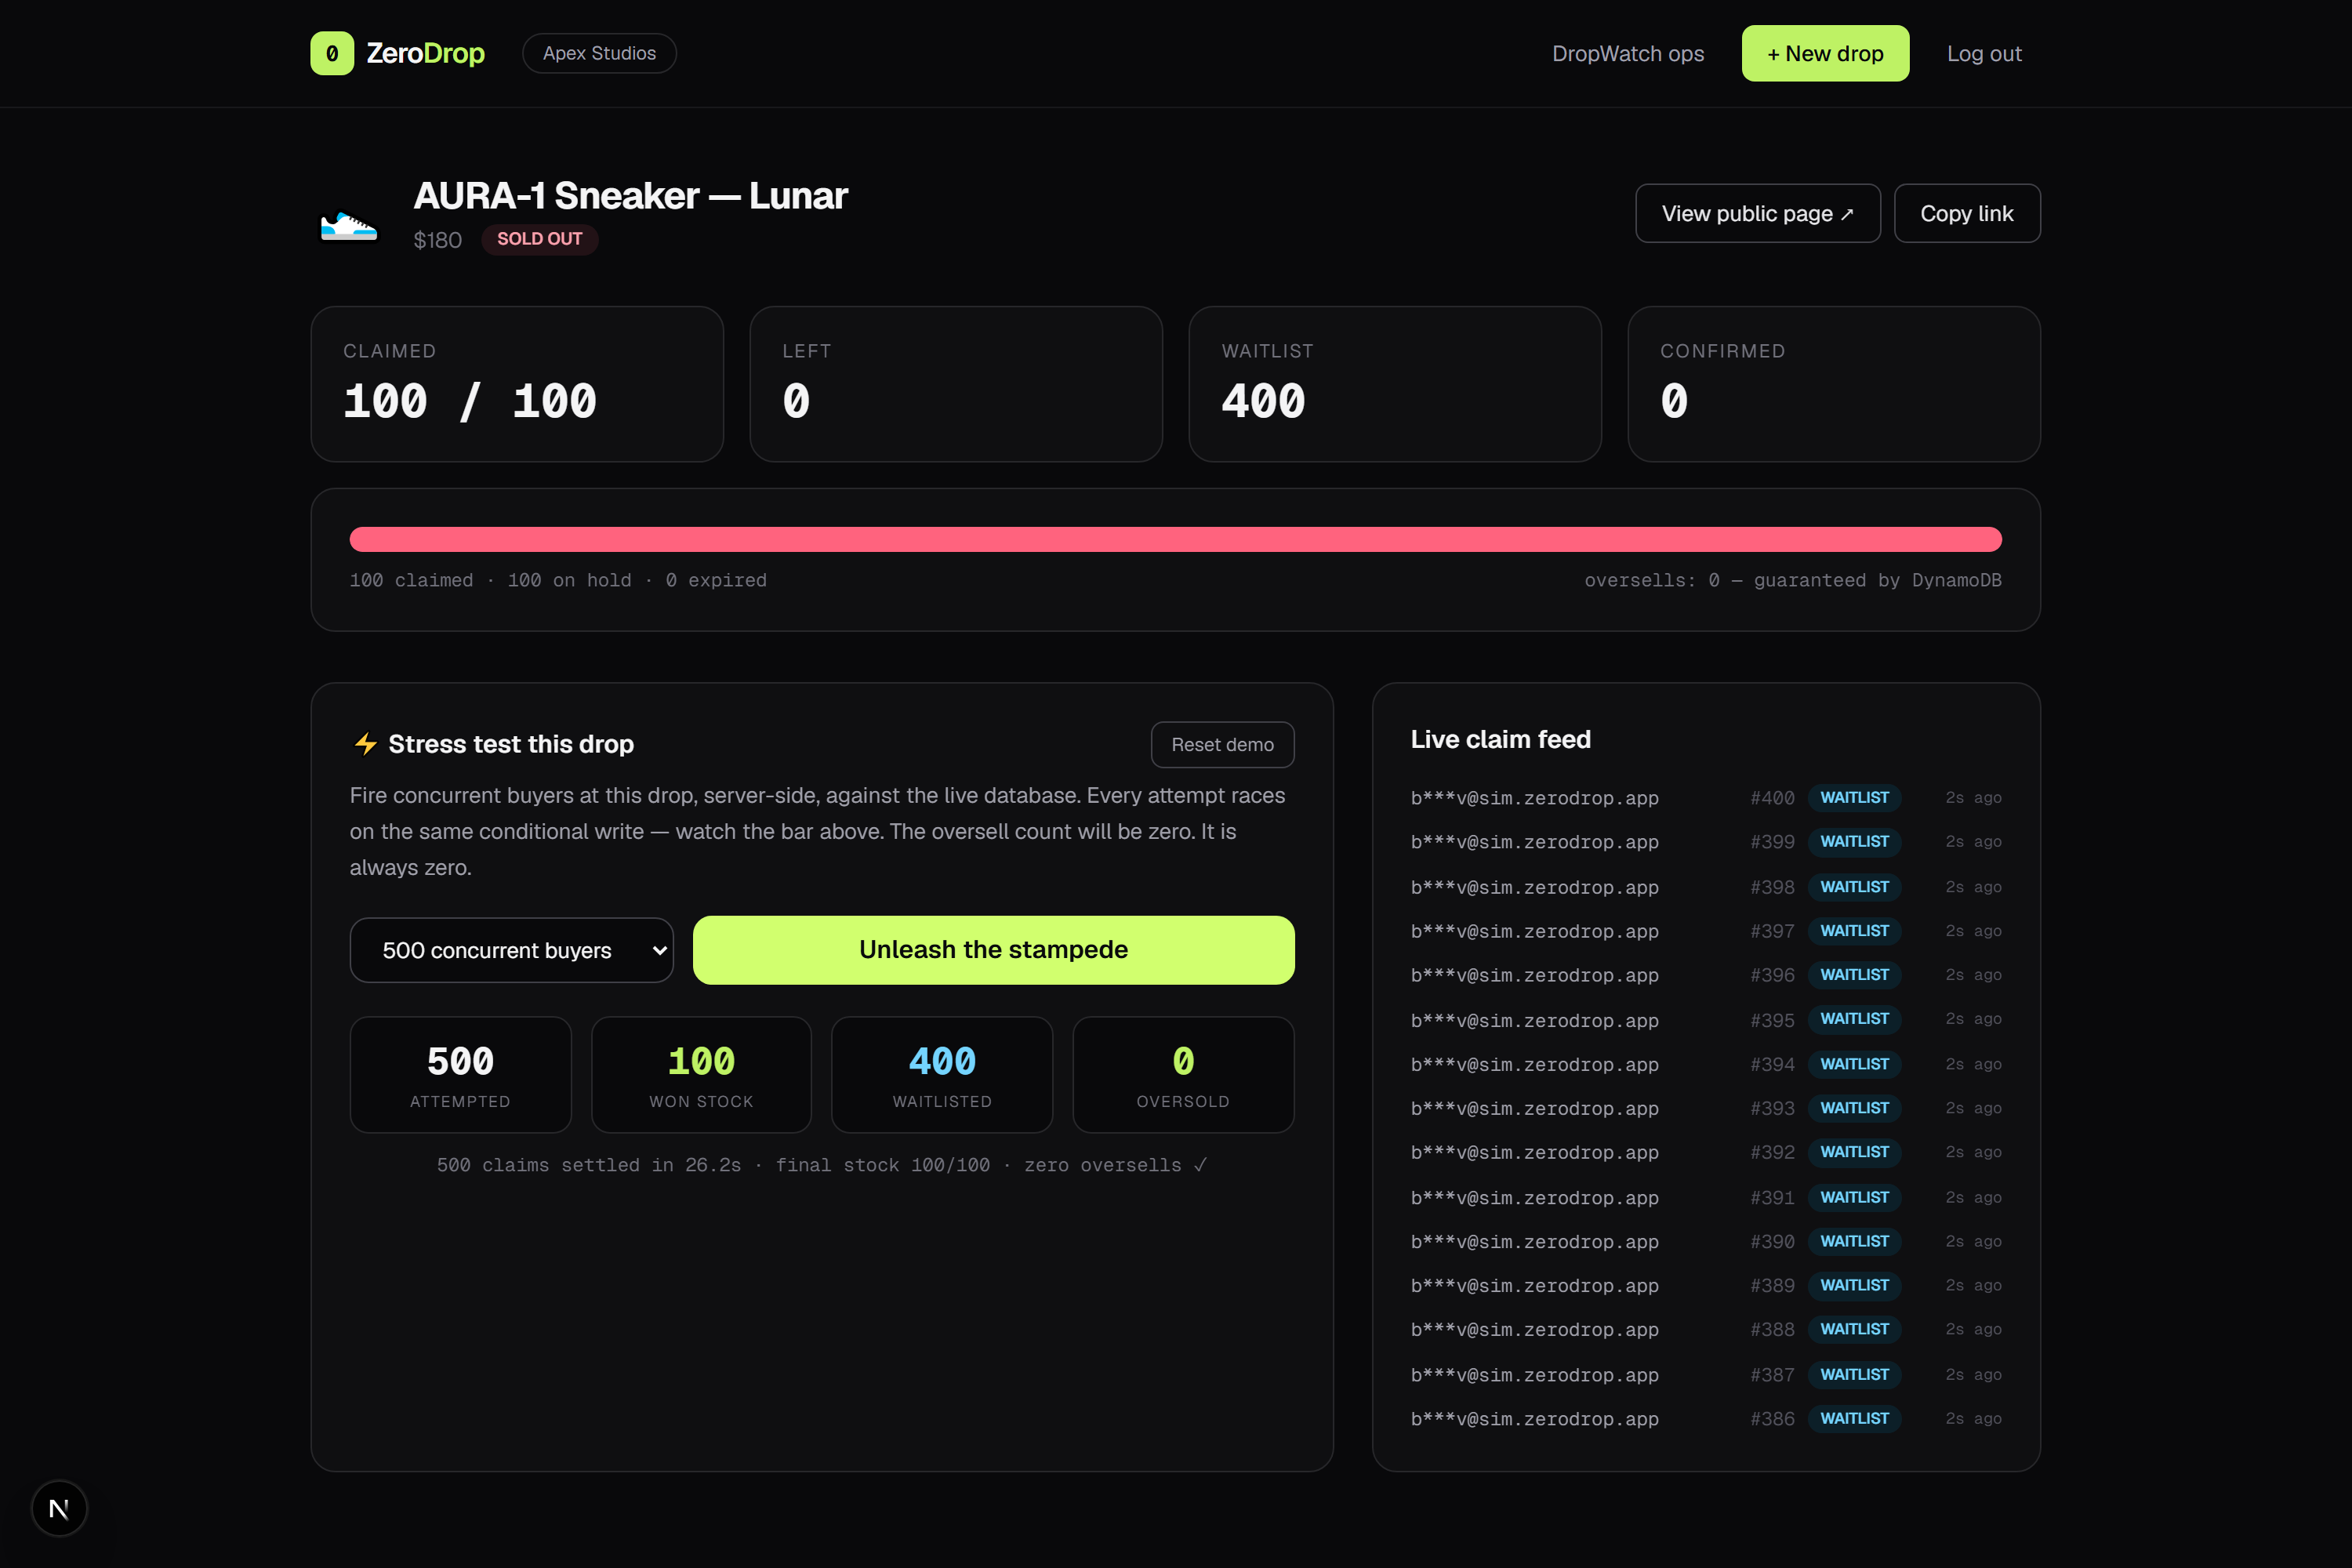
We have all watched a hyped drop go sideways. The "limited to 100 pairs" sneaker somehow sells 130, and the brand spends the next week apologizing online instead of celebrating a sellout. ZeroDrop, the app underneath this project, exists to make that exact failure impossible: every claim is a single DynamoDB conditional write, so even a thousand buyers hammering the same item at the same instant land on exactly N of N, with zero oversold.
Once overselling is off the table, though, a more interesting question shows up. The drop is safe, fine, but what is actually happening in those frantic ninety seconds? Who is a real fan and who is a bot farm? When did the stampede really start? Are holds expiring faster than people can check out? A green "all good" light is not an answer. We wanted an operator's co-pilot that watches the drop, understands it, and acts. That is DropWatch.
⚡ What it does
DropWatch turns a live flash drop into a stream of structured events and puts an agent on top of it.
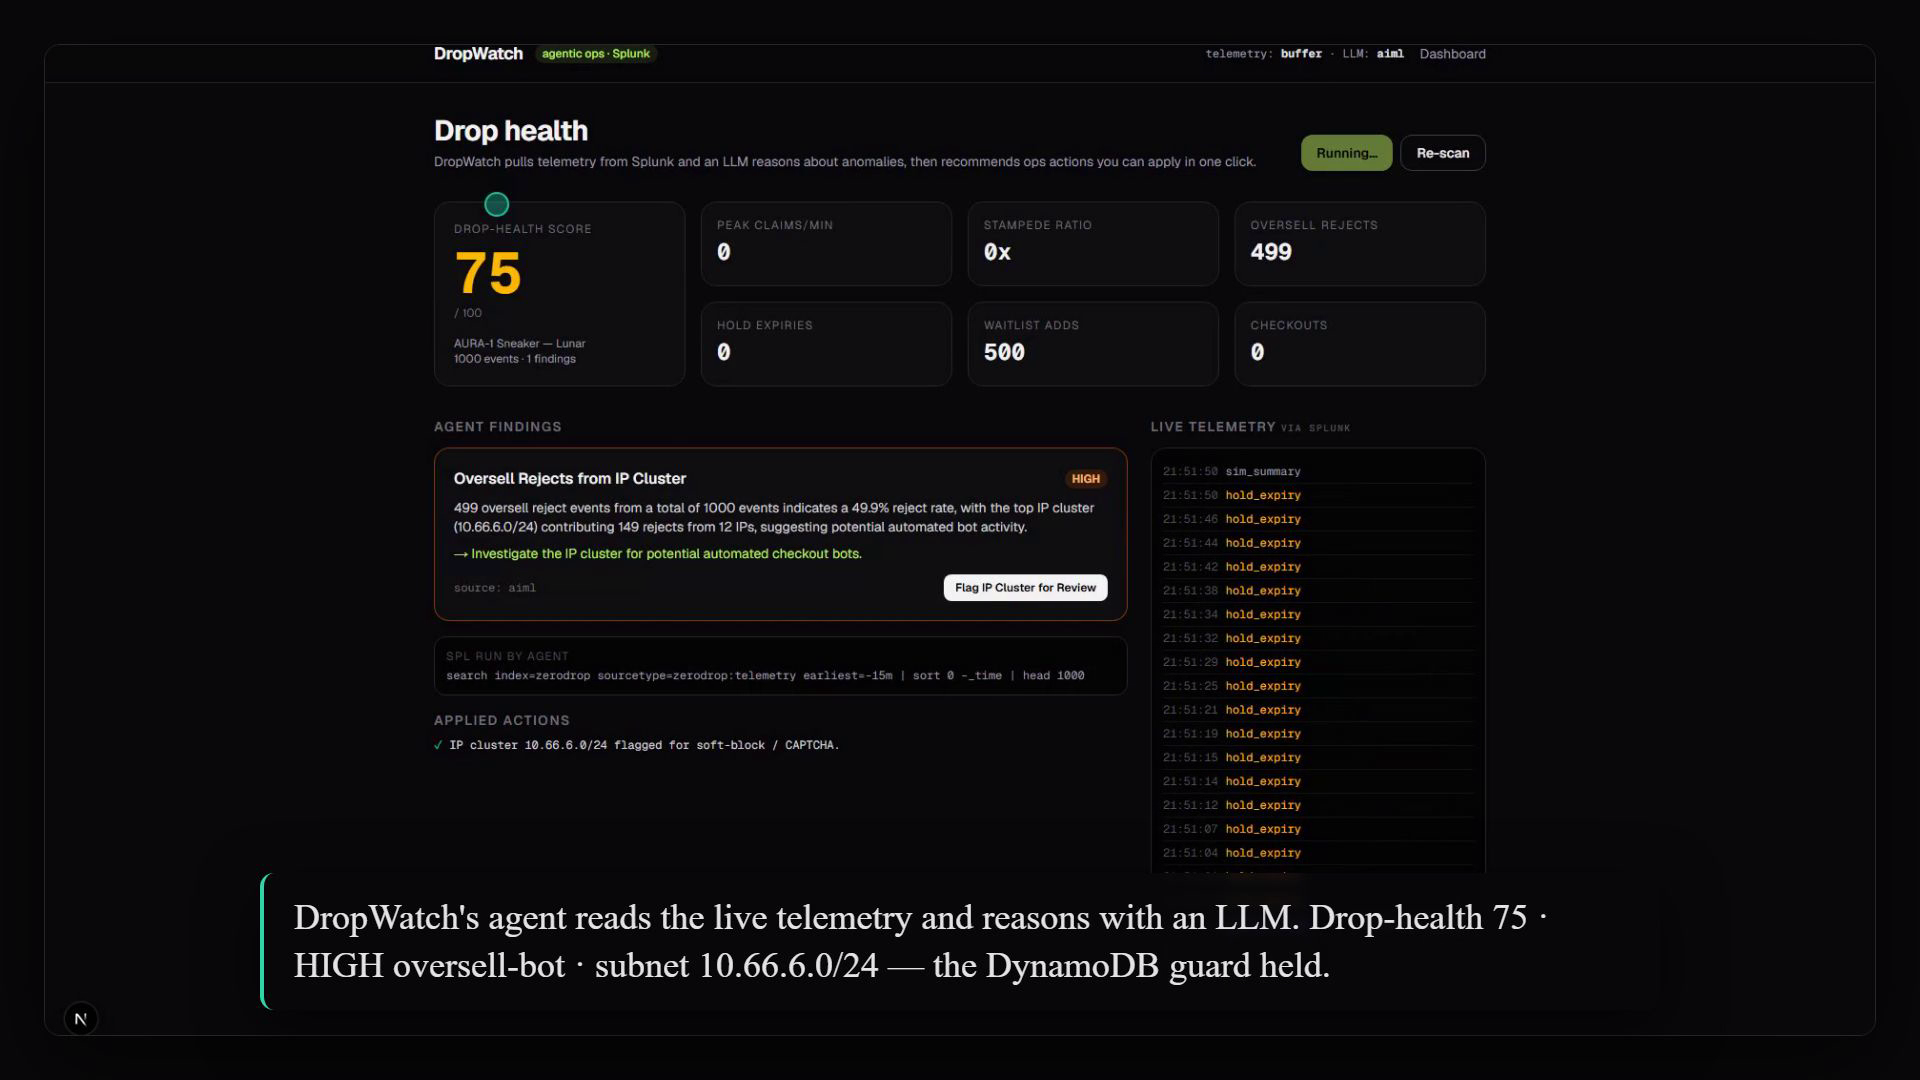
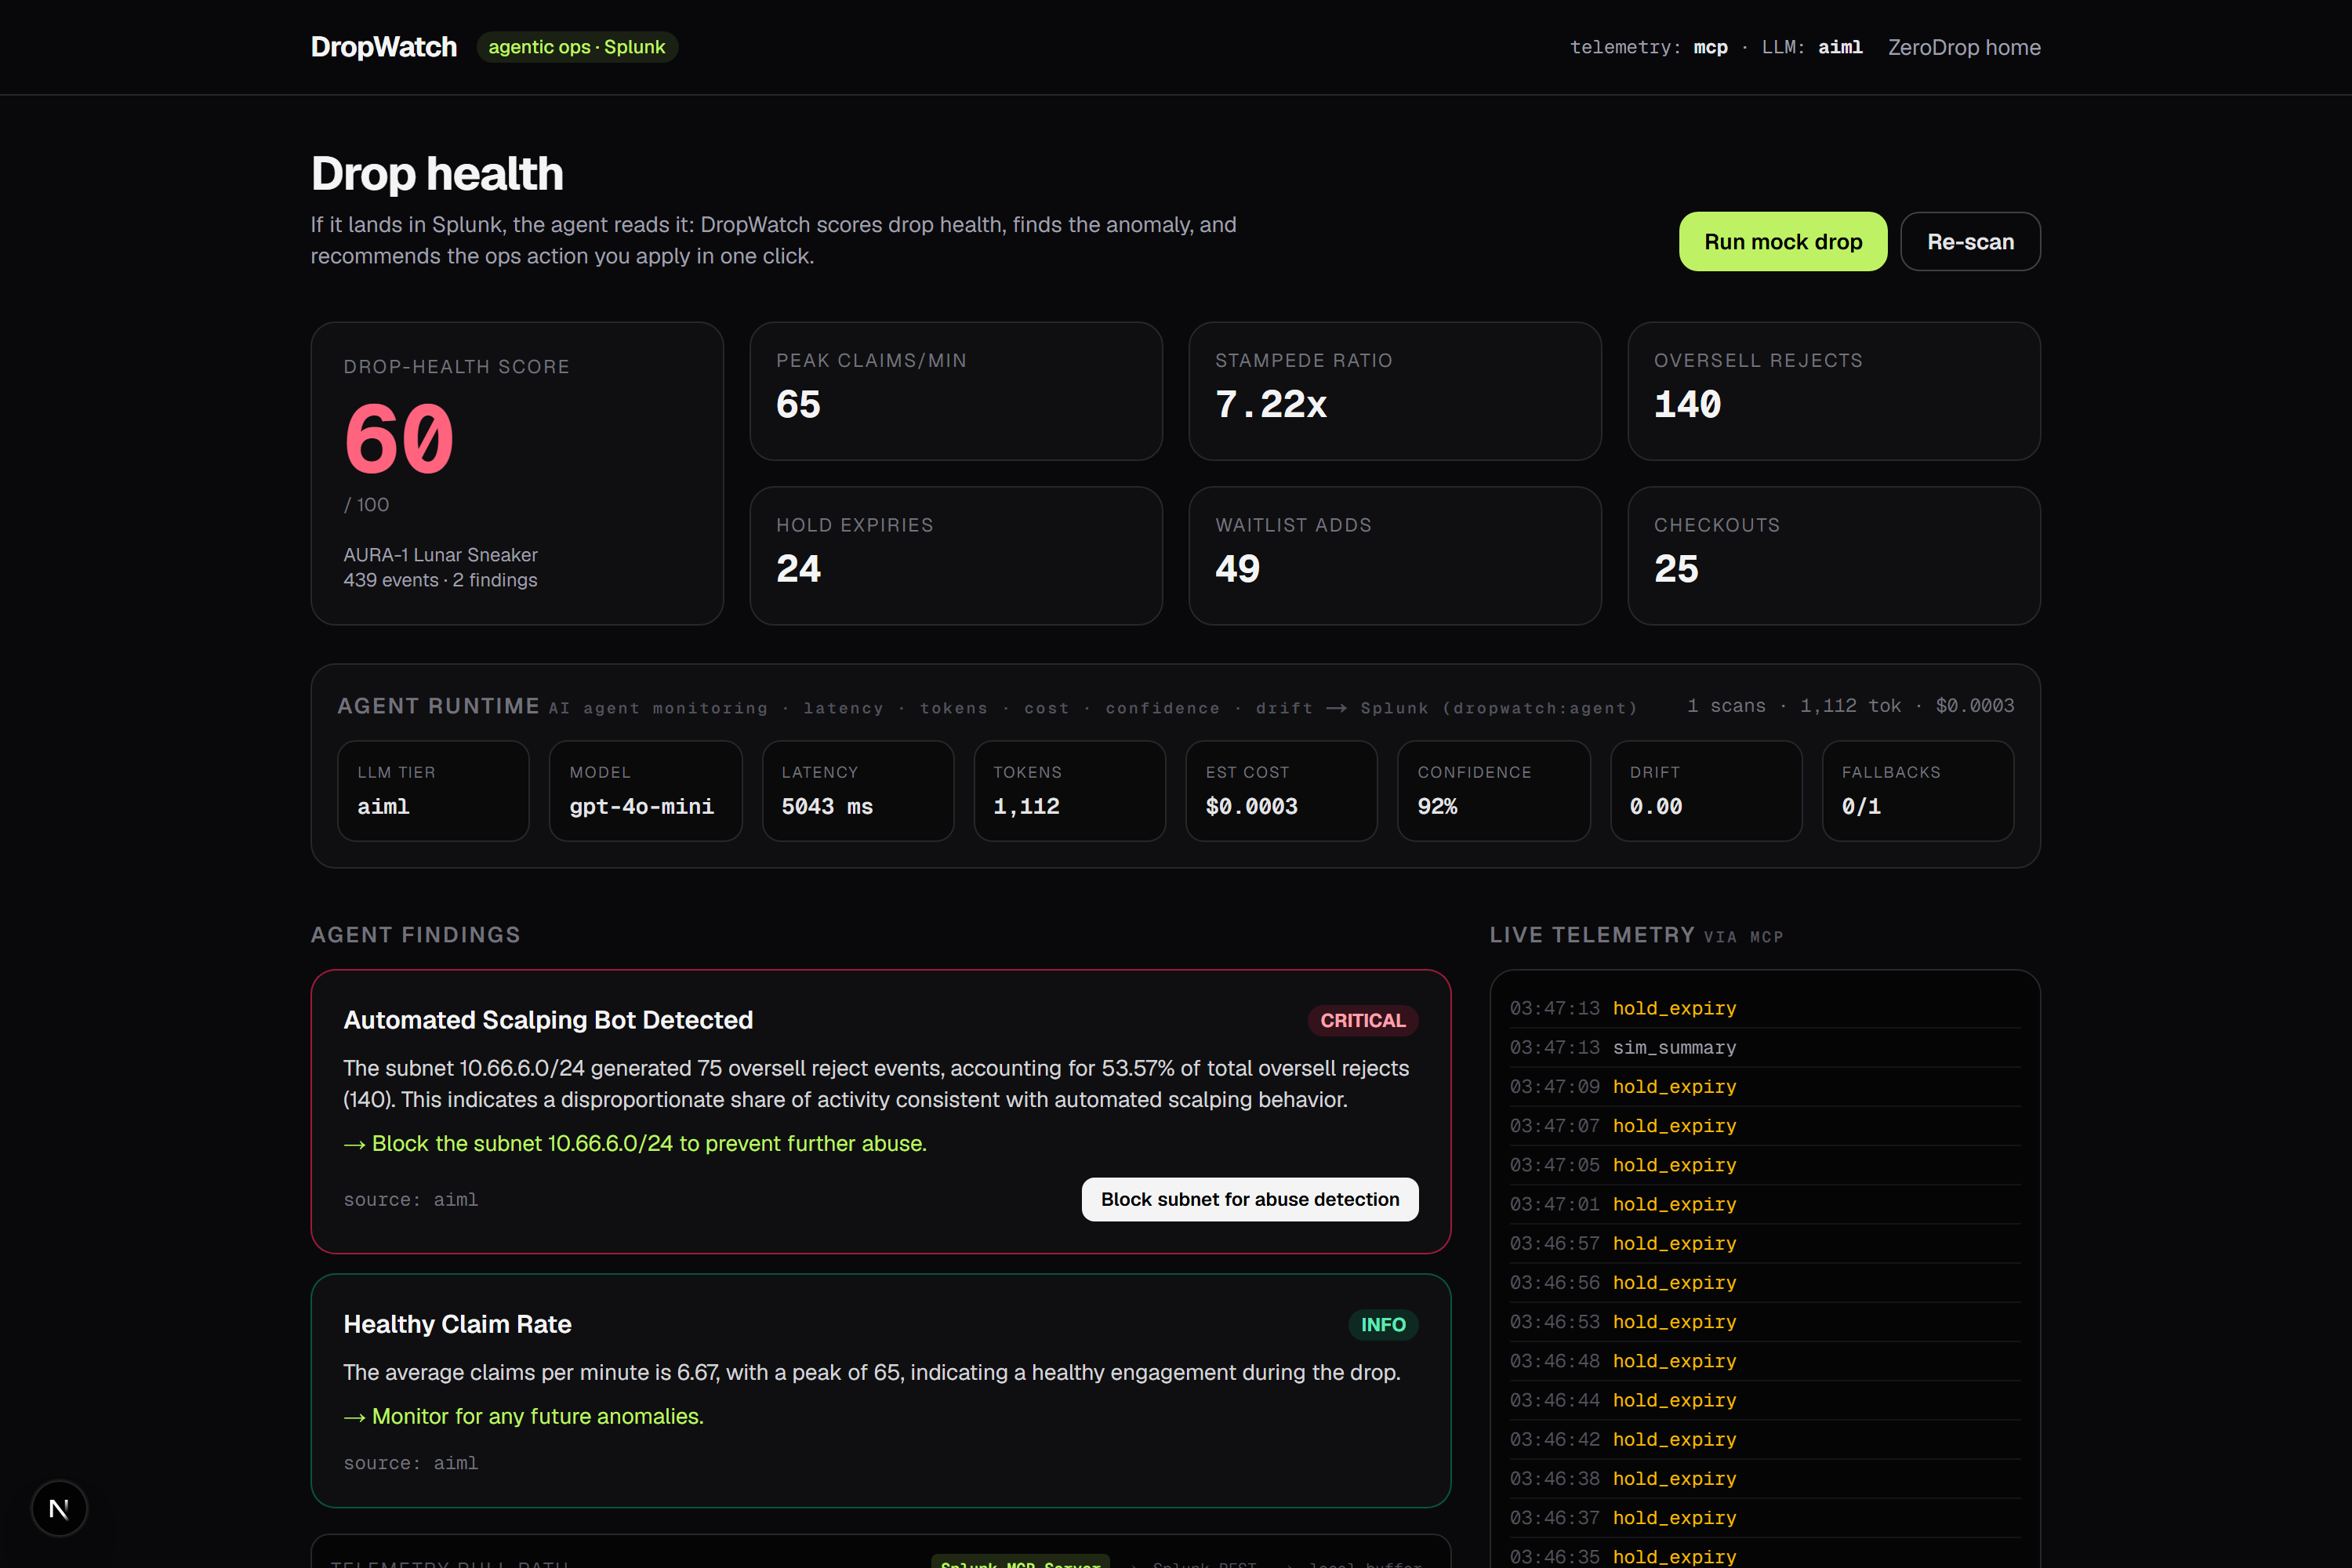
Every hot path in ZeroDrop (claim, hold, expiry, oversell-reject, waitlist, checkout) emits a clean event to Splunk through the HTTP Event Collector. From there the DropWatch agent runs a tight loop: it pulls the telemetry back, summarizes it, reasons over it with an LLM, scores the drop's health from 0 to 100, and ranks what it finds by severity. Each finding arrives with a recommendation and a one-click action, and applying that action writes a breadcrumb straight back into Splunk, so even the fix is observable.
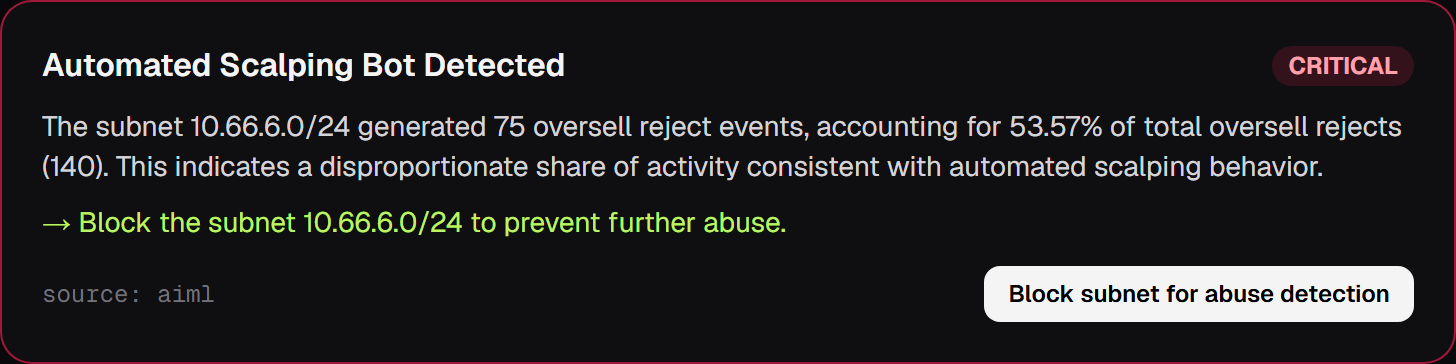
There is one detail we love. Because overselling is impossible by construction, an oversell-reject event only ever fires when the database guard does its job. That makes a burst of rejects from a single /24 subnet a remarkably clean bot signature rather than a data-integrity scare. The agent reads exactly that signal, names the subnet, and offers to flag it.
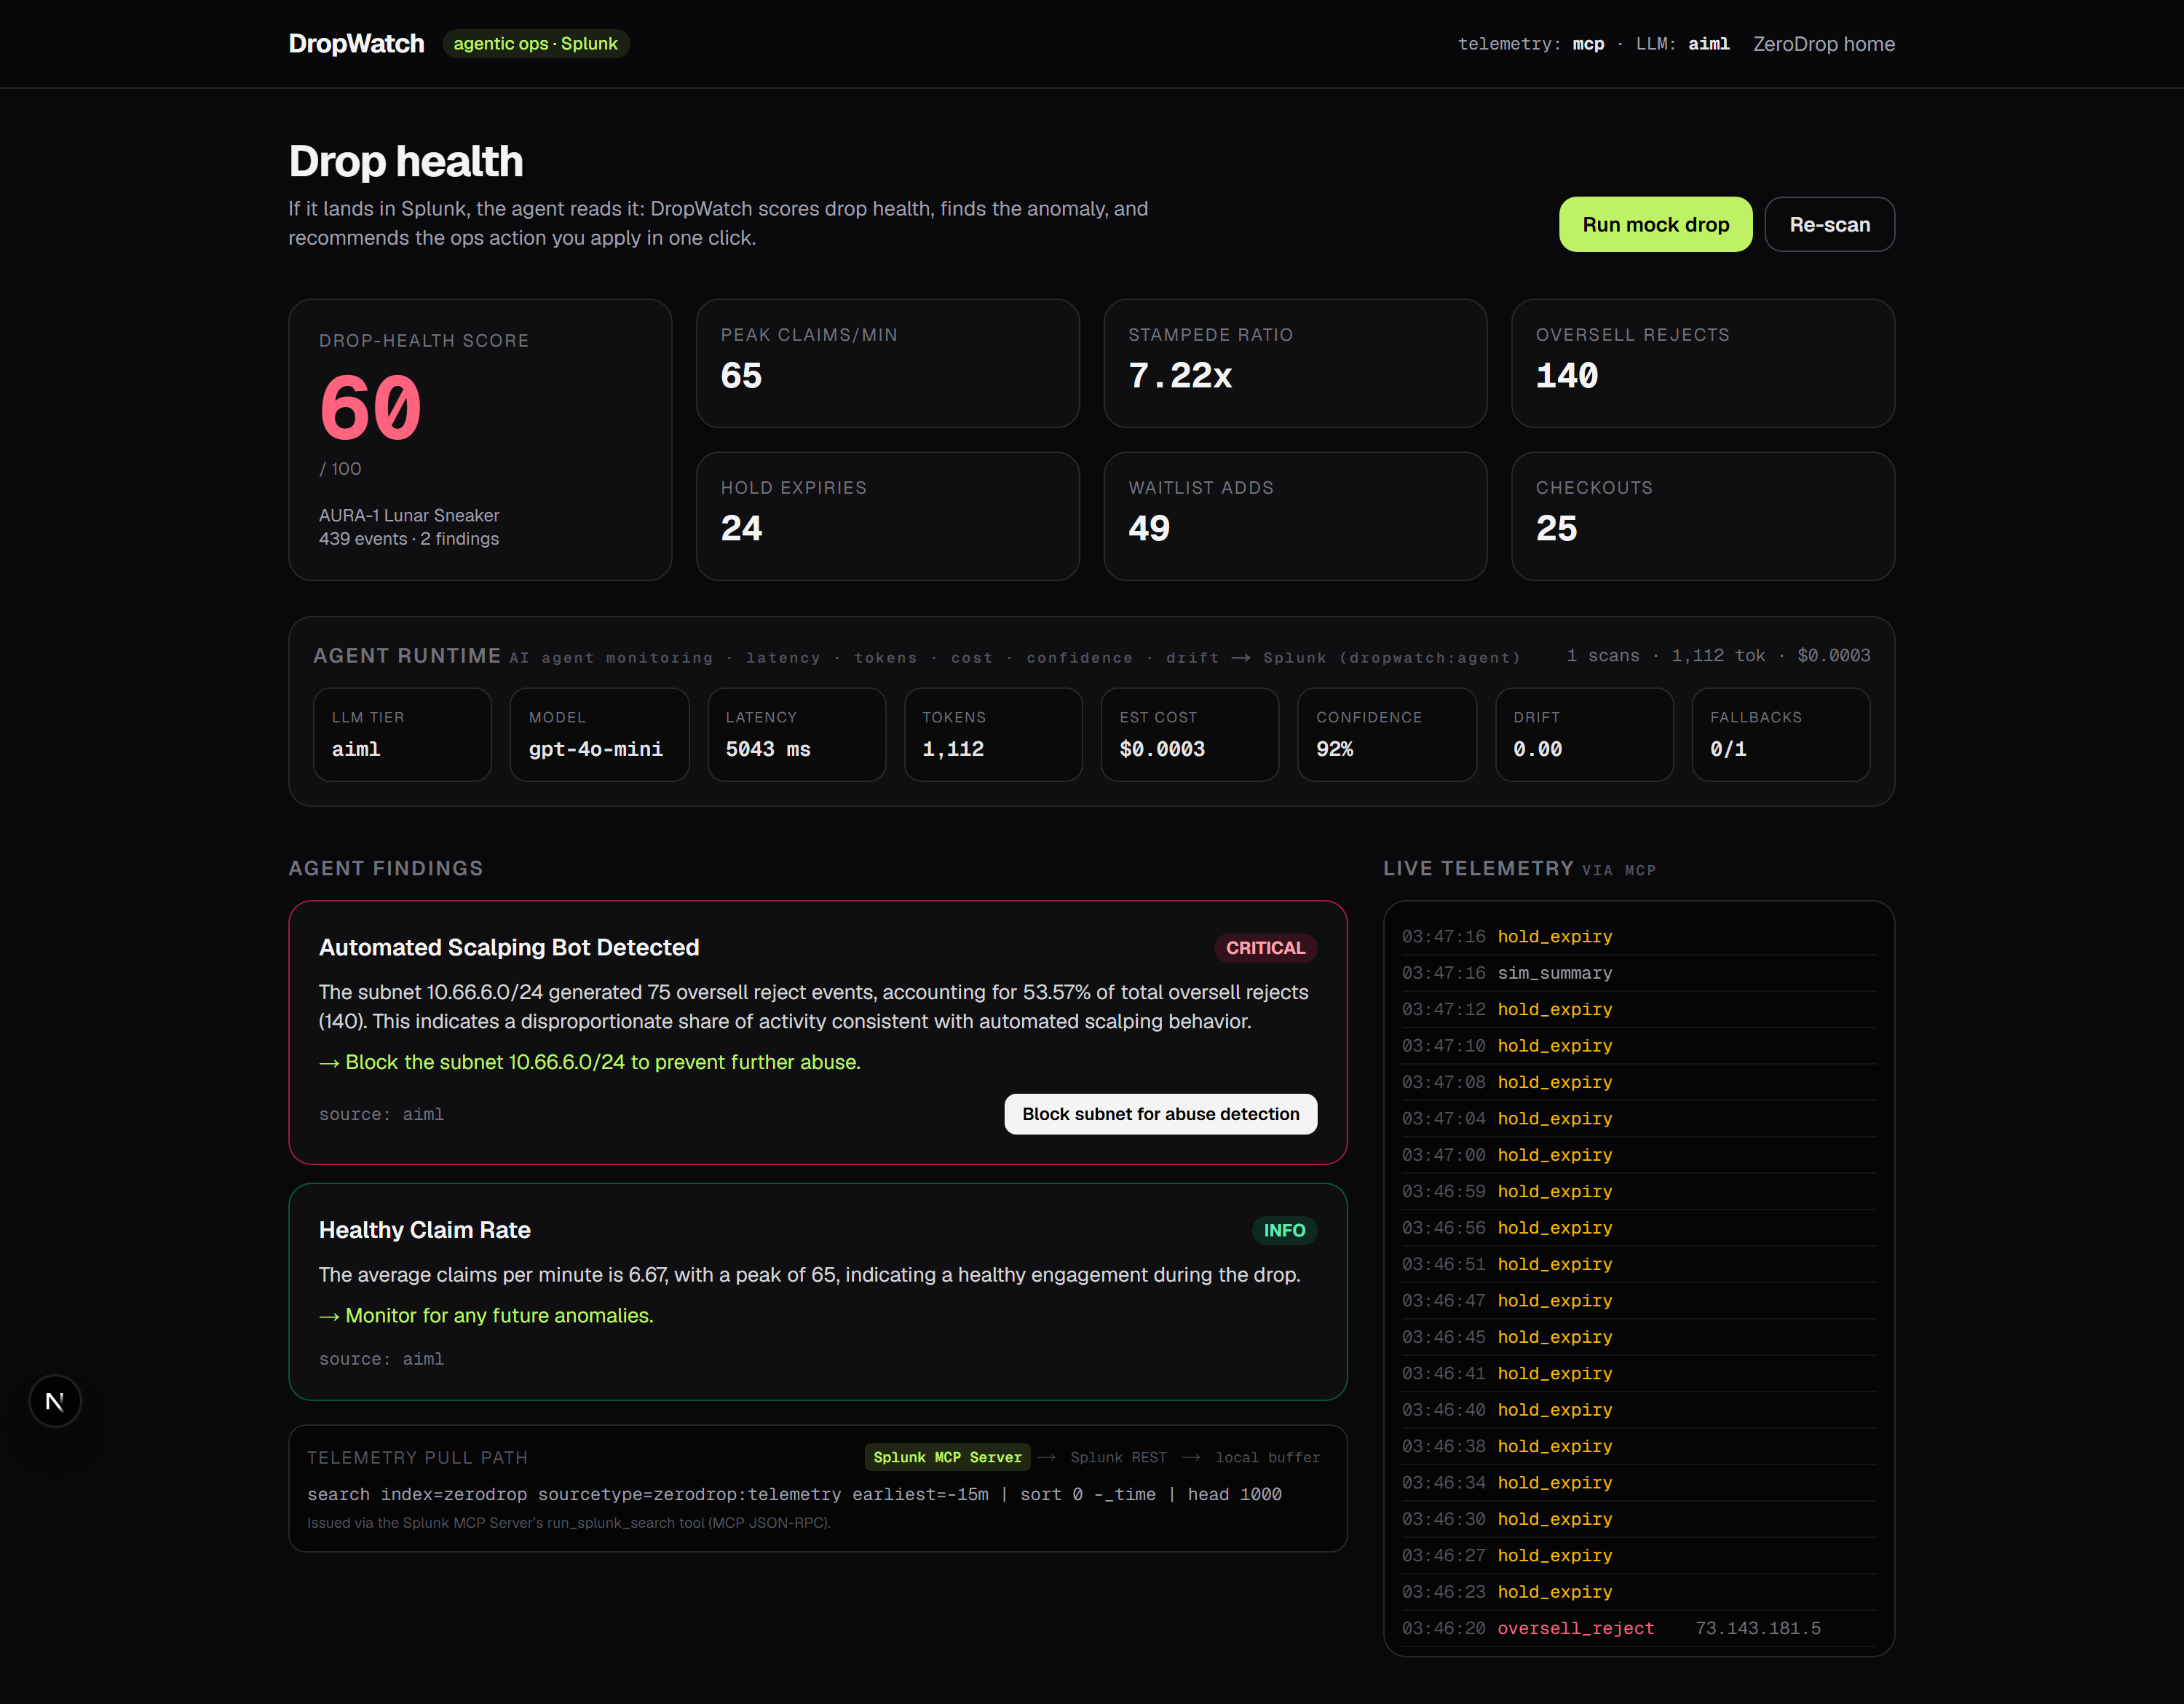
Agentic loop — DropWatch runs a closed agentic loop over Splunk telemetry: pull → summarize → reason (LLM) → score → recommend → apply. The "pull" step is a tool call issued through the Splunk MCP Server's run_splunk_search tool over MCP JSON-RPC; reasoning runs on an LLM with a deterministic rules engine as an always-on fallback; high/critical findings auto-page on-call via webhook; and every applied action writes an audit breadcrumb back into Splunk.
Security angle — Beyond observability, DropWatch is an abuse-detection engine. Overselling is impossible by construction in ZeroDrop (each claim is one atomic DynamoDB conditional write), so an oversell-reject event cannot be a bug — it only fires when a client keeps hammering after sellout. Legitimate buyers stop; bots don't. That makes the reject stream a ground-truth security signal with no false positives by design. The agent clusters rejects by subnet, flags automated checkout-bot /24s, and closes the SOC loop: detect → soft-block/CAPTCHA → page on-call → document in Splunk.
Also a strong fit for Best of Security — see the security-signal section.
🛠️ How we built it
We started from ZeroDrop, a Next.js app on DynamoDB whose entire personality is one atomic conditional UpdateItem per claim. Then we wrapped it in observability.
The telemetry layer is deliberately small. lib/splunk.ts is a HEC client built on Node's own fetch, with no Splunk SDK and no heavy dependencies; it posts structured JSON to the collector and quietly no-ops when no HEC is configured, so local runs behave exactly like production. lib/dropwatch/events.ts defines the event taxonomy and masks buyer identity before anything leaves the app, and lib/dropwatch/sink.ts is the single choke point every hot path calls, fanning each event out to both Splunk and a bounded in-memory ring buffer.
The agent lives in lib/dropwatch. search.ts pulls telemetry back through a three-tier path: the Splunk MCP Server first, then the REST search API, then the local buffer when neither is reachable. analyze.ts extracts features and runs a deterministic rules engine (stampede ratio, oversell-reject rate, /24 cluster detection, hold-expiry storms, waitlist collapse) and scores health. llm.ts layers reasoning on top with the same fall-through discipline: Splunk Hosted Models first, then an OpenAI-compatible API, then the rules engine, so the agent always has something intelligent to say. agent.ts orchestrates one scan cycle, and actions.ts applies the chosen remediation and records it back into telemetry.
The /ops route and OpsDashboard component put a face on all of it: a live feed, a health score, severity-ranked finding cards with Apply buttons, and the exact SPL the agent ran. dashboards/dropwatch.xml ships an importable Splunk dashboard for the classic view.
🧗 Challenges we ran into
Our most honest challenge was the trial environment. A Splunk Cloud trial happily accepts HEC ingestion but does not expose the search port, so the agent cannot read its own telemetry back through REST or the MCP Server on that stack. We could have faked it. Instead we leaned all the way into graceful degradation: the read path falls back from MCP to REST to the in-memory buffer, and the reasoning path falls back from Hosted Models to a hosted API to a deterministic engine. The payoff is an agent that never goes dark, online or offline, keyed or keyless, plus a deterministic floor we can actually assert against in CI. Designing the rules engine to mirror the LLM's output shape quietly turned a limitation into a testable contract.
🏆 Accomplishments that we're proud of
- Live HEC ingestion verified against a real Splunk Cloud stack, with the drop's hot paths landing in the zerodrop index.
- A live agent that reasons with a real LLM and returns a drop-health score of 75 with a high-severity oversell-bot finding.
- An agent that always produces output, thanks to three read tiers and three reasoning tiers.
- A green end-to-end test (10 of 10) proving the agent catches both planted incidents and leaves a healthy drop alone.
- Telemetry that never touches the hot path's latency or the oversell guarantee, which stays at exactly zero.
📚 What we learned
- Provable correctness creates clean signals. Because overselling cannot happen, the reject stream is purely behavioral, which is exactly what makes it such good bot-detection fuel.
- Treating Splunk as a tool surface, querying it through the MCP search tool rather than hard-wiring REST, is the idiomatic agentic move, and it makes the same agent portable to any MCP-aware host.
- Graceful degradation is a feature, not an apology. The tiers we built to survive a trial also made the whole thing easier to demo and more honest to talk about.
- A deterministic floor under an LLM keeps an agent testable while still letting live reasoning shine in the demo.
🚀 What's next for DropWatch
- Stand up a Splunk MCP Server against a non-trial stack, so the live demo header reads telemetry: mcp from end to end.
- Promote Splunk Hosted Models to the primary reasoning tier for a fully Splunk-native AI loop.
- Teach the agent new detectors (price-scalper resale patterns, geo-anomalies, hold-griefing) and let it propose SPL it was never pre-programmed with.
- Push applied actions through a real enforcement path, such as an edge throttle or an IP blocklist, instead of a recorded breadcrumb.
- Develop and publish apps on e-commerce store builders like Shopify, WooCommerce, etc.
Built With
- agentic-ai
- amazon-web-services
- anomaly-detection
- cloudflare-workers
- dynamodb
- foundation-sec
- llm
- mcp
- next.js
- node.js
- observability
- openai-compatible-api
- pagerduty
- react
- slack
- splunk
- splunk-app
- splunk-hec
- splunk-hosted-models
- splunk-mcp-server
- typescript
- webhooks


Log in or sign up for Devpost to join the conversation.