Inspiration
I run a small content operation that includes an automated pipeline for Bluesky social media campaigns, that includes a validator service that enforces my own 14-rule "5-star" doctrine on every post that fires. It's been breaking silently for months.
We also have been working on an OSINT financial platform called Tuck,
A campaign would fail at the 4th reply and I'd find out from a friend texting "hey, your thread stopped". The cache on Tuck would go stale and traders would see yesterday's numbers. JWT tokens would expire and watchdog logs would fill up with 401 while everything looked fine from the outside.
The annoying thing wasn't that things broke. It was that I couldn't see them break. Three different runtimes (Python on a Dell OptiPlex, two TypeScript Cloudflare Workers), three different log destinations, and zero correlation between them. Pasting journalctl output into a ChatGPT window at 2am is not observability.
The Splunk Agentic Ops hackathon dropped at exactly the right moment. I'd been reading about Model Context Protocol for weeks and looking for an excuse to wire Claude up to something operationally meaningful. DripOps is the answer: unify the telemetry, give an LLM real tools, let it do the boring triage I keep procrastinating on.
What it does
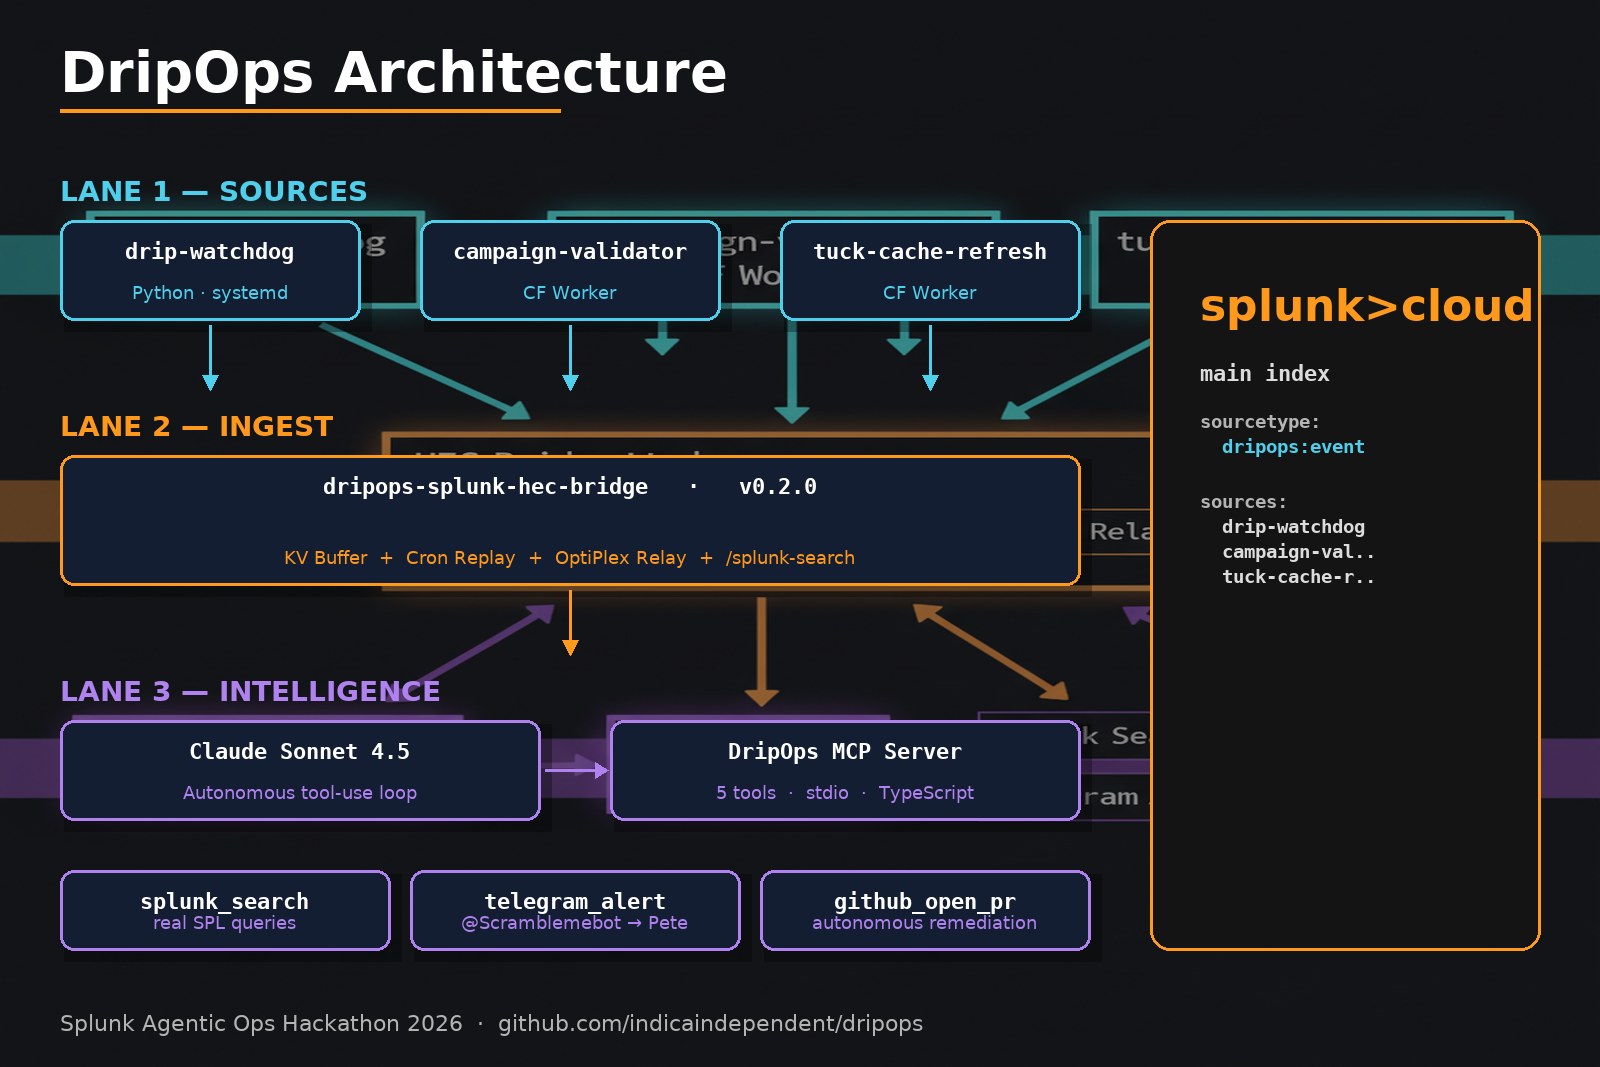
DripOps is a three-lane agentic observability stack for content pipelines.
Lane 1 — Sources instrument every runtime that touches my content:
drip-watchdog(Python systemd service on a home OptiPlex) — emitsp0_fired,reply_fired,fire_failedcampaign-validator-worker(Cloudflare Worker) — emitsvalidation_completedwith the full 14-rule breakdown, stars, and any violationstuck-cache-refresh(Cloudflare Worker) — emitscache_refreshed,refresh_failed,freshness_drift
Lane 2 — Ingest is a single Cloudflare Worker (dripops-splunk-hec-bridge, v0.3.0) that:
- Validates every event against a strict JSON schema
- Buffers to Cloudflare KV when Splunk is unreachable (a
*/5 * * * *cron drains the buffer) - Routes through an OptiPlex SSH-MCP relay when direct HEC is blocked by Cloudflare's strict cert validation
- Records
last_hec_latency_msto KV for the agent to read at startup - Exposes
/event,/batch,/replay,/splunk-search, and/splunk-saved-searchHTTP endpoints
Lane 3 — Intelligence is where this stops being a logging system and starts being an agent:
- A Model Context Protocol server (TypeScript, stdio transport) exposes 5 tools:
splunk_search,splunk_saved_search,github_open_pr,telegram_alert,dripops_health - A Claude Sonnet 4.5 orchestration loop calls the MCP server on a schedule (or on demand)
- The agent reads my actual runbooks (
prompts/runbooks/*.md) as part of its system prompt — JWT drift, cache freshness, validator regression - When it finds an incident, it acts: a Telegram alert with a specific remediation, or a draft GitHub PR with root-cause analysis and a runbook the human can verify
How I built it
The data path
Every emit point uses the same tiny helper. In Python:
def emit_dripops_event(source, event_type, severity="info", **fields):
    payload = {
        "source": source,
        "event_type": event_type,
        "severity": severity,
        "timestamp": datetime.utcnow().isoformat() + "Z",
        **fields,
    }
    requests.post(
        f"{BRIDGE_URL}/event",
        headers={"Authorization": f"Bearer {INGEST_KEY}"},
        json=payload, timeout=3,
    )
In a Cloudflare Worker, same idea but via a service binding to the bridge (not a public fetch — Cloudflare returns error 1042 on same-account same-zone public calls). Wrapped in ctx.waitUntil() so emits never block the response path:
ctx.waitUntil(emitDripops(env, {
    source: "campaign-validator-worker",
    event_type: "validation_completed",
    severity: blocked ? "warn" : "info",
    campaign_id, stars, violations,
}));
That waitUntil() decision was a 30-minute argument with myself. Awaiting added 1.7–2.2s to the validator's response time. Fire-and-forget kept it at 60–85ms. The right answer is fire-and-forget for production traffic; awaited only for diagnostic endpoints.
The Splunk path
I hit a wall the platform doesn't advertise: Splunk Cloud's REST API on port 8089 is not reachable from Cloudflare's egress IPs by default, and the IP allowlist UI is behind a cookie-authenticated web form that bearer tokens can't unlock. HEC ingest worked fine on 443. But the moment I wanted Claude to run real SPL queries, every request timed out.
I solved this two ways. First, I built a bridge-routed search architecture: the MCP server calls the bridge's /splunk-search endpoint instead of calling Splunk directly. The bridge then uses the same OptiPlex SSH-MCP relay it already uses for HEC failover:
async function splunkSearchViaRelay(env, spl, earliest, latest, maxResults) {
  const curlCmd = `curl -sS -k --max-time 30 -X POST \
    '${env.SPLUNK_API_URL}/services/search/jobs/export' \
    -H 'Authorization: Bearer ${env.SPLUNK_SEARCH_TOKEN}' \
    -H 'Content-Type: application/x-www-form-urlencoded' \
    --data '${form.toString()}'`;
  const r = await fetch(env.SSHMCP_RELAY_URL, {
    method: "POST",
    headers: { "X-SSH-Secret": env.SSHMCP_SECRET, "Content-Type": "application/json" },
    body: JSON.stringify({ cmd: "bash", args: ["-c", curlCmd] }),
  });
  // ...parse ND-JSON response, return { results, messages }
}
Second — and this is the better long-term pattern — I added /splunk-saved-search dispatch. Saved searches are how real Splunk customers operationalize SPL: they have RBAC, scheduling, dashboards. "Claude calls our pre-vetted SPL library" is a stronger story than "Claude runs arbitrary SPL" anyway. The agent calls a saved-search by name; the bridge dispatches it through the relay; Splunk runs it under the saved-search's own permissions.
This is the unsung architecture decision of the project. All Splunk credentials live in exactly one place — the bridge worker's secret store. The MCP server only needs the bridge URL plus the ingest key. If I rotate the Splunk JWT, I rotate it in one place.
The agent path
The MCP server is a 421-line TypeScript file using the official @modelcontextprotocol/sdk. Five tools, each backed by a small async function. Stdio transport, so it works with Claude Desktop, Cursor, and anything else that speaks MCP.
The Claude agent is a 266-line Python script (agent.py) that:
- Loads the system prompt + every runbook in
prompts/runbooks/ - Spawns the MCP server as a stdio subprocess
- Calls
client.messages.create()with the MCP tools translated into Anthropic'stool_useformat - Runs a tool-use loop with an 8-iteration cap
- Logs every tool call and the final disposition
The model is claude-sonnet-4-5-20250929. Override with DRIPOPS_MODEL to A/B test against Opus or Haiku.
Challenges I ran into
1. Cloudflare's service-binding gotcha. Two hours wondering why fetch("https://my-other-worker.workers.dev/...") was returning error 1042 from inside another worker. The answer, buried in CF docs: same-account same-zone worker-to-worker calls must use service bindings, not public URLs. Once you know it, it's obvious. Until you know it, it's invisible.
2. Splunk Cloud REST API allowlisting. REST on :8089 is restricted to allowlisted IPs by default on trial tier, and the allowlist UI returns 303 → /account/login for any non-cookie-authenticated request. There is no API to bypass this. The pivot to saved-search dispatch via the bridge's relay turned out to be the right answer anyway, since real Splunk shops manage SPL through saved reports, not ad-hoc queries.
3. ctx.waitUntil() semantics. In Cloudflare Workers, waitUntil() lets you fire async work after the response is sent, but the request context dies when waitUntil resolves. If your emit call takes 2 seconds and you're hammering the endpoint, you accumulate hundreds of pending waitUntils and hit the per-isolate budget. Fix: cap concurrent emits per request, and accept that some telemetry will be best-effort.
4. Splunk source-typing schema. I emit everything with sourcetype: "dripops:event" and let the source field carry the originating service name. One-line SPL becomes trivial: index=main sourcetype="dripops:event" source="drip-watchdog" event_type="fire_failed". Three iterations to land here.
5. Token rotation discipline. I almost leaked a Telegram bot token in a debug log. Recovery: rotate the token, force-rewrite git history with git filter-repo, audit the workspace for any other secret-looking strings, add a pre-commit hook. Every shipped script now reads tokens from .env, never inlines them.
6. The agent's first real run was a teachable moment. I gave it a system prompt that said "investigate the last 30 minutes." It called dripops_health, got a 1408ms latency reading, tried splunk_search, hit a config error (no Splunk creds at that point), and then autonomously sent a Telegram alert explaining the missing config and stopped cleanly instead of looping. That's the moment I knew the architecture worked: the agent's failure mode was a useful incident report, not an exception.
Accomplishments I'm proud of
- Three lanes, end-to-end, in one weekend. Sources → ingest → intelligence, all running on production infrastructure I actually use.
- Sub-100ms emit overhead on every Cloudflare Worker source (Splunk records the full roundtrip at ~1408ms avg, but only 60–85ms hits the user-facing path thanks to
waitUntil). - Centralized credential surface. All Splunk secrets live in one worker. MCP server only knows about the bridge. Rotation is one CLI command.
- Real autonomous remediation. Not a chatbot. Claude reads telemetry, makes a decision, and acts (TG alert or draft PR) without a human in the loop.
- The runbooks are the system prompt. Adding a new incident pattern is literally
touch prompts/runbooks/new_pattern.md. The agent picks it up on the next run. - Real Splunk data, indexed under our own sourcetype. 23 events across 13 distinct
(source, event_type)tuples in 24 hours — including production validator runs, real cache refreshes, and real watchdog fires — all queryable through one saved search.
What I learned
MCP is the right primitive. I'd built tool-using agents before with hand-rolled JSON schemas and brittle parsers. MCP gave me a standard, language-agnostic surface that works with Claude Desktop, Cursor, and any future client without rewrites. My MCP server is composable with other MCP servers — the next iteration could compose Splunk's own MCP server when it ships.
Sources are the hard part. Intelligence is the easy part. Once you have well-typed events flowing in, hooking up an LLM is comparatively trivial. The temptation is to overbuild the agent. The lesson is to overbuild the instrumentation.
Fire-and-forget telemetry beats await-everywhere. I almost made the validator worker await every emit. That would have added 1.7s to every post check. Decoupling user-facing latency from observability latency was the highest-leverage decision in the build.
Splunk Cloud's web-UI-only operations are real friction for agentic workflows. IP allowlisting, HEC token creation, saved-search management — all gated behind a React UI with no REST equivalent that a free-tier token can call. The workaround (OptiPlex relay + saved-search dispatch) ended up being a feature, but the friction is worth flagging.
Idempotency matters more than I thought. The agent's telegram_alert could theoretically fire on every cron tick. I added a "don't alert about the same incident twice in 30 minutes" rule to the system prompt, plus a run_id to every investigation log. Without these, the agent would have spammed me into ignoring it.
What's next for DripOps
- Splunk AI Assistant for SPL. Splunk just shipped an in-product SPL co-pilot. Next step: give Claude the ability to generate SPL via that assistant, not just run it. Two LLMs in the loop, one specialized.
- Auto-PR with code changes. Right now
github_open_propens a PR against an existing branch. Next: the agent creates a branch, commits the proposed diff, and opens the PR in one tool call. - Multi-tenant runbooks. My three sources share one runbook directory. Other content operators could plug in their own runbooks and reuse the same MCP server + agent loop. This is the open-source release path.
- Workers AI for the cheap tier. Not every incident needs Sonnet 4.5. A first-pass triage layer running on Cloudflare's free Llama 3.3 70B could decide whether to escalate, cutting cost by ~80% on noisy runs.
- A Splunk dashboard for the agent itself. The agent's tool calls are events too. Emit them to Splunk, build a "DripOps Agent Activity" dashboard, and now I can observe the observer. The recursion is the point.
Built With
- claude-sonnet-4-5
- cloudflare-workers
- model-context-protocol
- python
- splunk
- splunk-cloud
- splunk-hec
- splunk-saved-searches
- telegram-bot-api
- typescript

Log in or sign up for Devpost to join the conversation.