-
-
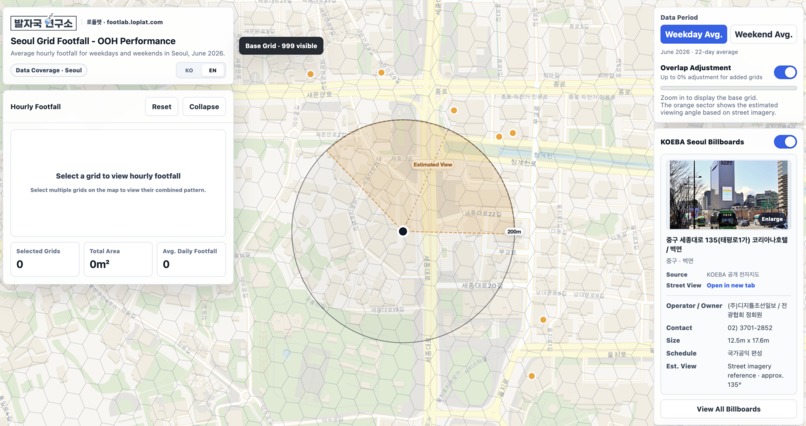
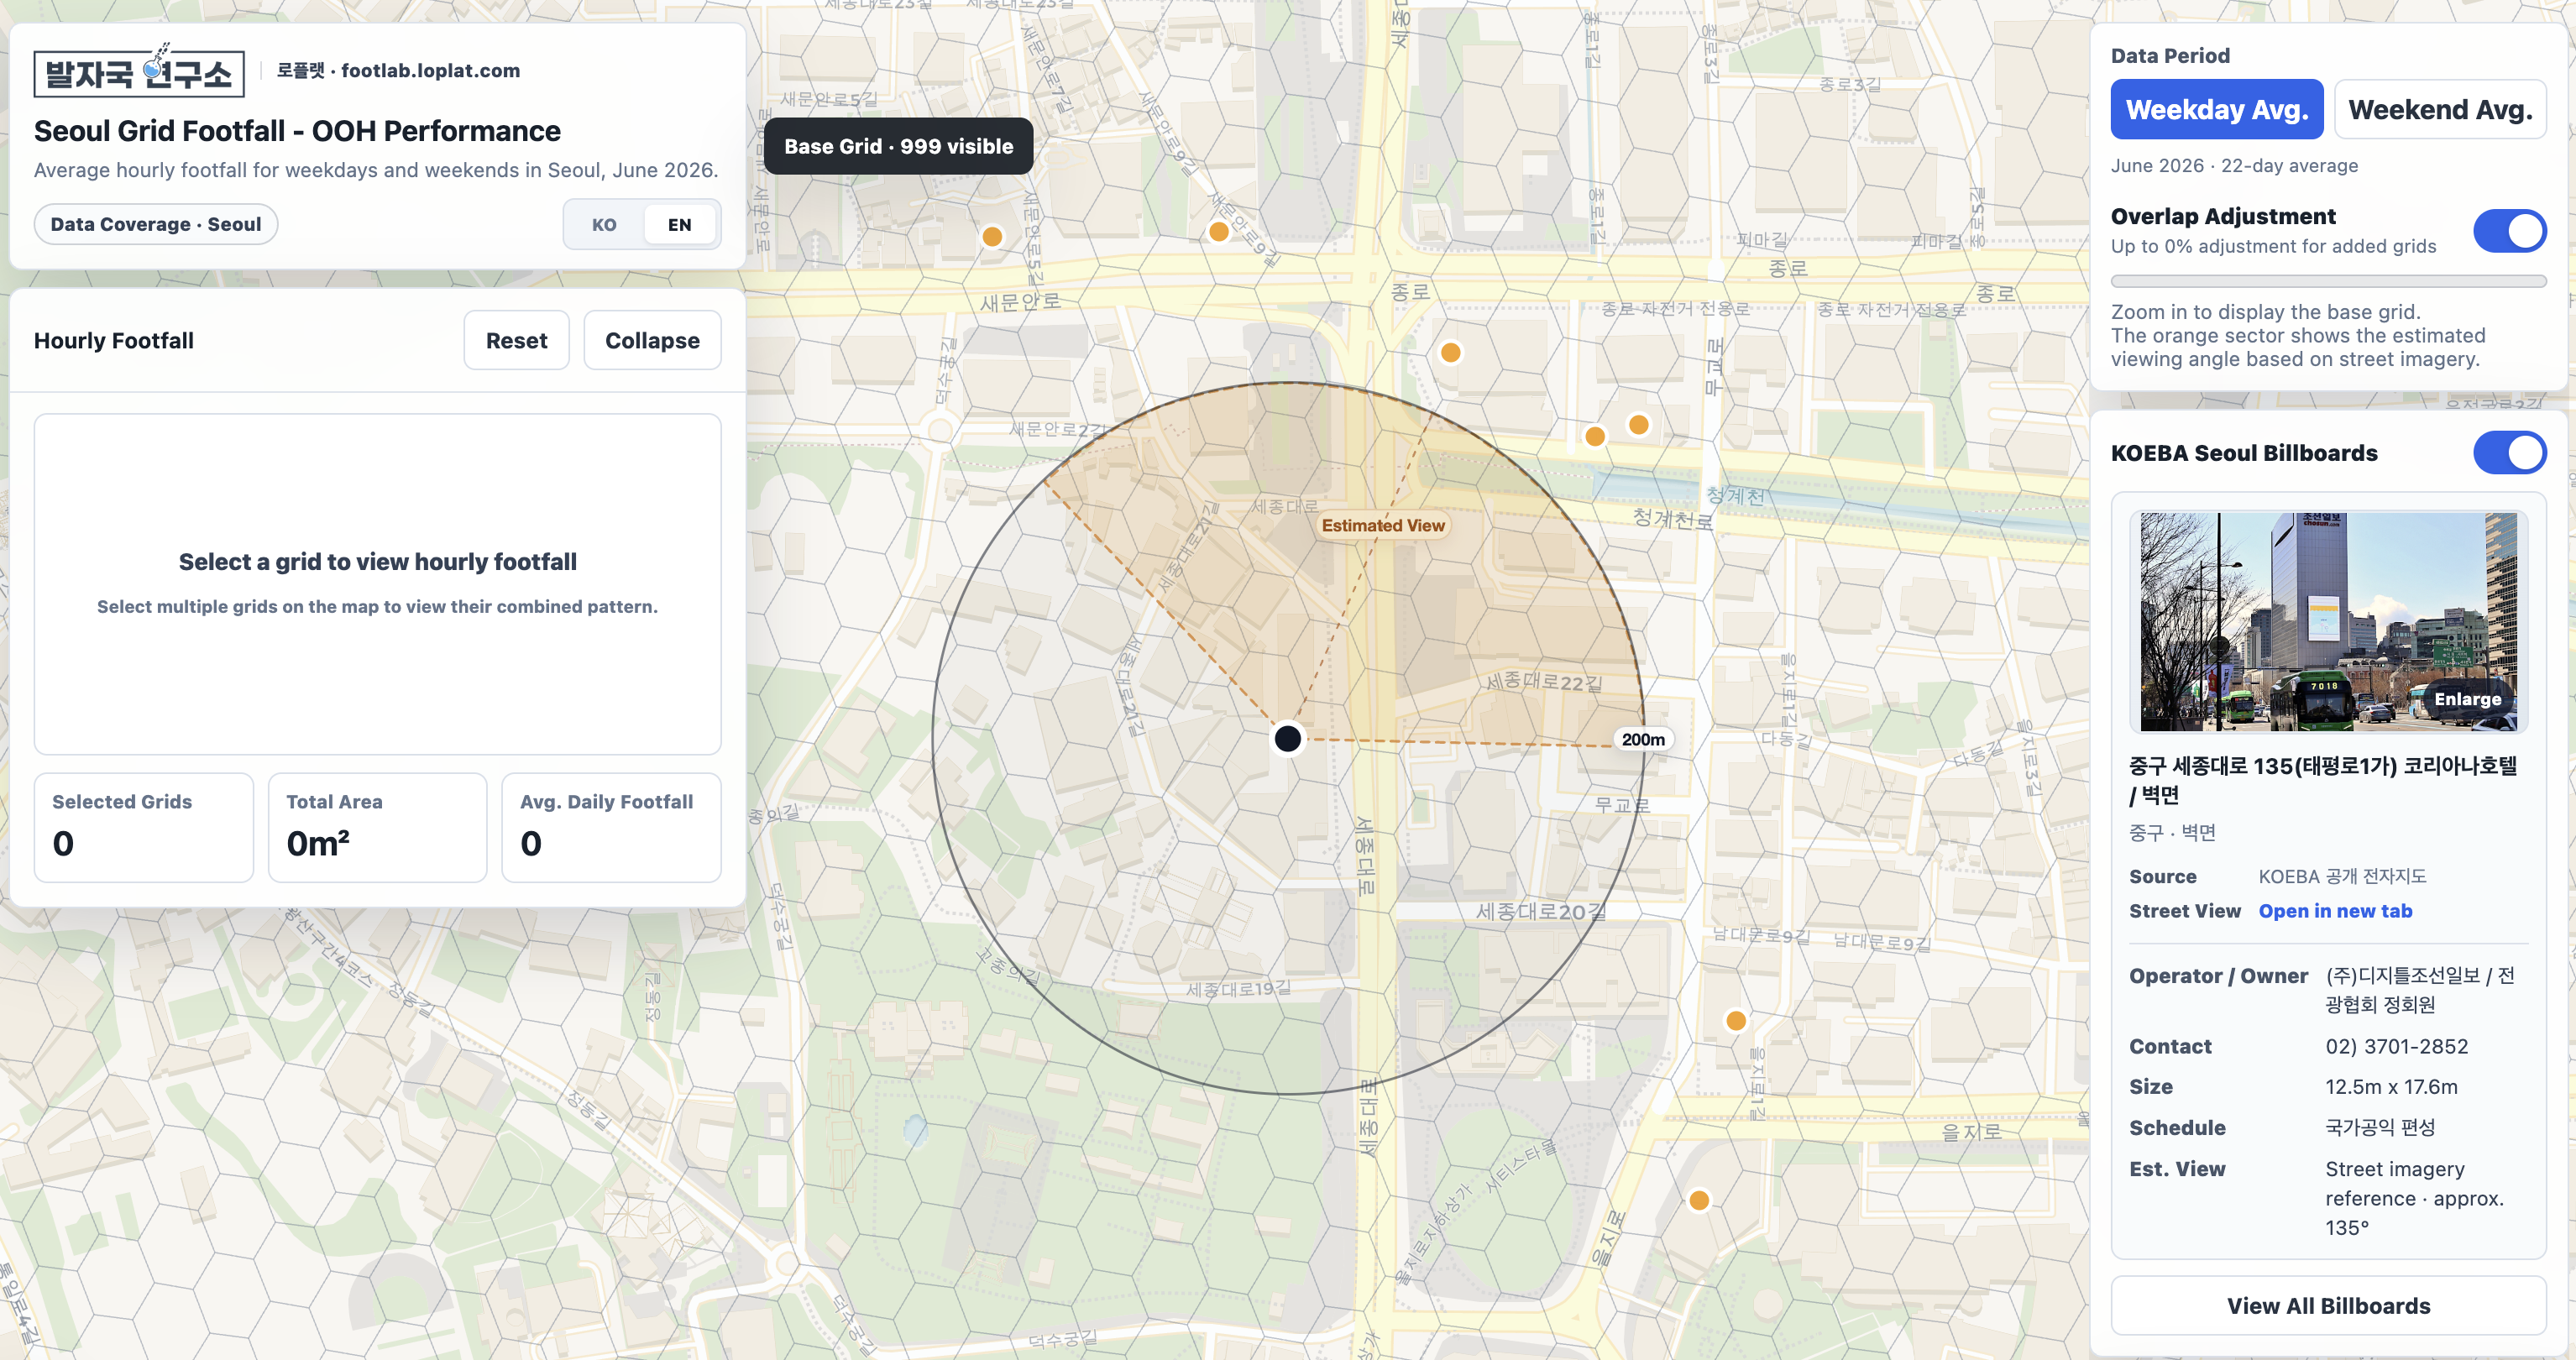
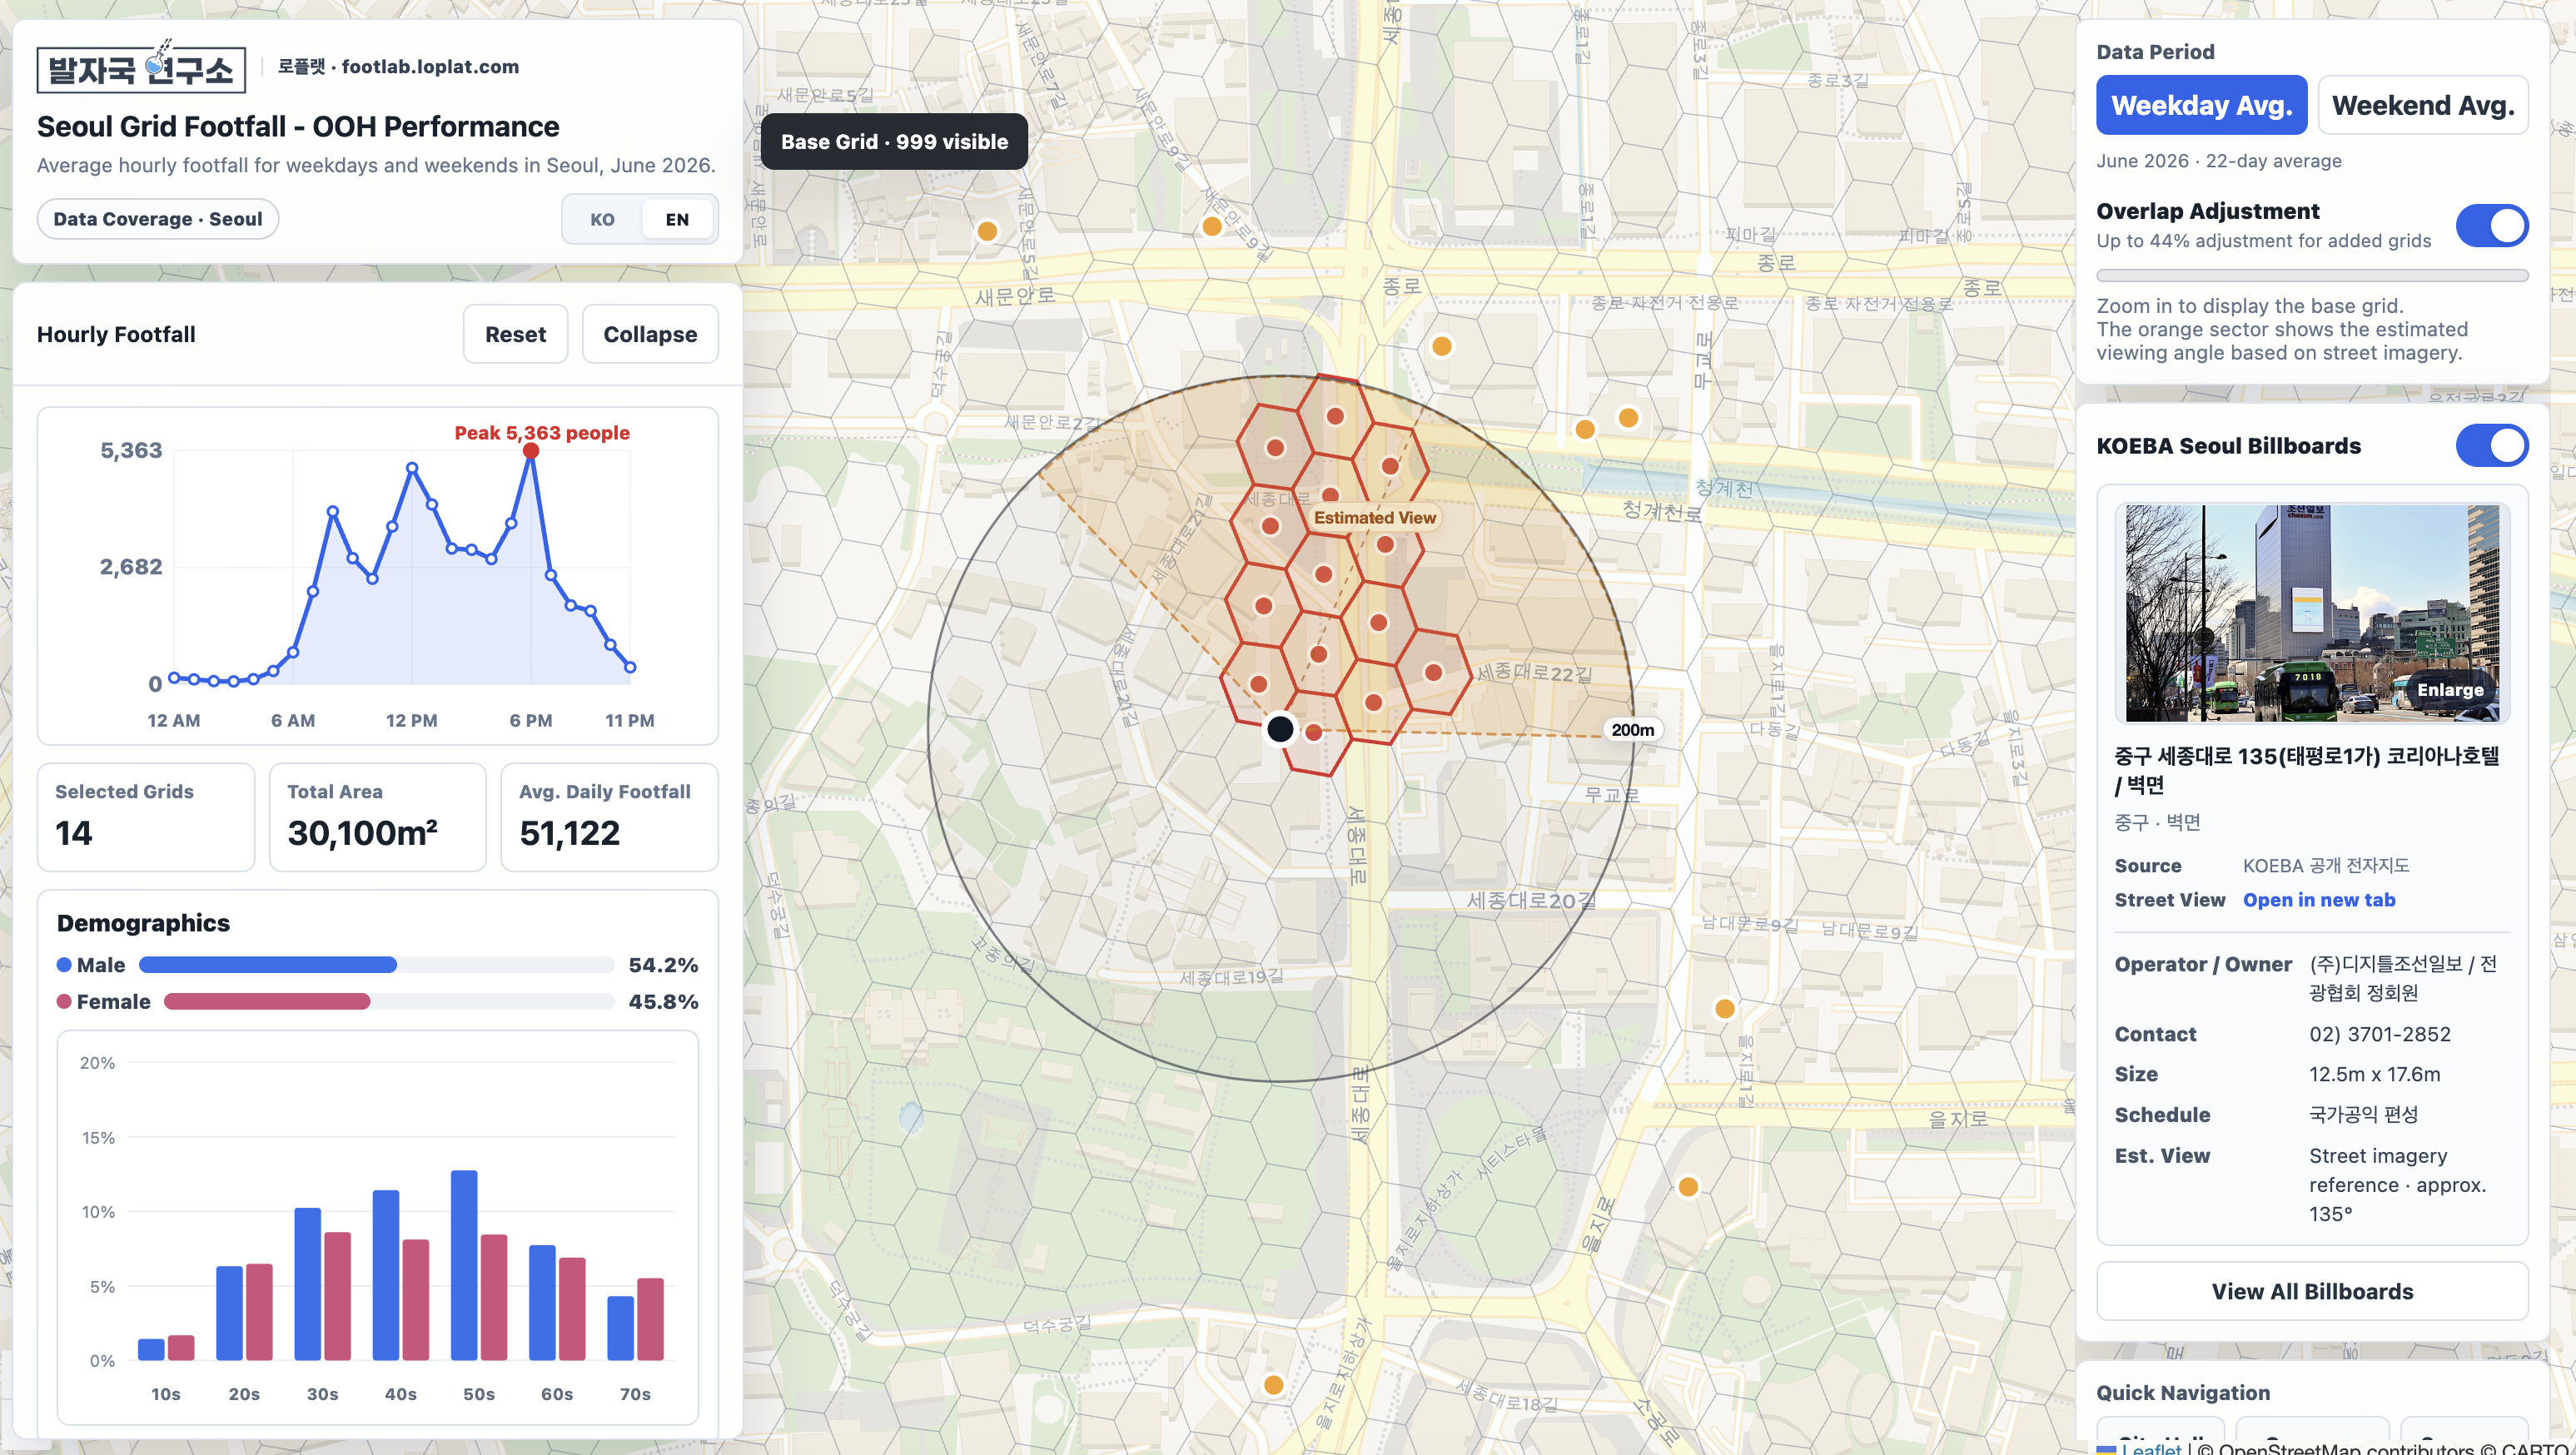
Billboard details, imagery, a 200-meter reference radius, and estimated viewing direction.
-
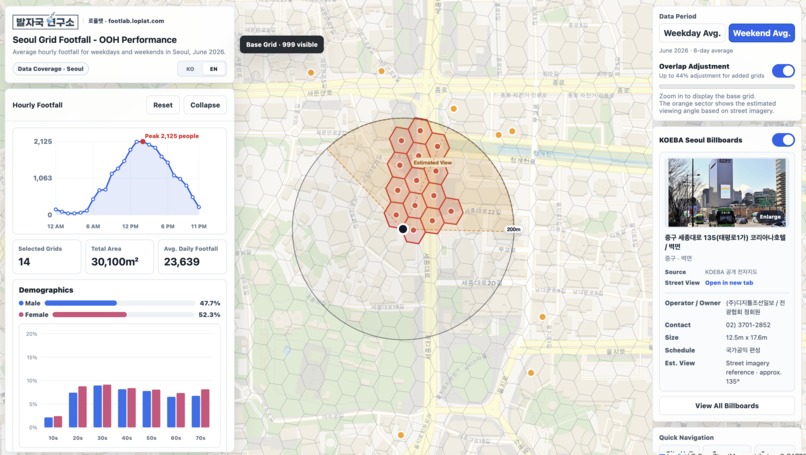
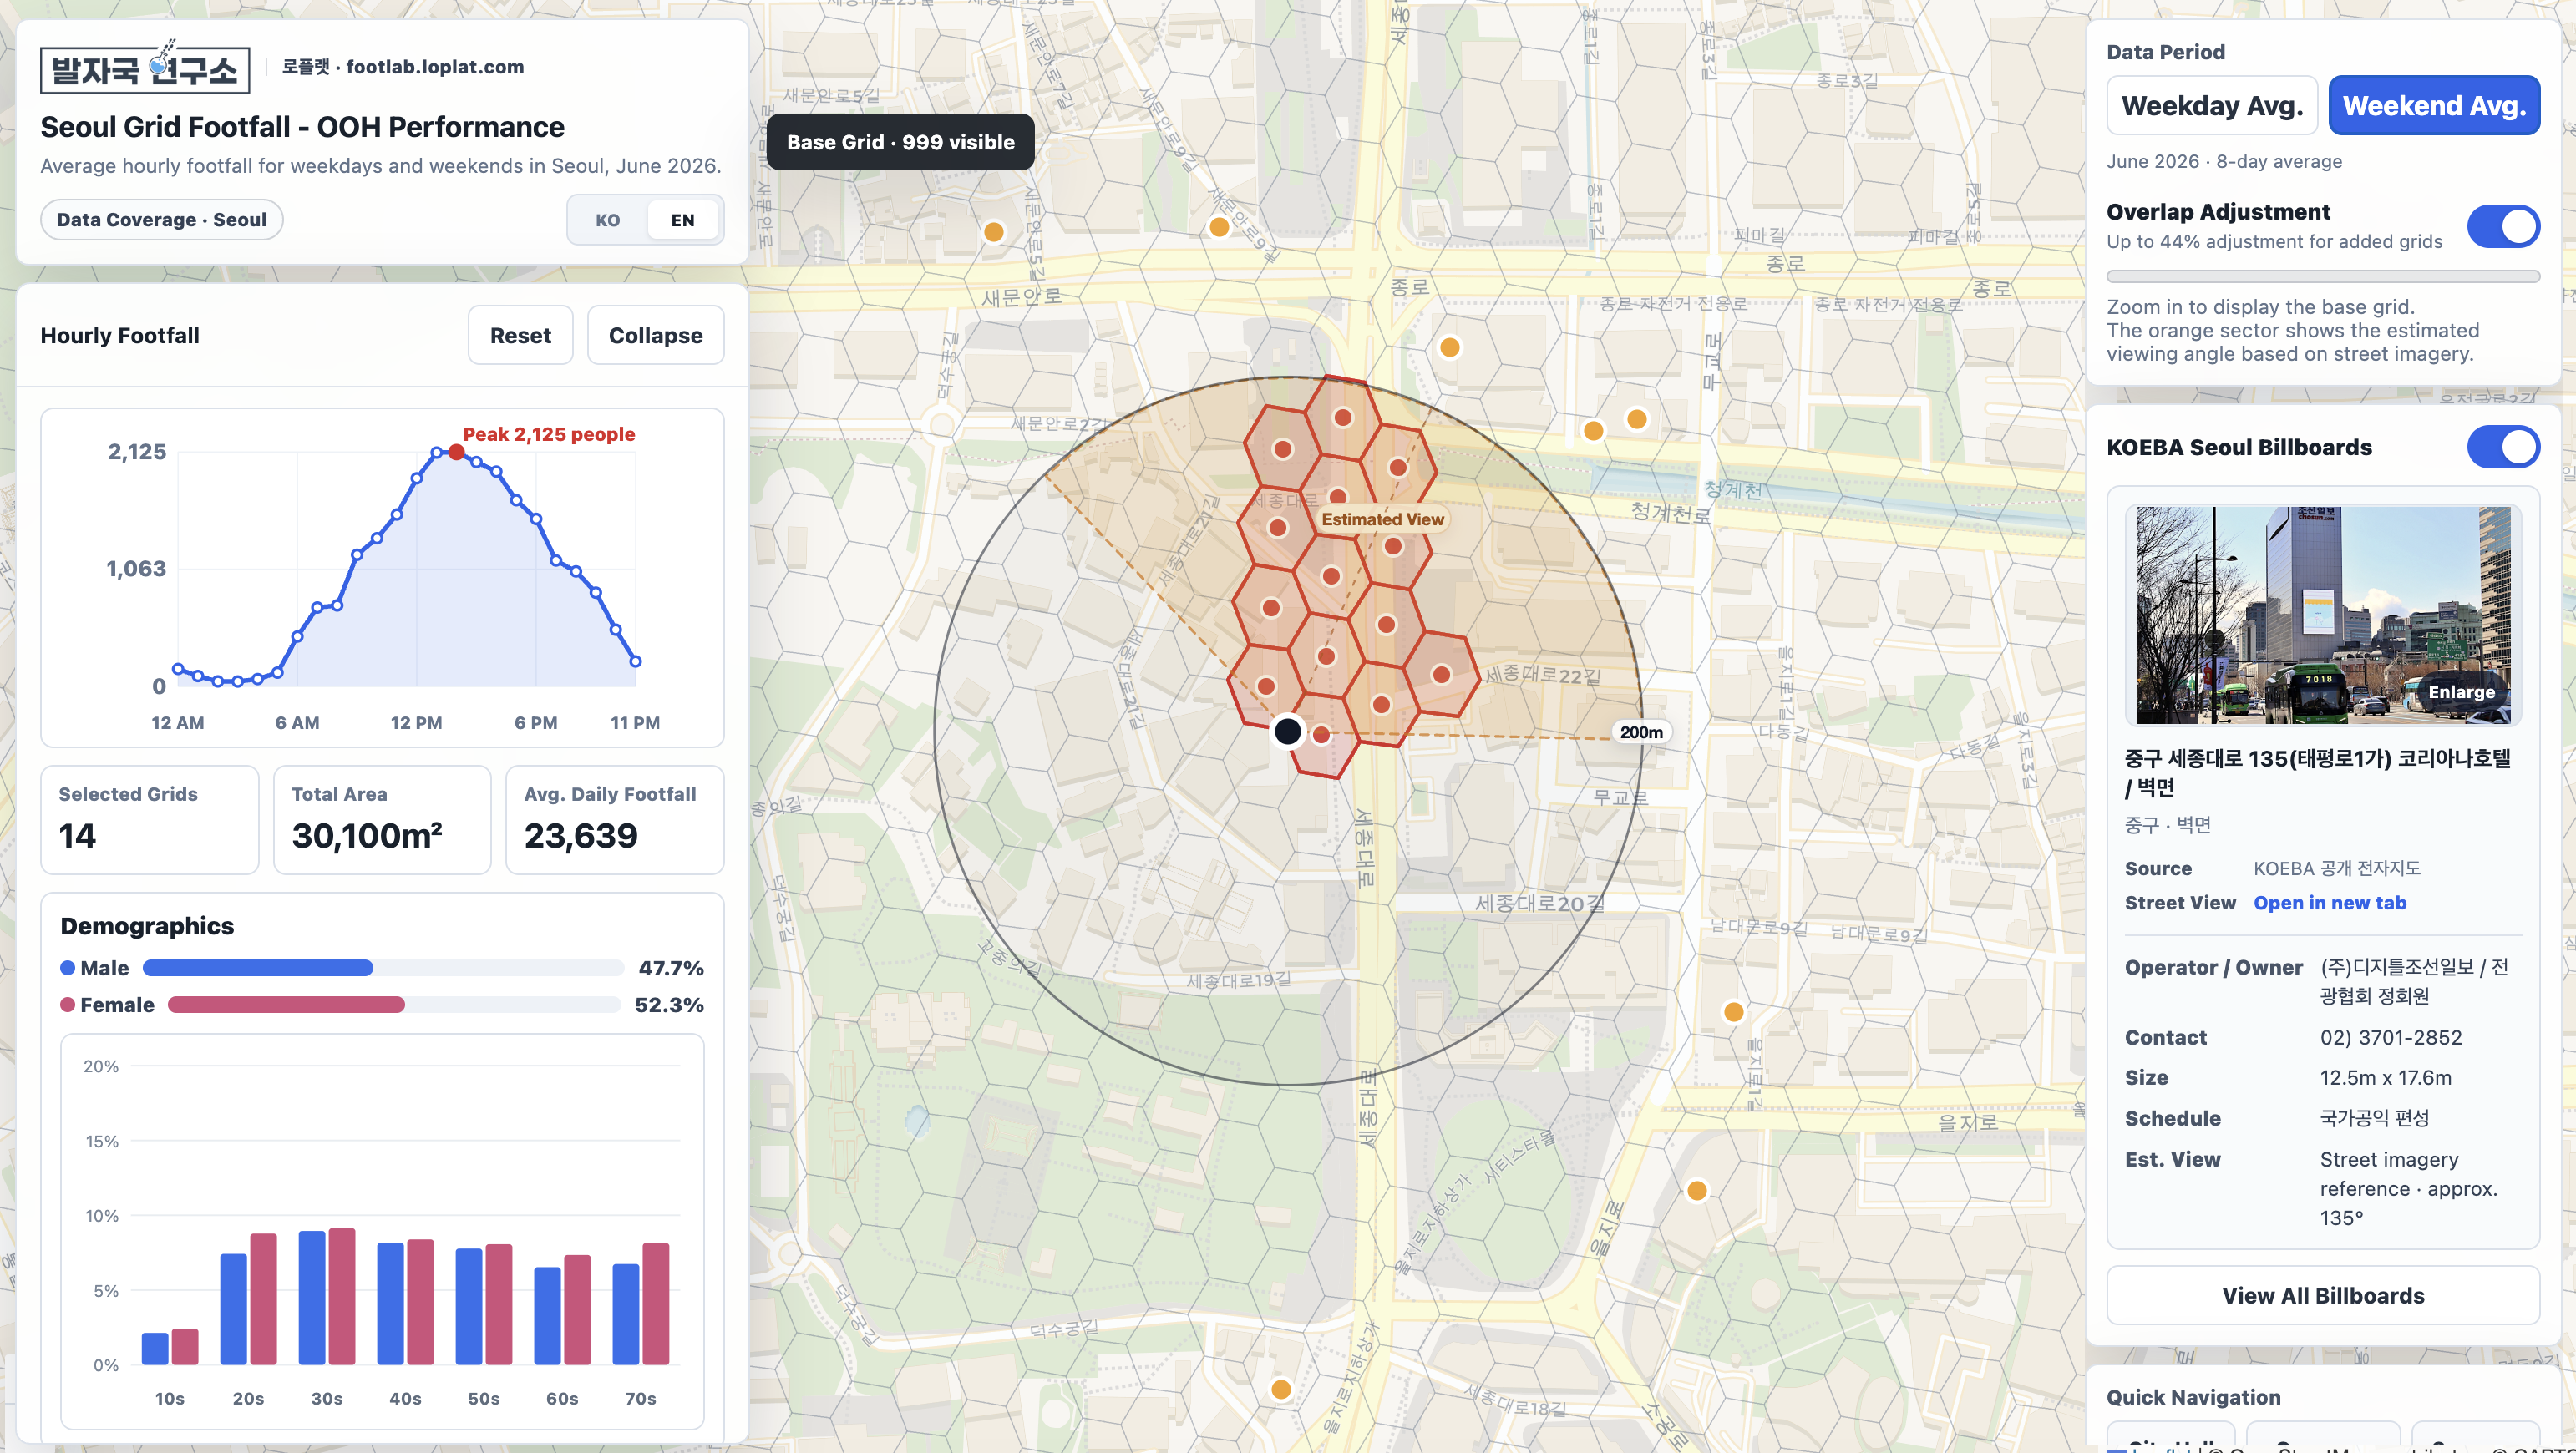
Compare the same selected audience area across weekday and weekend hourly footfall and demographic patterns.
-
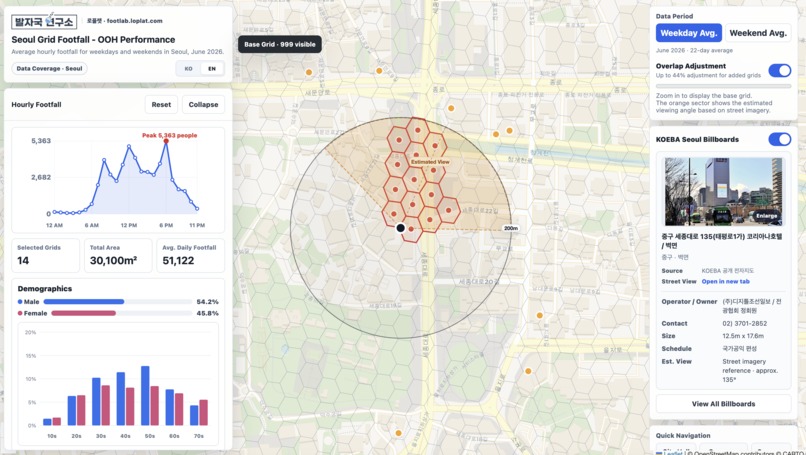
Select multiple map cells to analyze combined hourly footfall and estimated age and gender distributions for the surrounding audience.
-
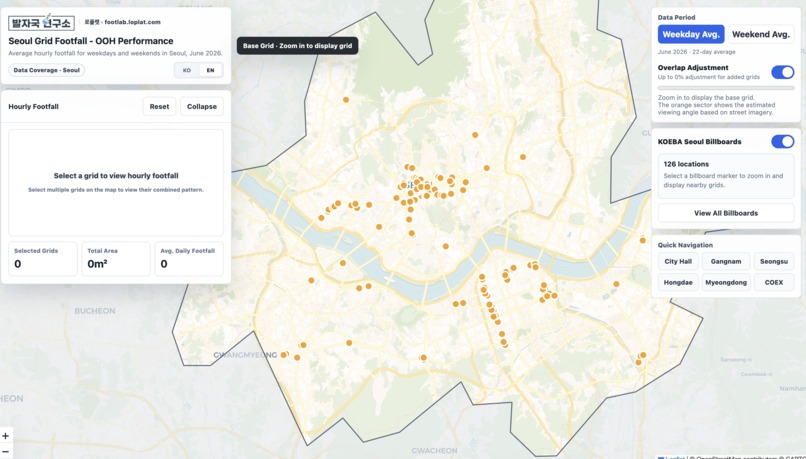
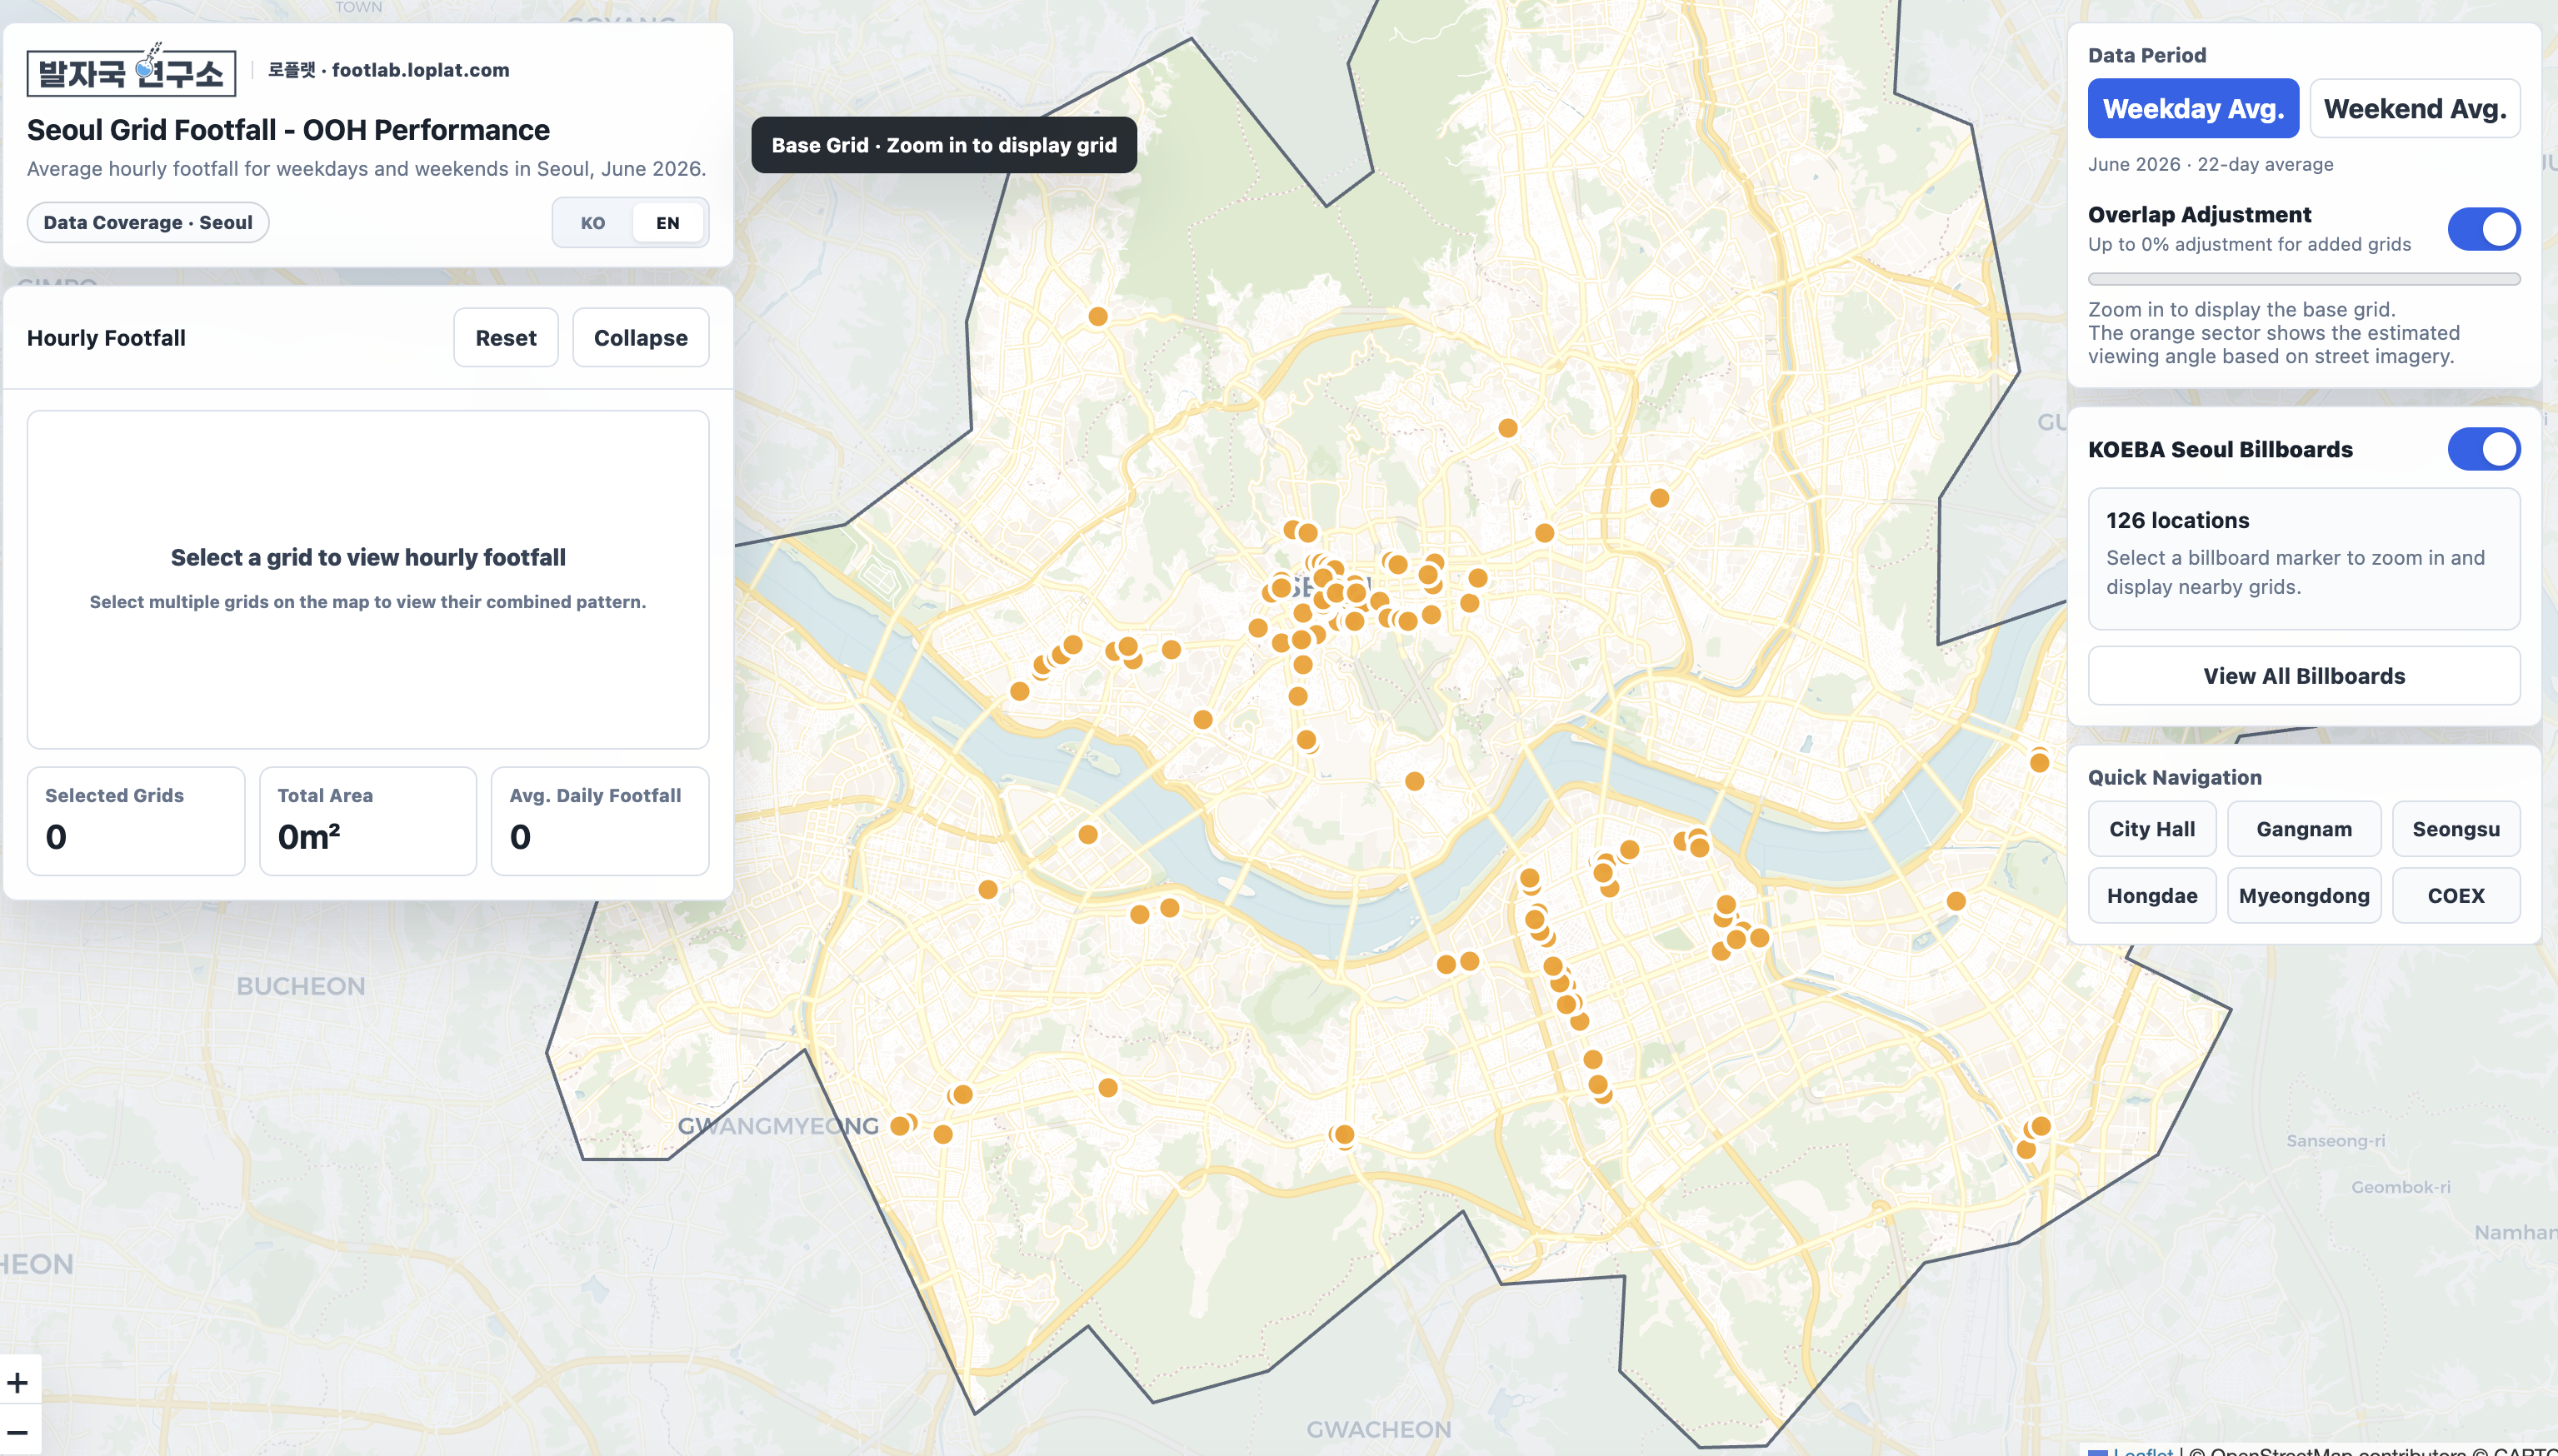
Seoul DOOH Overview - 126 digital billboards mapped across Seoul.
-

Select a billboard to view its real-world image, location details, dimensions, operator, street-view link, and estimated viewing angle.
-
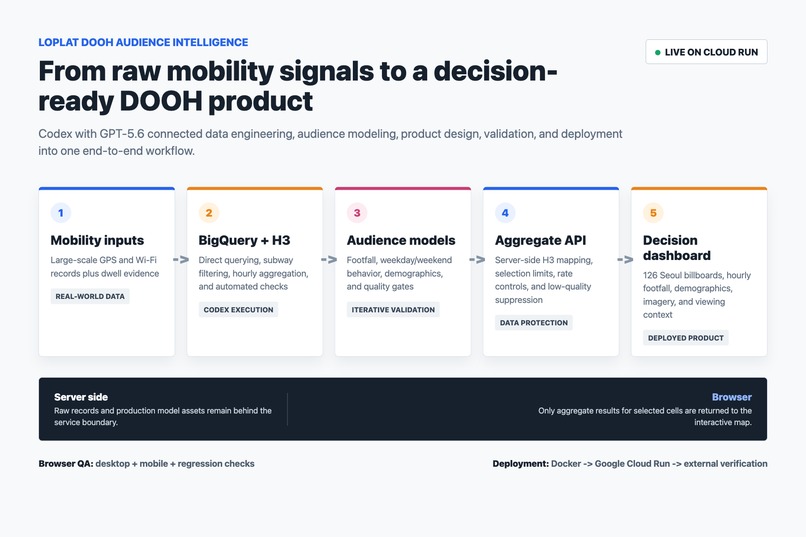
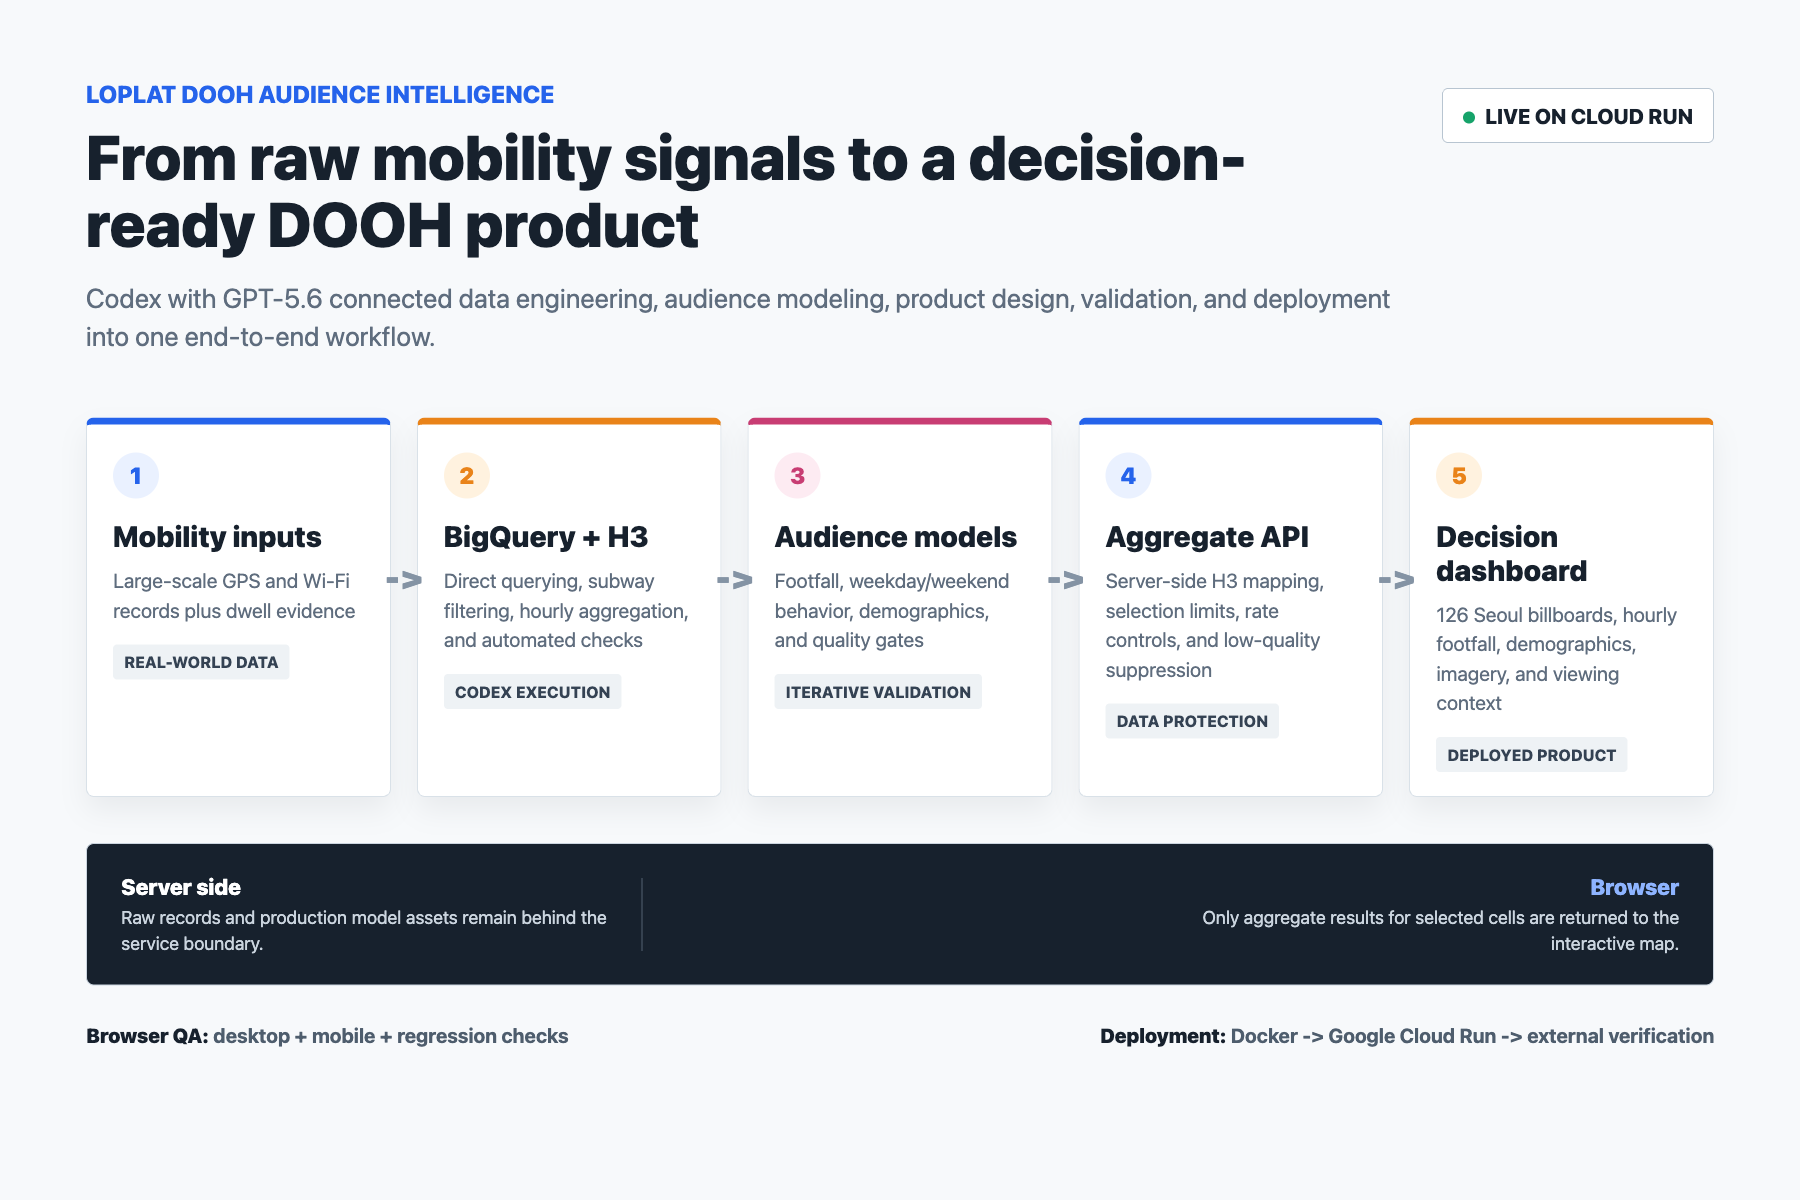
Codex connected mobility data, BigQuery, H3 modeling, protected APIs, browser validation, and Cloud Run into one deployed product.
-
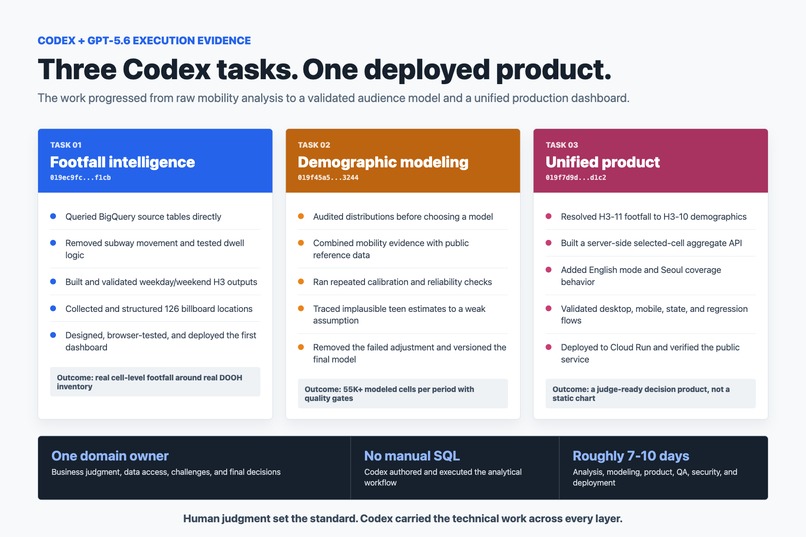
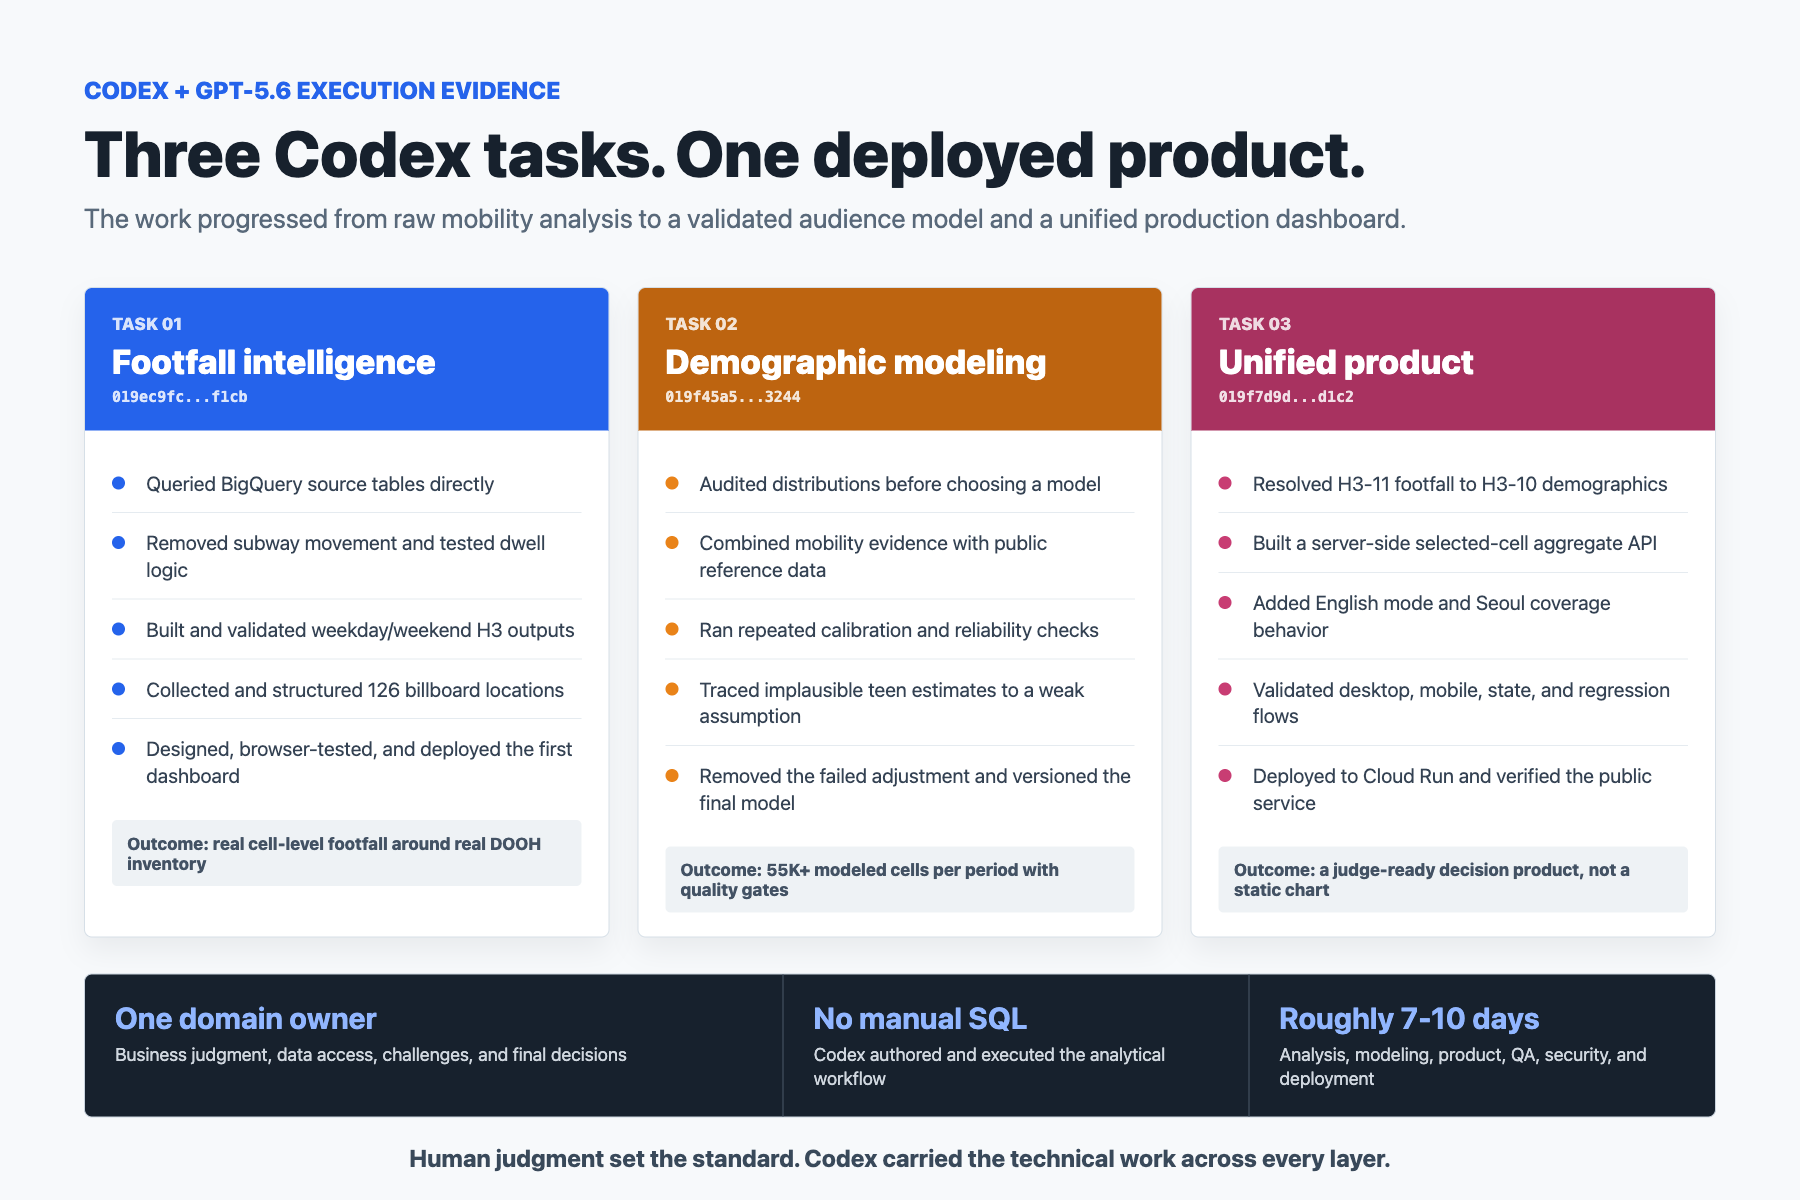
Three Codex tasks turned a business question into validated footfall, demographic modeling, secure integration, and deployment.

About the Project
Inspiration
This project did not begin as a hackathon idea. It began with a real business question: Can Loplat's mobility data help solve the audience measurement gap in digital out-of-home advertising?
Online advertising offers detailed audience signals, while physical media is still often evaluated mainly by location, size, and estimated visibility. Advertisers and media owners need better evidence about who is present around a screen, when footfall peaks, and how audiences change over time.
Loplat already held large-scale GPS- and Wi-Fi-derived mobility records. But raw location records are not footfall or demographics. Transforming them into reliable audience intelligence required data engineering, statistical modeling, validation, product design, security, and deployment. Committing a full specialist team before validating the market opportunity was the practical barrier that Codex helped remove.
What It Does
Loplat DOOH Audience Intelligence is a deployed geospatial product connecting 126 real digital billboards across Seoul with cell-level footfall and demographic insights.
Users can select a billboard, inspect its real-world image and media details, and choose nearby H3 cells to analyze:
- Hourly weekday and weekend footfall
- Estimated age and gender distributions
- Combined audiences across multiple selected cells
- Billboard dimensions, street context, and estimated viewing direction
The live product serves approximately 336,000 weekday footfall cells, 323,000 weekend cells, and 55,000 demographic cells per period. It supports audience analysis and media planning rather than claiming direct campaign attribution.
How We Built It
Early feasibility analysis began in ChatGPT Work. The sustained analysis, product development, validation, and deployment continued across three long-running Codex tasks using GPT-5.6.
I am a software engineer by background, but I now work as Loplat's CEO. I supplied the business question, authorized access to company data, provided domain judgment, challenged questionable results, and approved the methodology. I did not manually write or execute the SQL or application code used for this submission.
Codex inspected our BigQuery structures, authored and optimized queries, generated H3 aggregates, analyzed distributions, incorporated relevant public data, implemented the dashboard, tested it in a real browser, improved the security architecture, and deployed the final service to Cloud Run.
Raw mobility records
→ BigQuery extraction and filtering
→ H3 footfall and demographic modeling
→ Automated and human validation
→ Protected aggregation API
→ Interactive dashboard
→ Browser QA and Cloud Run deployment
Challenges and Validation
Distinguishing presence from movement: Subway passengers initially appeared as footfall near stations even though they were underground. We removed subway-associated records and incorporated dwell-related evidence to reduce pass-through noise.
Estimating demographics responsibly: Some age and gender groups were sparsely represented. We tested multiple weighting, calibration, and public-data approaches across weekday and weekend models. When one adjustment produced implausible teenage estimates at major destinations, I challenged the result. Codex traced the issue, reran the analysis, and removed the method from the final model.
Combining spatial resolutions: Footfall uses detailed H3 resolution 11 cells, while demographics require the more stable H3 resolution 10. The final server-side method maps the two resolutions and calculates footfall-weighted demographics for the area selected by the user.
Protecting company data: An early architecture exposed complete data files to the browser. Codex identified the risk and rebuilt the application around a Node.js API that returns only selected aggregate results. Raw records and production model assets remain server-side.
What Build Week Changed
The business question and initial feasibility work predated Build Week. During the submission period, we completed and validated the demographic model, combined footfall and demographics into one product, added real billboard imagery and viewing context, replaced browser-delivered files with protected APIs, added an English interface, completed desktop and mobile browser QA, and deployed the integrated service.
What We Learned
The most valuable contribution from Codex was not code generation alone. It was the ability to operate across data engineering, statistical reasoning, research, UX, backend, frontend, security, testing, and cloud deployment without losing the original business objective.
AI accelerated each investigation, but human domain judgment determined what was credible enough to ship. Work that would normally require several specialists was completed by one CEO working with Codex in roughly 7–10 days.
Loplat brought the real-world data and domain judgment. Codex turned them into a validated, deployed product that a team of one could use to test a new market opportunity.
Built With
- bigquery
- carto
- css
- docker
- geospatial-analytics
- google-cloud
- google-cloud-run
- gpt-5.6
- h3
- html
- javascript
- leaflet.js
- node.js
- openai-codex
- openstreetmap
- playwright
- rest-api
- sql


Log in or sign up for Devpost to join the conversation.