-
-
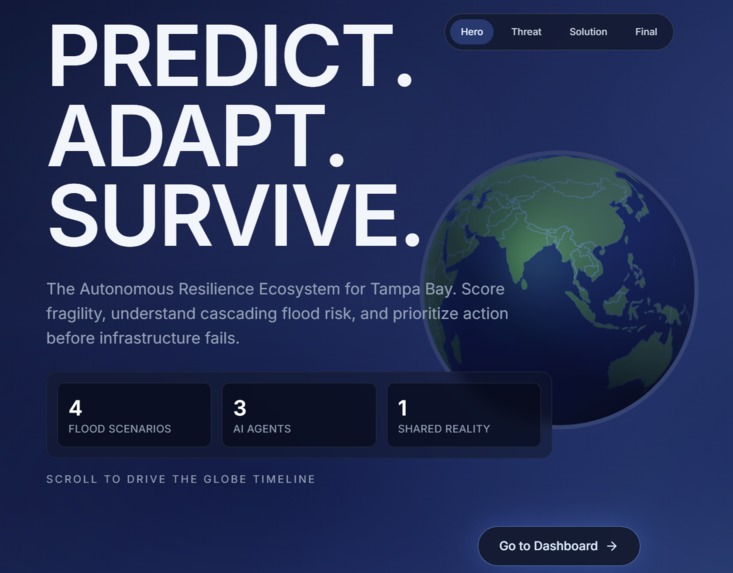
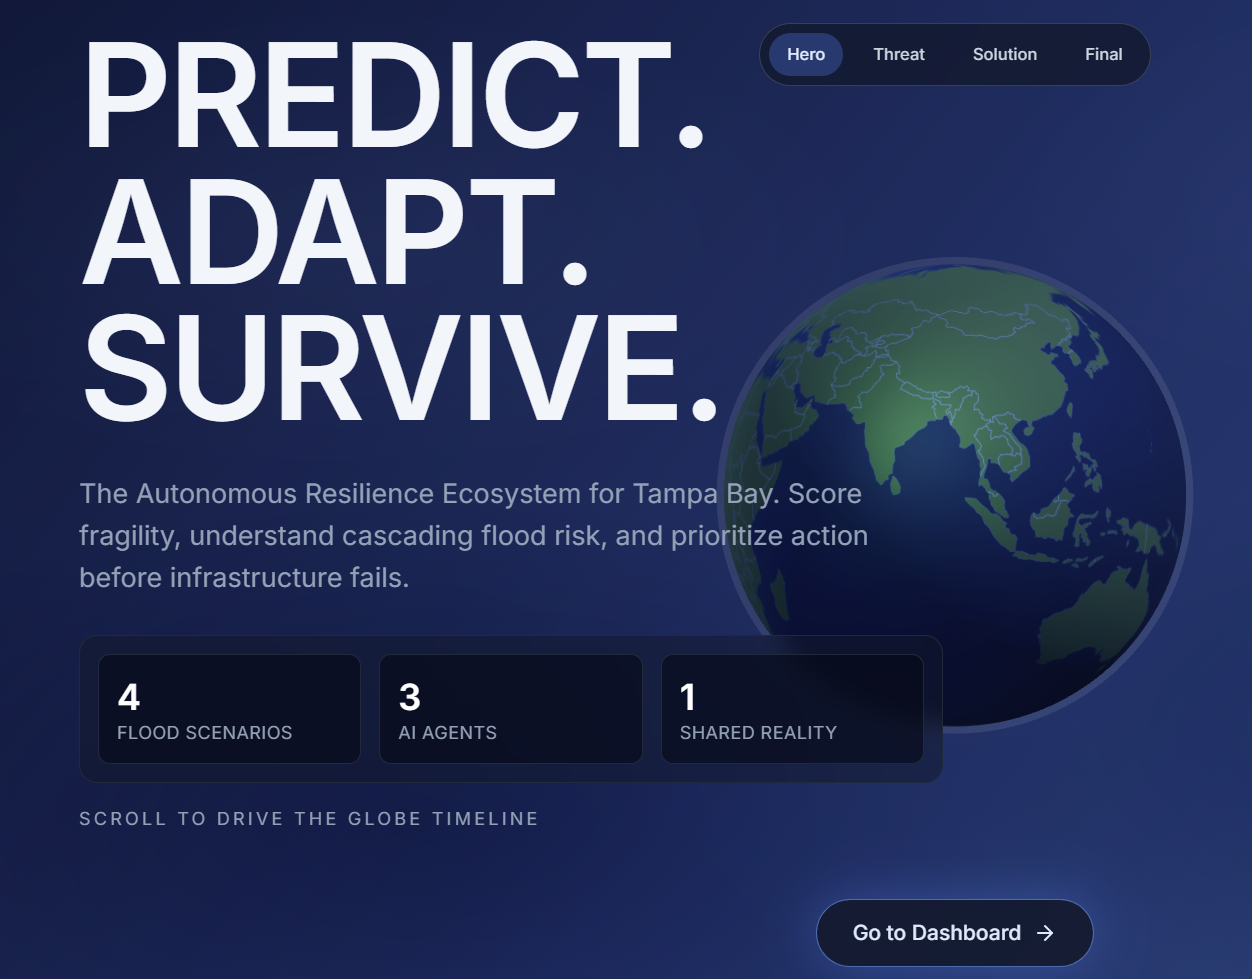
DontCollapse Homepage
-
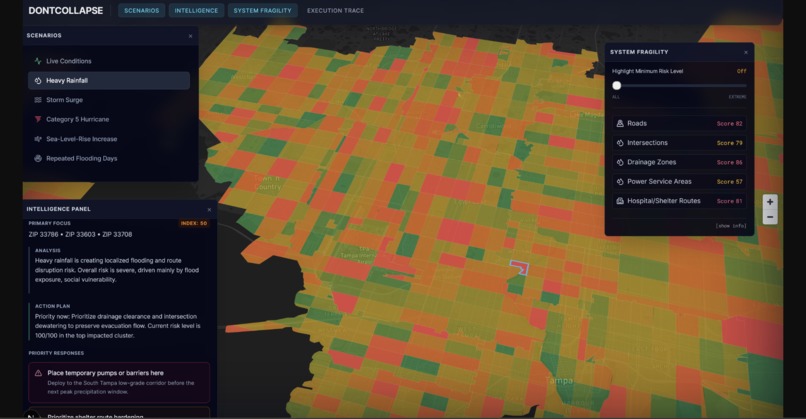
DontCollapse Dashboard

Inspiration
We were inspired by how cities respond to disasters like flooding and storm surge. One key insight is that infrastructure does not fail uniformly; failures occur at the most fragile points and can quickly cascade across systems. However, identifying these high-risk zones is difficult due to fragmented data and lack of clear prioritization. We wanted to build a system that not only identifies vulnerable areas, but also explains why they are at risk and what actions can be taken.
What it does
DontCollapse is a resilience dashboard that identifies which areas are most vulnerable to flooding and infrastructure stress. It combines multiple risk factors (such as flood exposure, elevation, road accessibility, social vulnerability, and power infrastructure) into a single fragility score. The system then classifies each zone into risk categories, explains why it is vulnerable, and provides recommended actions to mitigate risk. We also simulate different disaster scenarios (such as heavy rainfall and storm surge), allowing users to see how risk actually changes under different conditions.
How we built it
We built a data pipeline using Python and Pandas to aggregate and process infrastructure data from multiple sources, including APIs like Open-Meteo, OpenStreetMap (via Overpass), and the U.S. Census TIGERweb API. Since each dataset came in different formats, we cleaned and standardized everything into a unified structure. From there, we engineered features such as flood exposure, elevation risk, and accessibility, and combined them into a weighted fragility score for each zone:
$$ \text{Fragility Score} = \sum_{i=1}^{n} w_i \cdot x_i $$
where $$x_i$$ represents each risk factor and $$w_i$$ represents its importance. On the backend, we used FastAPI and REST endpoints to manage data flow, generate scenario-specific datasets, and serve structured outputs including risk categories, explanations, and recommended actions. This allows the system to recalculate fragility under different conditions like heavy rainfall and storm surge. On the frontend, we built an interactive dashboard using React and Mapbox, where users can select scenarios, explore zones, and view dynamic updates in real time. Overall, the system connects data ingestion, processing, scoring, and visualization into a single pipeline that turns raw infrastructure data into actionable insights.
Challenges we ran into
One of the biggest challenges was connecting the backend data pipeline with the frontend under time constraints. We also had to make sure that switching between scenarios actually changed the underlying data, not just the visuals, which required restructuring how our data was generated and used. Another challenge was integrating the generative AI API to create dynamic explanations. We ran into some authentication and routing issues during development, which made the integration more difficult than expected.
Accomplishments that we're proud of
We are proud of building a complete, end-to-end system, from data processing to an interactive dashboard. We transformed raw infrastructure data into a decision-support tool that not only identifies risk, but explains it and suggests actionable solutions at the local level. We also implemented scenario-based analysis, allowing the system to simulate how different disaster conditions (from everyday flooding to extreme events) change vulnerability across zones. This adds real-world value by helping decision-makers understand and respond to risk before failures occur.
What we learned
Through this project, we learned how to design and build a data-driven system that connects technical analysis with a usable, real-world interface. This involved developing data pipelines, engineering meaningful features, and integrating frontend and backend components into a cohesive workflow. More importantly, we learned that data alone isn’t enough and insights need to be clear and actionable. Translating complex outputs into simple explanations and recommendations is critical for real-world decision-making, especially for non-technical stakeholders.
What's next for DontCollapse
Going forward, we also aim to expand the platform to support additional regions while continuously refining the model with broader datasets. In parallel, we will advance the AI layer to deliver more dynamic, context-aware explanations that improve clarity and usability for end users. Our long-term goal is to evolve DontCollapse into a scalable decision-support platform that can be adopted by city planners, emergency management teams, and infrastructure organizations to enable proactive and data-driven responses to environmental risk.
Built With
- agents
- fastapi
- geojson
- groq
- javascript
- mapbox
- open-meteo-api
- openstreetmap-api
- overpass-api
- python
- rest
- stitch-api
- us-census-bureau-tigerweb-api

Log in or sign up for Devpost to join the conversation.