-
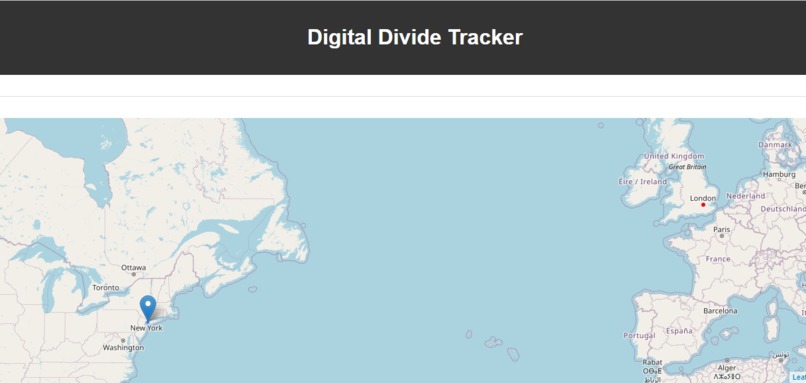
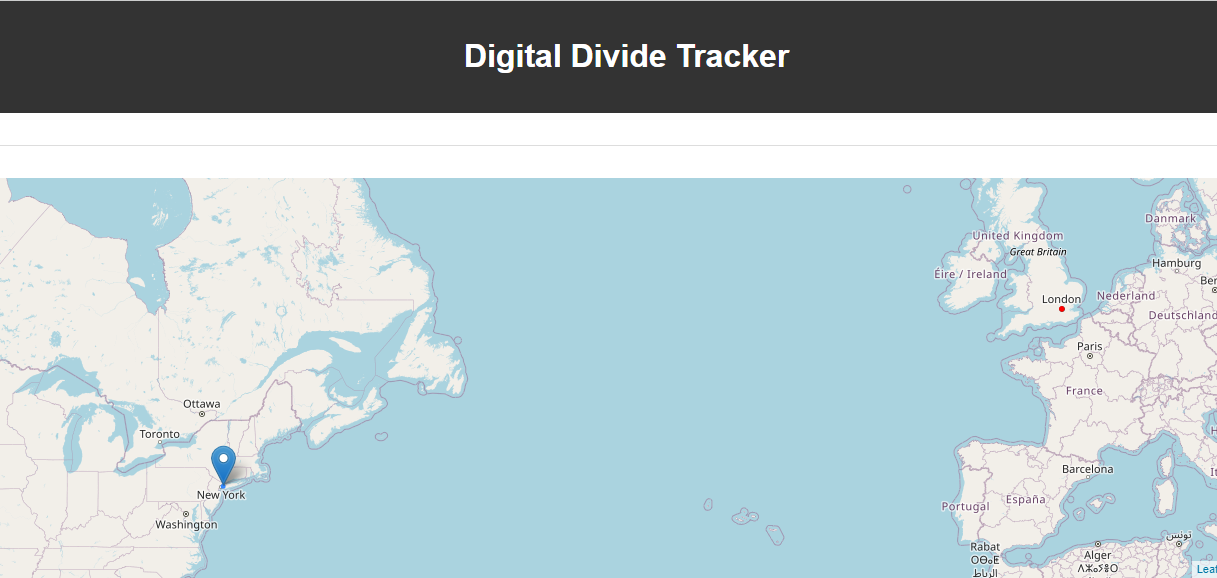
Location markers
Inspiration
Living in NYC, we are privileged to be able to access the internet from almost anywhere we go. We wanted to do research into other areas that don't have as much access as we do, so we researched data across the US to benefit communities in need by providing data for resource allocation.
What it does
We pulled from a database that tells us areas in the US with low broadband access. Our code adds a red circle around that community on the map. In order to make this useful for local organizations, ISPs, and government agencies that want to help reduce the limited broadband accessibility, we ask for the location of the user so that we can pan areas on the map that need help around them. Since it is a work in progress, it is not finished at the moment.
How we built it
We found data from the US Gov's database and used the Leaflet API to create the map and add markings to it and the Geolocation API to track the user's current location. We built our website using HTML, CSS, and JavaScript, using JS to put red circles that highlights areas in need.
Challenges we ran into
Since our database didn't provide the coordinates of each location, we had to code a function that finds the latitude and longitude with the names of counties on the database. We are currently still trying to fix the errors that come with developing this, so our program may not function as expected at the moment.
Accomplishments that we're proud of
We were proud in getting so far despite having just 24 hours to make this. This could be turned into a project used by organizations if we get to finish it. It was gratifying that we were able to research and find such useful data, convert it into JSON so we can use it, then ultimately implement it into our map.
What we learned
How to utilize APIs to gather and utilize mapping using data from JSON files onto our website.
What's next for Digital Divide Tracker
Since this is still a work in progress, we are planning to continue working on it and perhaps turn it into an app so that users can use it on the go. We will expand the usability of this tracker by expanding the database we can pull from and potentially split up these areas based on the level of need and different regions so this program can be effectively used for resource distribution involving tech.

Log in or sign up for Devpost to join the conversation.