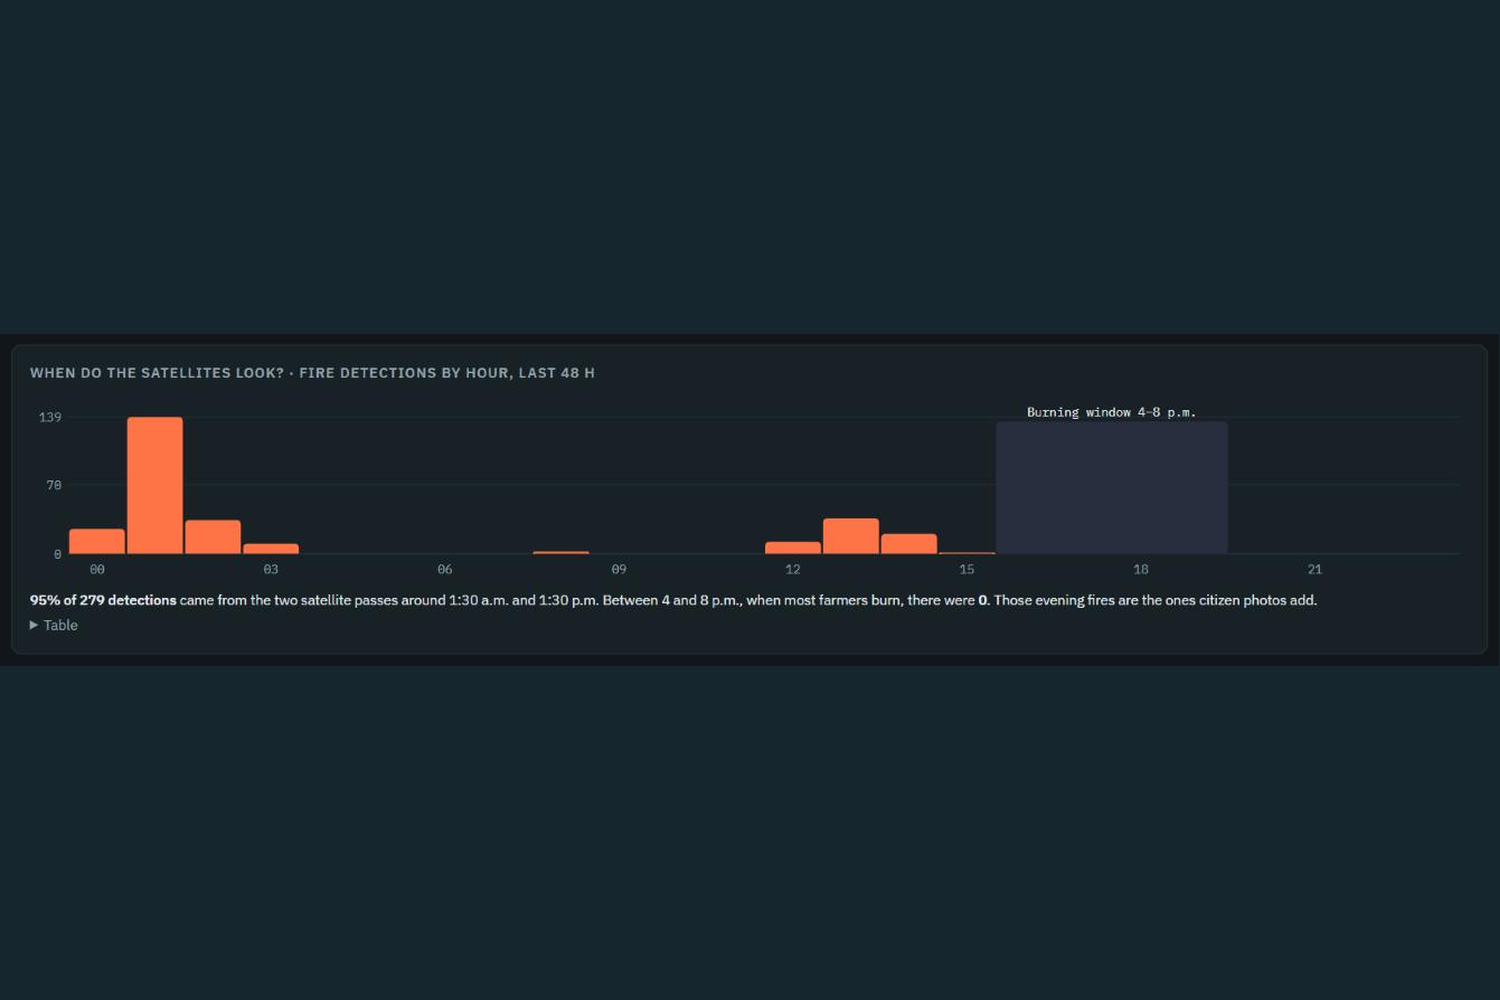
Inspiration Every October and November, farm fires put smoke into the air of central and north India. NASA's fire satellites pass over India around 1:30 at night and 1:30 in the afternoon, but most crop burning now happens between 4 and 8 in the evening. In one 48 hour check of live NASA data for central India (late September 2026) we saw 279 fires, 95 percent of them at those two pass times, and none in the evening window. Air quality apps show an AQI number, but not whose smoke it is or when it will reach a city. We wanted to answer three questions: where is the smoke coming from, who should be told, and how much time is there.
What it does
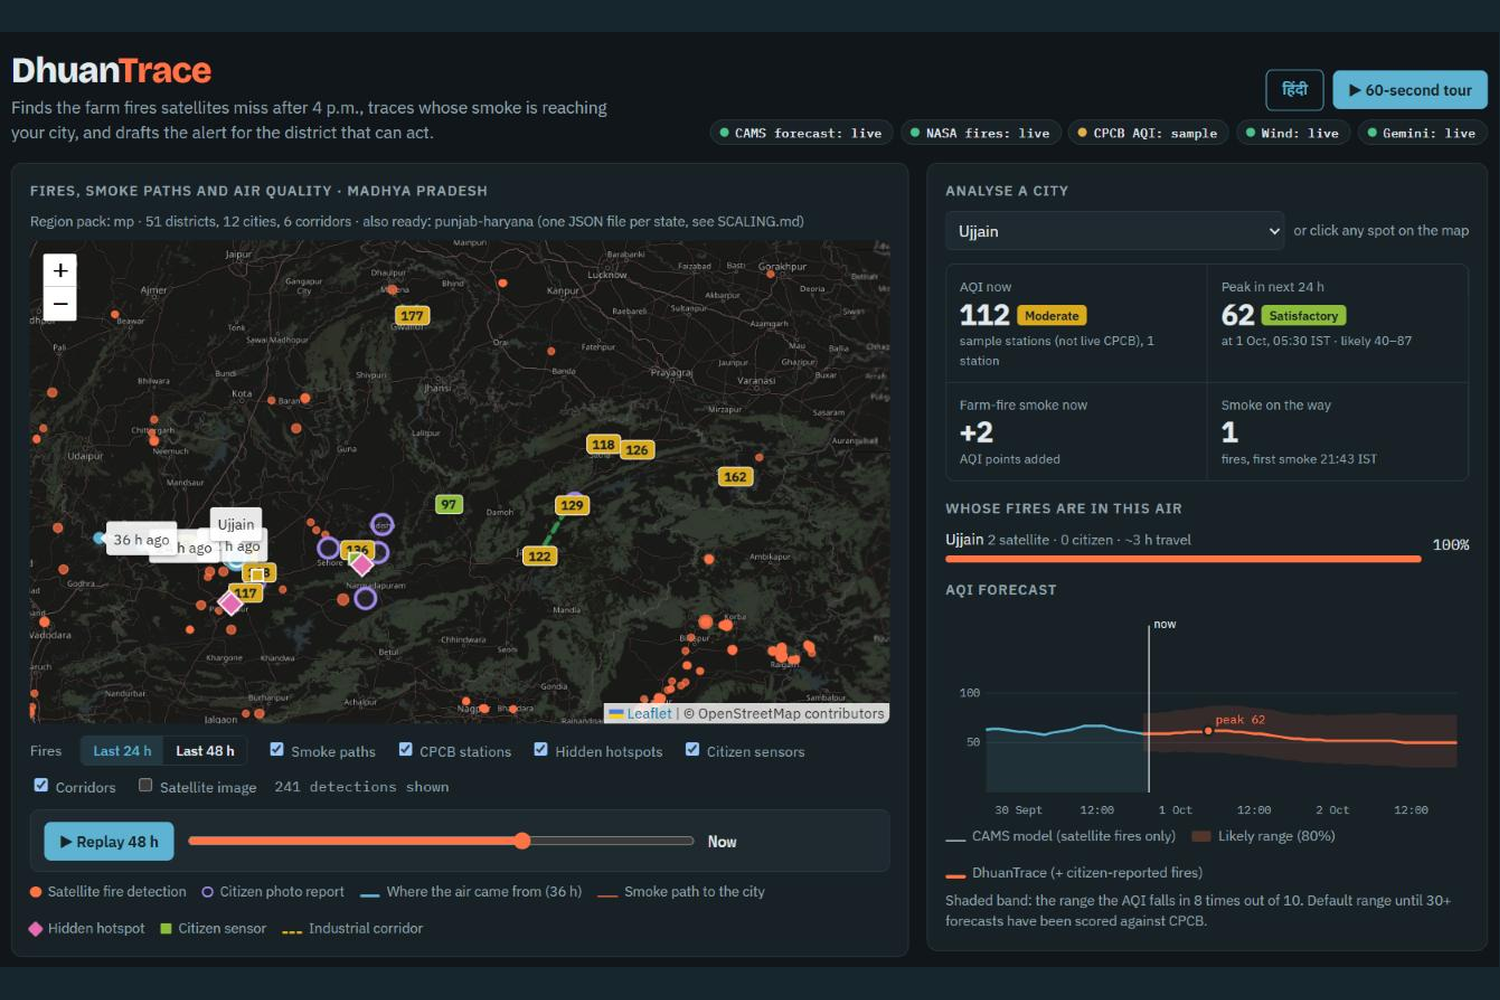
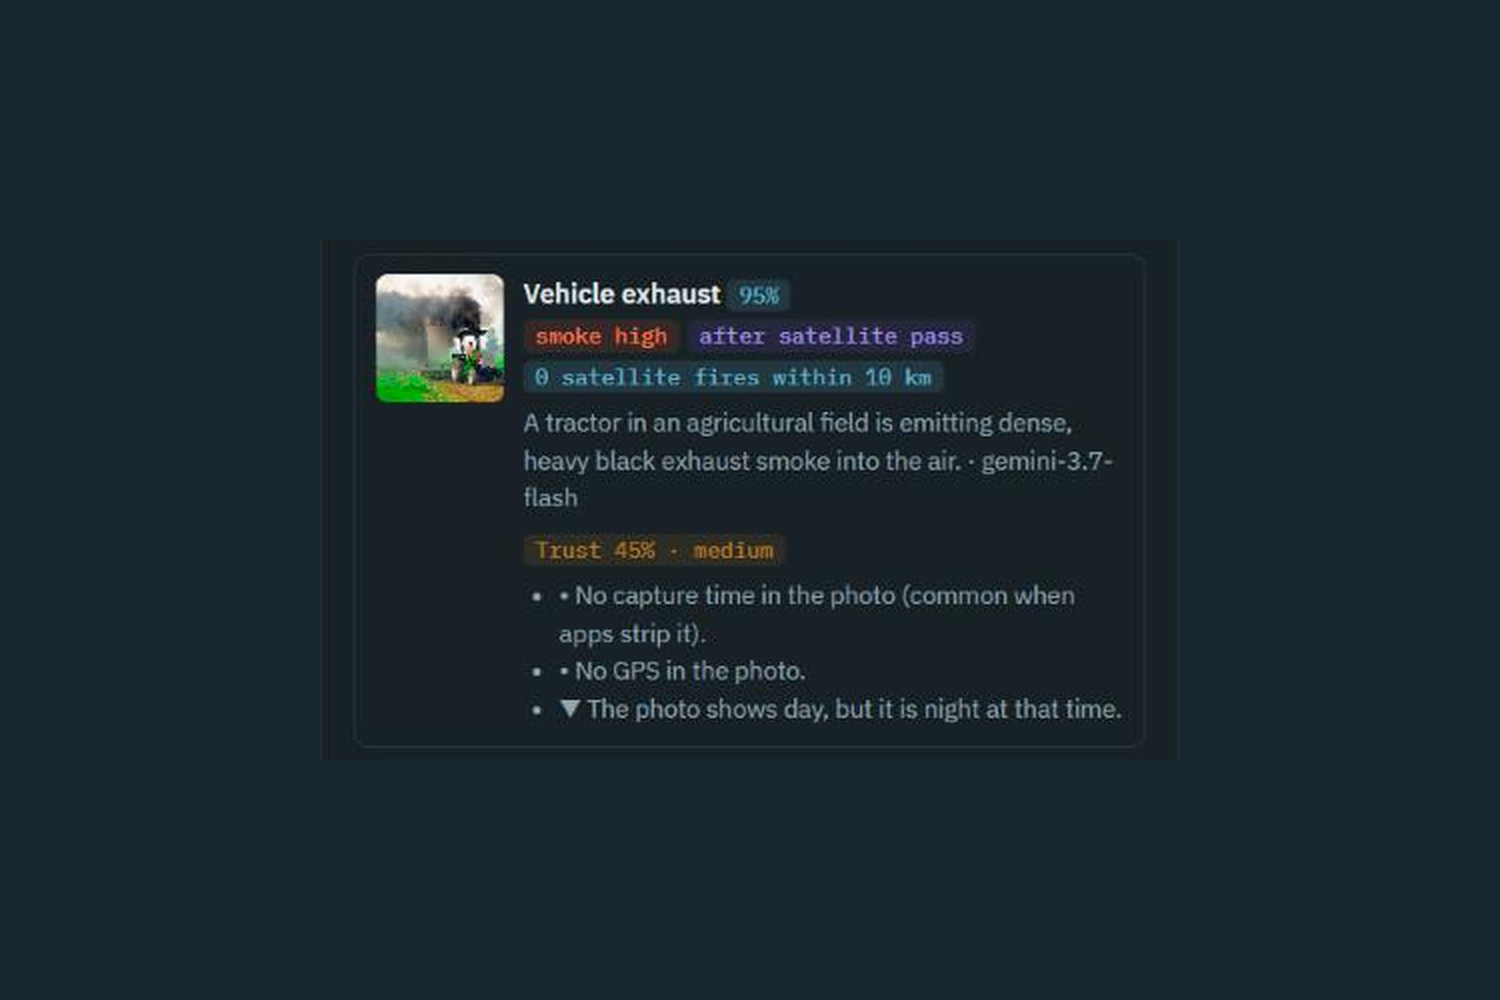
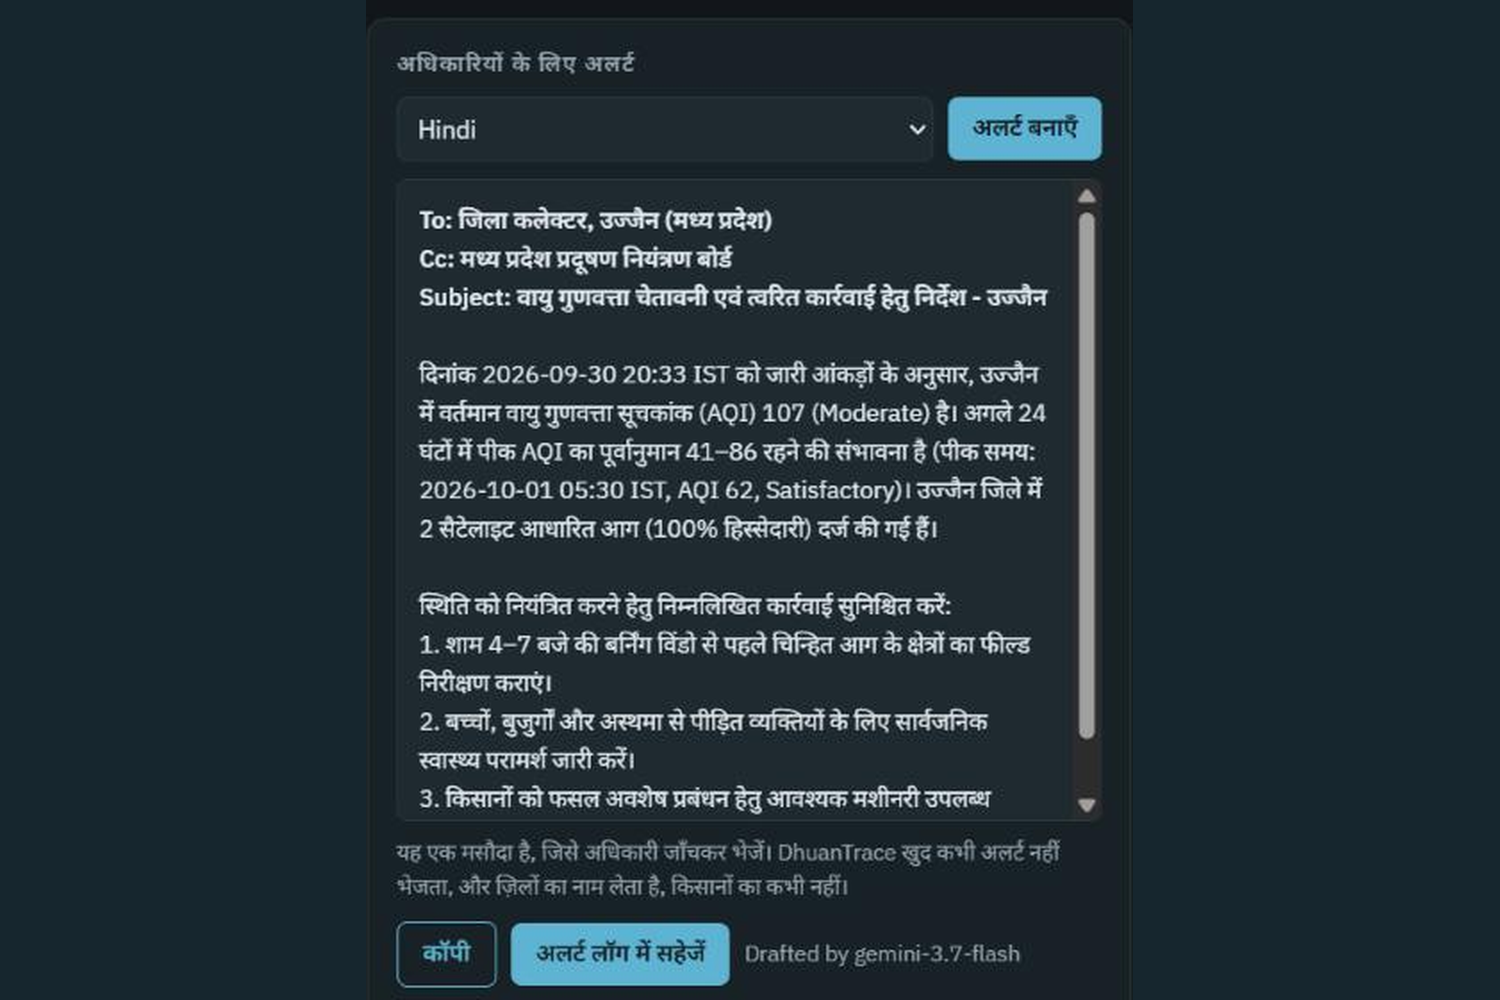
DhuanTrace does three things. Finds the missed fires. Citizens send a photo of smoke. Google Gemini reads it and says what is burning and how much smoke there is. Each photo gets a trust score from the photo time, GPS, duplicate checks and nearby satellite fires. Reports under 25 percent trust are left out of the forecast. Public locations are rounded to about 1 km. Follows the smoke. Every fire's smoke is moved on the hourly wind for 36 hours. For each city the app shows which districts' fires are in its air, each district's share, and the hours until the smoke arrives. A 48 hour AQI forecast is shown as a range, not one number. Tells the right officer. Gemini drafts an alert for the district collector in 8 Indian languages, using only numbers computed by our own code. An officer checks it before it is sent. We name districts, never farmers. It also finds hidden pollution hotspots (checked against NASA aerosol and NO2 satellite layers), sends 48 hour alerts for six industrial corridors, and writes every forecast down before its time so it can be scored against CPCB later. A real test: we uploaded a tractor photo. Gemini said vehicle exhaust, so the app did not count it as crop burning, and gave it a 45 percent trust score (no GPS, daytime photo sent at night).
How we built it
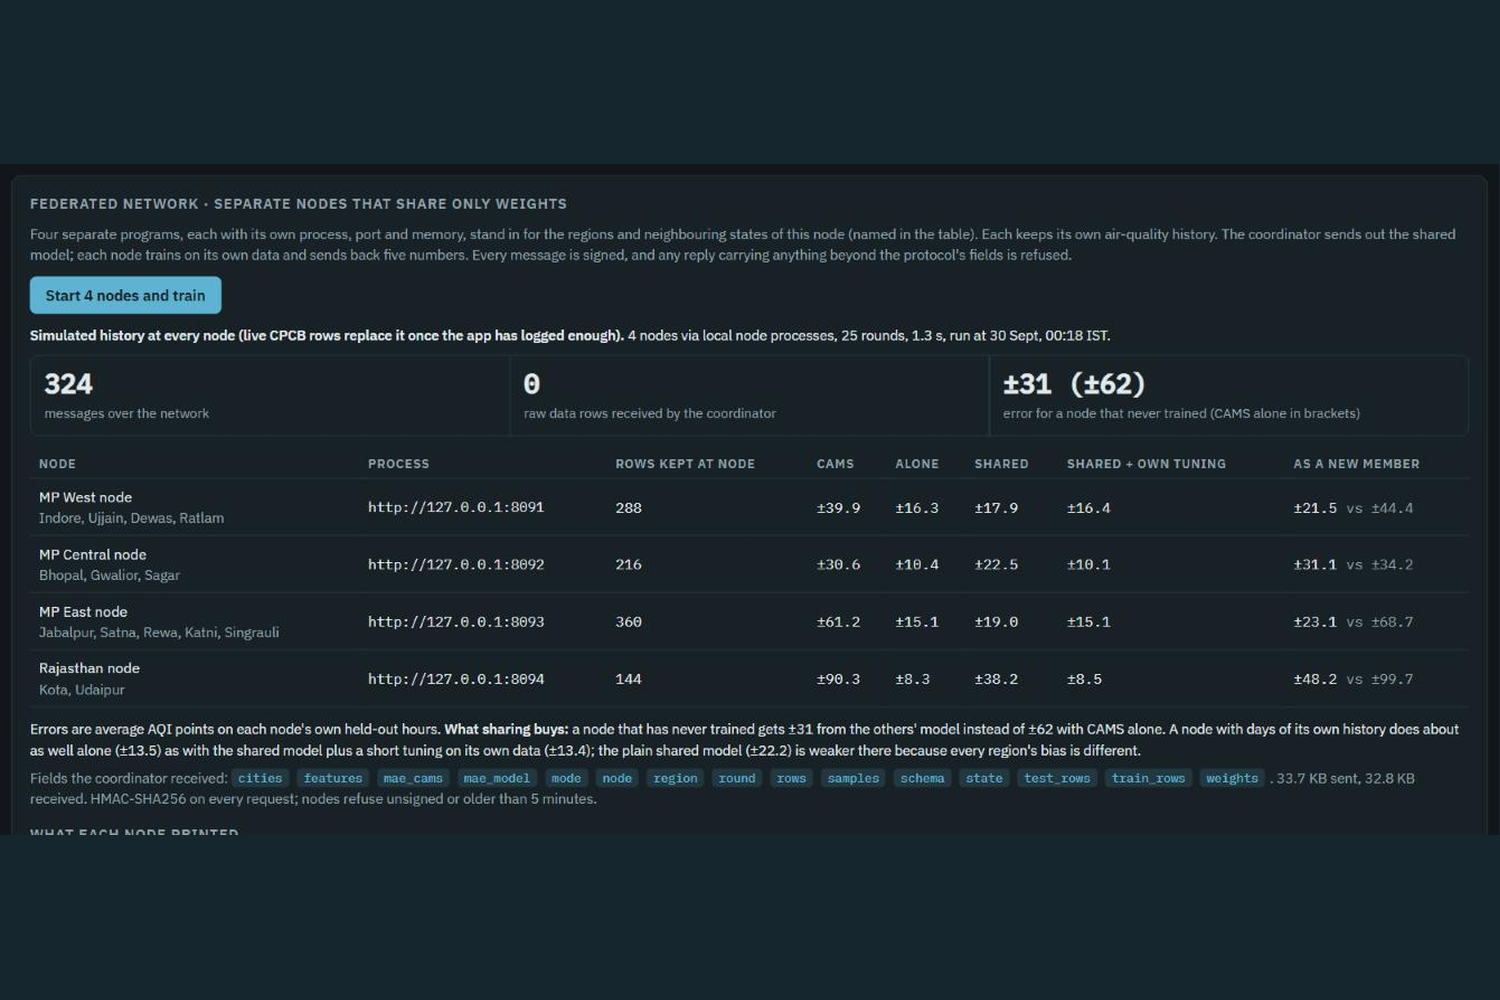
Node.js 22 with no third-party packages. 229 automated tests, run in GitHub Actions. (1)Live data: NASA FIRMS (4 satellite feeds), Open-Meteo hourly wind on a 70 point grid, the CAMS air quality forecast, NASA GIBS imagery, and CPCB real-time AQI through data.gov.in. Smoke tracing is plain, testable wind-trajectory code. Gemini is used for photos, alerts and questions, not for the numbers. (2)Federated learning: four separate node processes (MP West, MP Central, MP East, Rajasthan) train one small forecast-correction model with FedAvg over signed HTTP messages (HMAC-SHA256, replay-protected). Only 5 model numbers are shared and the coordinator received 0 raw data rows. A region that never trained gets about ±31 error instead of ±62 for the CAMS forecast alone. We do not use (03)blockchain; the signed messages are what make tampering detectable. (4)Region packs: a new state is one small JSON file. Madhya Pradesh (51 districts, 12 cities) and Punjab and Haryana (45 districts, 12 cities, smoke crossing into Pakistan) are built and tested with the same code.
Challenges we ran into
Free data sources fail. The CPCB server was down, and the wind service hit its rate limit. We added request sharing and a rule that keeps the last live result for up to 6 hours, labelled with its age, and then falls back to clearly labelled sample data. Our first version counted a tractor's exhaust as farm smoke. We now filter vehicle, industrial and dust reports out of the farm-fire tracing. Making the federated network real (separate processes, signed messages) while keeping the project simple to run.
Accomplishments that we're proud of
-It works end to end on live data. NASA fires, wind, the CAMS forecast and Gemini all run in the working prototype, and the app labels every source as live or sample.
- The tractor test. We uploaded a real tractor photo and the app did not count it as crop burning: Gemini called it vehicle exhaust and the trust score was only 45 percent.
- A real federated network: four separate programs train one model over signed messages, and the coordinator received 0 rows of data.
- 229 automated tests, and a model card and security notes in the repository that state the limits as plainly as the strengths.
- A new state is one small file. Madhya Pradesh and Punjab and Haryana both run on the same code. ## What we learned Honest labels matter more than impressive numbers. Every source in the app says whether it is live or sample. We also learned how much detail is hidden in fire satellite timing, and how to make an AI (Gemini) useful without letting it invent numbers. ## What's next for DhuanTrace A pilot with two districts in the October to November burning season, 14 days of forecast scoring against live CPCB data, and adding more states using region files. Track: Climate Data & Environmental Monitoring · Team Sant: Mohit Katara, Divyansh Mathur, Naman Singh Kushwaha
Built With
- air-quality
- climate
- copernicus-cams
- css
- docker
- federated-learning
- gemini-api
- github-actions
- google-gemini
- html
- javascript
- leaflet.js
- nasa-firms
- nasa-gibs
- node.js
- open-meteo
- openstreetmap
- satellite-data
- vercel

Log in or sign up for Devpost to join the conversation.